


By Djellal Djouad. November 14, 2026.
This article is for educational purposes only. It is not investment advice and not a recommendation to buy or sell anything. Options and futures carry a high risk of loss, and leveraged products can lose more than the amount invested.
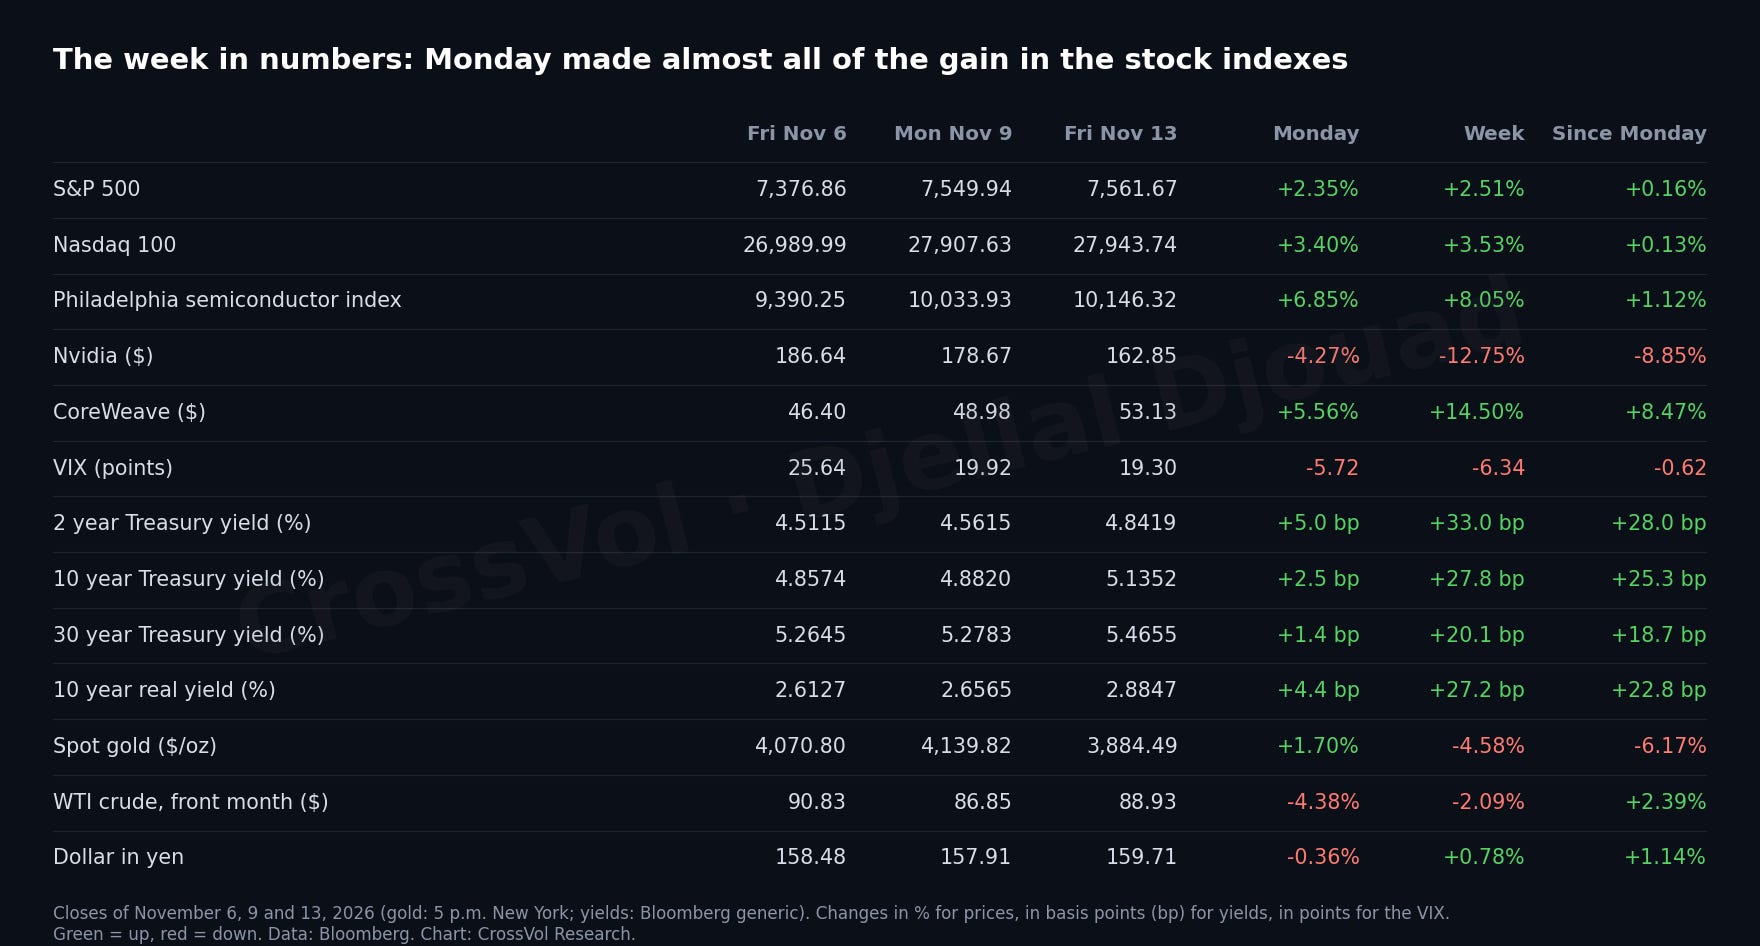
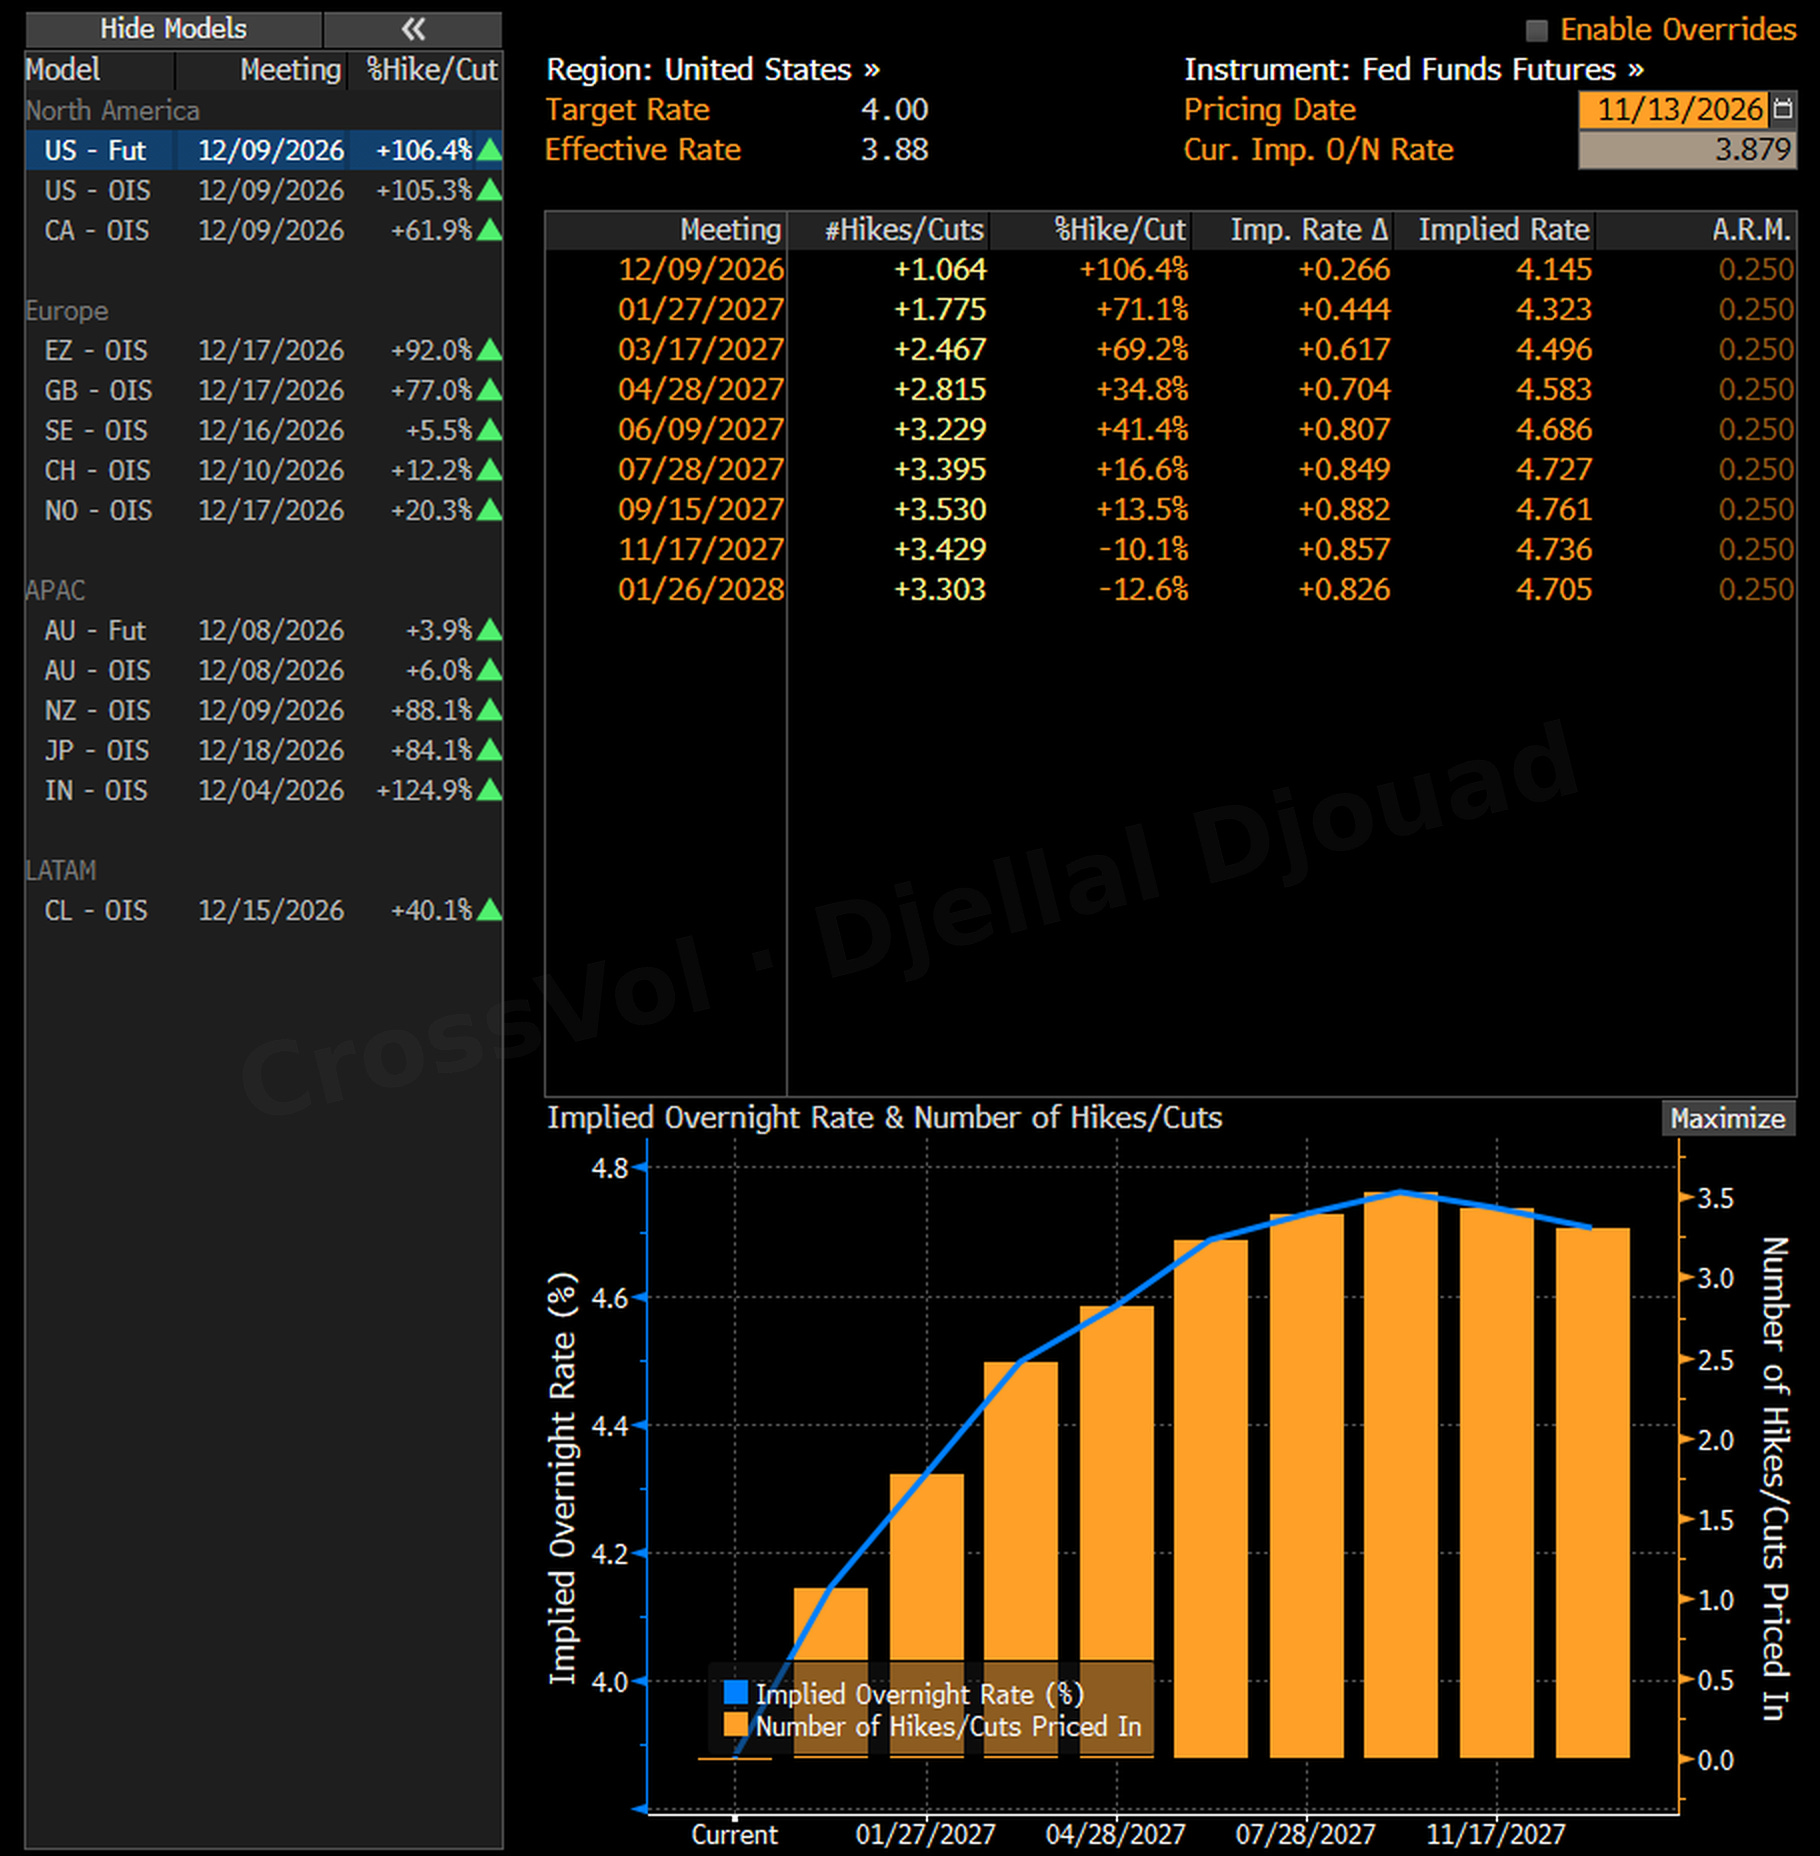
Monday did almost all of the work. The S&P 500 gained 2.35% on November 9 and 2.51% over the week: the four sessions that followed added 0.16% between them. The Nasdaq 100 rose 3.40% on Monday and 0.13% after it. Nvidia lost 12.75% on the week and closed Friday at $162.85, its lowest of the past year, after its chief executive left on Thursday. The VIX, the implied volatility of the S&P 500, fell 5.72 points on Monday, to 19.92, and ended Friday at 19.30. Meanwhile the bond market repriced the Fed: the 2 year Treasury yield rose 33 bp (basis points, hundredths of a percentage point), to 4.84%, and fed funds futures price a hike on December 9 at 106.4%.
Next week, most companies are out of their buyback blackout, Nvidia reports on Tuesday, the Fed publishes the minutes of its October meeting on Wednesday, the VIX settles on Wednesday morning and the monthly options expire on Friday. So the question is simple: will buybacks be enough to carry the market into a Santa rally?
My thesis, in three lines:
The November 9 rally was largely mechanical: the volatility crush forced dealers to buy back their hedges (vanna), and the market has struggled to follow through since.
Hedge funds are still cutting their AI exposure, from the cloud giants to the data center builders and the neoclouds, and credit risk is growing again at the bottom of the junk market and in the neocloud and chip names.
I don't expect a Santa rally before the Fed meeting of December 9, and if the Fed is still hawkish, there will be no Fed put to support stocks.
I checked each piece against the data. It holds, with nuances. And since Veterans Day delayed the weekly report on futures positions to Monday, this week positioning has to be read in the options market.
Was the November 9 rally a vanna rally?
Vanna is how much an option's delta, its equivalent position in the index, changes with implied volatility. After the crash of November 5, dealers were left short the puts investors had rushed to buy, and hedged them by selling futures. When volatility collapses, those puts lose delta, the hedge becomes too big, and dealers have to buy futures back. On Monday the VIX fell 5.72 points.
That is the core of Monday's rebound: a mechanical loop. As the index opened higher and volatility collapsed, the puts lost delta on both counts, because the index rose and because their volatility fell. Each leg forced dealers to buy back hedges, which lifted the index and pushed volatility lower again. Nomura's Charlie McElligott read the day the same way: he called the vanna effect "absolutely massive", with dealers buying back their short futures hedges "into this now virtuous feedback loop as Vol gapped lower".
I measured the loop on the S&P 500 and Nasdaq 100 options, splitting the dealers' hedge buying of Monday by source.
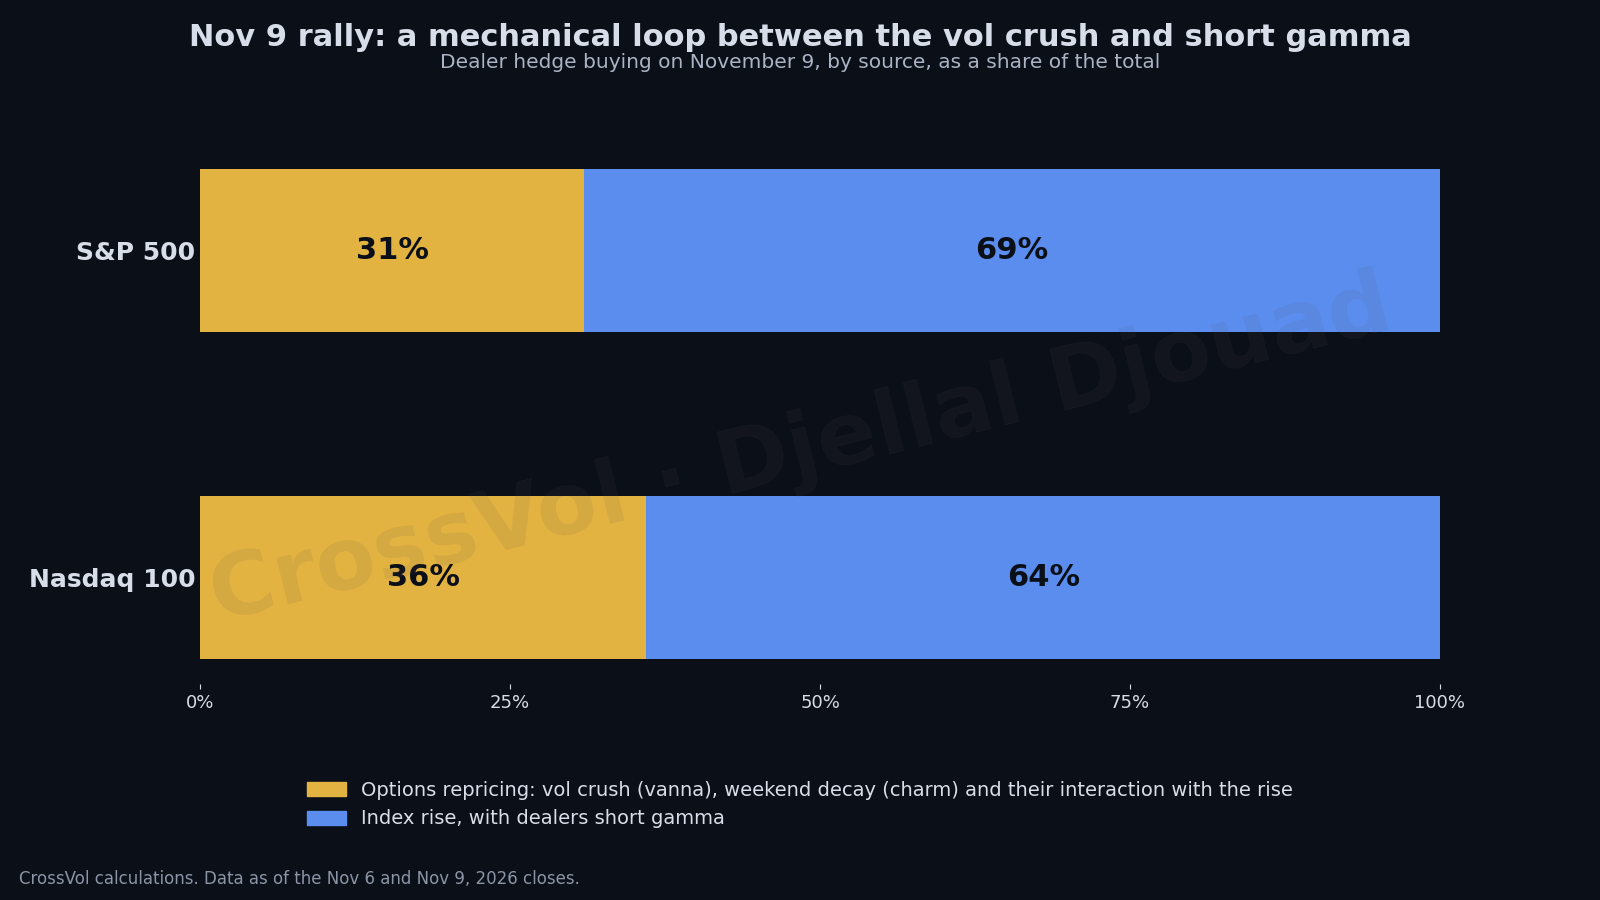
About a third of the dealers' buying came from the options repricing themselves: the fall in implied volatility, the weekend's time decay and the way both compounded the rise, 31% on the S&P 500 and 36% on the Nasdaq 100. The other two thirds came from the rise itself, because dealers were short gamma and had to buy more as the market climbed. The two legs are one loop: the rise crushed volatility, the vol crush made dealers buy, and their buying lifted the index again. On the S&P 500, implied volatility fell 1 to 2 points strike by strike near the money, while the 30 day at-the-money volatility fell 3.6 points: each option lost less volatility than the VIX suggests, which is why the rise of the index carries the larger share.
Vanna was an important engine of the rebound, short gamma its amplifier. That is not good news. A rally driven by forced hedging fades when the forcing stops, and by Tuesday, in McElligott's words, "as the Vol meltdown has stalled-out, so too has the Stock rally". The S&P 500 is still below its gamma flip.
Since then, the indexes have gone nowhere: +0.16% for the S&P 500 and +0.13% for the Nasdaq 100 from Monday's close, both below their Wednesday peak. Under the surface, the AI trade split. Broadcom and AMD kept rising until Thursday, then fell 4.8% and 8.8% on Friday; Nvidia lost 8.9% and Nebius 18.1% from Monday's close. Last week, in Stock Market Crash: What Happens Next, From a Dead Cat Bounce to the AI Bomb, I wrote that the real danger of these two weeks sat with the AI landlords and their supplier reporting this month: the index held up better than I expected, but Nebius and Nvidia took the hit, and the neocloud rebound faded on Friday. I lost on my short-term earnings trade on Nebius, but the method is sound: I laid it out step by step before the report, in How to Trade Earnings With Options: My Nebius (NBIS) Earnings Trade.
Will buybacks be enough to support the stock market?
Companies stop buying back their shares in the weeks before their results and resume once they have reported. On Bloomberg, 454 of the 500 companies of the S&P 500 had reported their third quarter by Friday, 91%, with earnings 3.95% above forecasts in aggregate; in technology, 19 of 70 have yet to report, Nvidia among them. So most of the index is back in its buyback window. That bid is real, but slow. Here is what it faces.
Trend followers (CTAs). They were the big sellers of November 5. On our trend model, they bought back part of it on Monday and now hold only a small long, near the bottom of their range of the past year: they would add on a further rise and sell again on a renewed drop.
Volatility-target funds. They size their stock exposure on realized volatility, and the realized volatility of the S&P 500 has almost doubled since the end of October, because big up days count as much as big down days. So these funds sold into the drop and had no reason to buy Monday's rally. Nomura put their equity holdings at $116.1 billion on Tuesday, an 11th percentile reading over three years. They can only add back exposure once the November turbulence fades from their measures, and that takes weeks.
Leveraged ETFs. They rebalance at the close, in the direction of the day's move. Nomura put the complex at $151.5 billion on Wednesday, with about $7.6 billion to trade for each 1% move, and estimated during that session $26.5 billion of buying into the close, 56% of it in chips, about half the $48.6 billion these funds had sold at the close of November 5. On Friday, with chips down, the same mechanism sold into the close.
Hedge funds. They are still the sellers. In the first week of November, Goldman Sachs' prime brokerage data showed US fundamental long/short funds cutting their gross leverage by 8.7 points, the largest weekly drop since March 2020, and their net leverage to 43.3%, the lowest in five years. Net leverage was already at that floor in my review of October 25, Stock Market Week in Review (October 19-23, 2026); what changed in November is that gross leverage finally came down. Technology was by far the most sold sector, at a pace on par with the heaviest selling weeks since 2016, and industrials, the AI picks and shovels, came second. Monday's rally did not change that: on our systematic monitor, the pressure on hedge funds to cut exposure reached its highest level of the year on Thursday, November 12, and was still elevated on Friday. The neoclouds are in the line of fire. In an October survey of more than 700 hedge funds, released on Friday, more funds were short Nvidia, Amazon, Apple and Meta, and the share of CoreWeave's lendable stock out on loan rose from 35% to 59%. On Friday, a Bloomberg markets note summed it up: "The recent neocloud relief bounce is reversing Friday as execution and funding concerns resurface."
So buybacks face mechanical sellers who have mostly stopped selling but are not buyers yet, and hedge funds that still lean against AI. Buybacks can support the level. On their own, they cannot set the slope.
What are funding markets saying for the coming weeks?
The plumbing gave the first warning. For ten sessions in a row, from October 23 to November 5, SOFR, the rate on overnight loans backed by Treasuries, traded above the 3.90% the Fed pays on bank reserves (IORB), up to 3.97% on November 3, and its 99th percentile reached 4.05%, above the rate of the Fed's standing repo facility, 4.00%. Dollars were already getting dearer for European borrowers: the euro's three-month cross-currency basis reached minus 4.8 bp on October 23, the day repo went above IORB, as I showed in Why the Euro Is Falling Against the Yen: French Stress Has Reached Dollar Funding.
The driver was the Treasury's cash account at the Fed: every dollar parked there leaves bank reserves. It rose to $1,052.5 billion on October 27, as SOFR went above IORB, and fell to $910.3 billion on November 6, the day SOFR fell back below it. The November 9 rebound came with that tailwind.
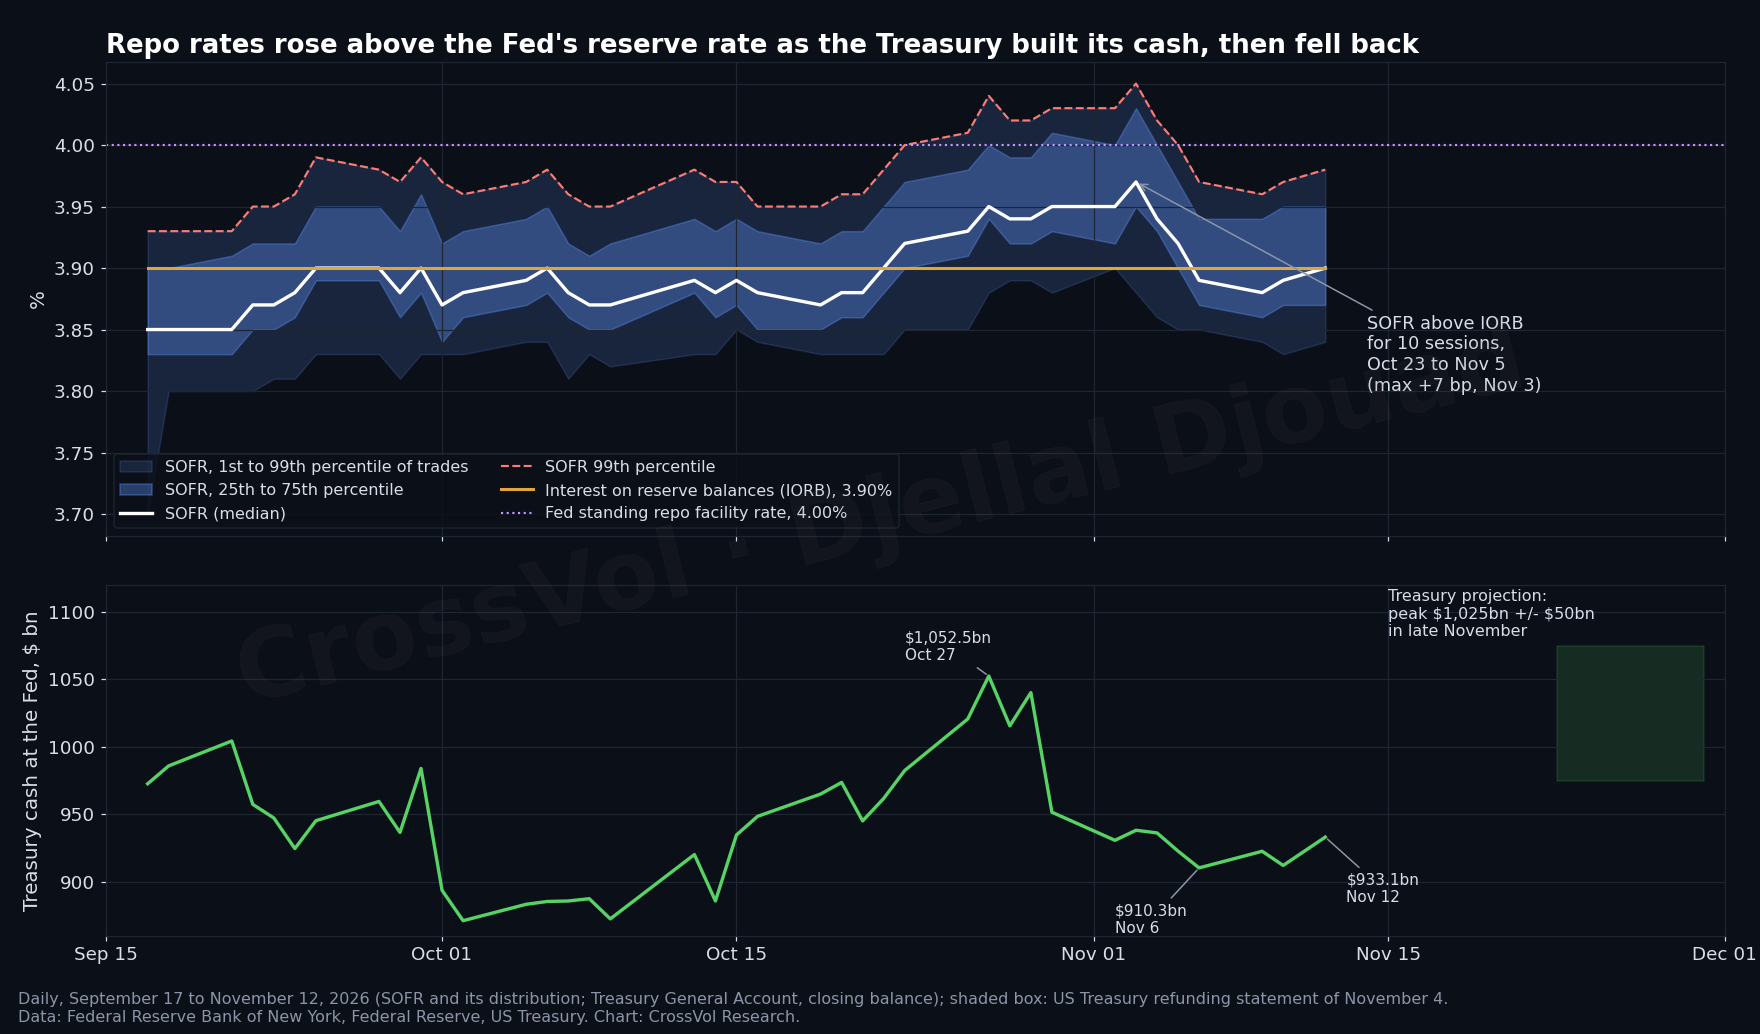
That tailwind is about to reverse. On November 4, the Treasury wrote that its cash balance "could peak at $1.025 trillion (plus or minus $50 billion) in late November", about $90 billion above Thursday's $933 billion. With the Fed's reverse repo facility empty, the build comes out of bank reserves, $2.96 trillion in the week to November 11, about 11% of commercial bank assets: the late October setup again, into the November 30 month end.
Monday itself is not the drain: the $125 billion of 3, 10 and 30 year debt that settles raises about $28 billion of new cash, but the Treasury pays its mid-quarter interest the same day, $78 billion to $85 billion on each of the last four such dates. The drain comes from bills, at least $33 billion of new cash on Tuesday and $13 billion on Thursday, and from the build into late November. A December hike would not widen these spreads by itself, since it lifts IORB and SOFR together. Scarce reserves do.
Then the tide turns. The Treasury assumes an $850 billion cash balance at the end of December, about $175 billion below the projected peak: money that flows back into reserves through December. The funding calendar points the same way as my bet.
Why is the Fed a ceiling, not a floor?
The Fed raised its target range to 3.75% to 4% in September and held it in October, with two members voting for a hike, a split I covered in The Megacaps Did Not Outrun the Fed. On Friday, fed funds futures priced 1.064 hikes by December 9, a quarter point fully priced plus about a 6% chance of a half point, 1.775 hikes by January 27, and a peak of 4.761% in September 2027, 88 bp above the effective rate of 3.88%. On October 30, the December hike was priced at 72.9%.
Three things did it. On Tuesday morning in London, Governor Christopher Waller said he was leaning toward a December hike, and that "a 50 basis point hike in the policy rate should be considered" if core inflation ran "around 0.3 percent or even higher". Hours later, core consumer prices rose 0.3% in October, the third such month in a row, and the headline index 0.4%. On Friday, producer prices without food, energy and trade margins rose 0.5%, against 0.4% expected, even though the headline index rose only 0.3%.
The 2 year yield rose 33 bp on the week, more than the 10 year (28 bp, to 5.14%), and the 10 year real yield reached 2.88%, near its one-year high of 2.94%. The Fed put, the belief that the central bank will cut rates to rescue stocks, needs room to cut. With core prices rising 0.3% a month, the most the Fed can offer in December is to stop hiking. That lifts a ceiling; it does not lay a floor.
The havens agree. Gold lost 4.6% on the week, to $3,884.49 an ounce, $9.87 above its October 30 close, the lowest of the past year, and long Treasuries fell on each of the three days stocks fell. When the threat is the Fed itself, bonds and gold stop protecting. I made that case for gold in July, in Gold Stopped Being a Safe Haven, and again on October 30, in Why Gold Is Falling: The Market Is Pricing a US Slowdown: two weeks later, gold is back near its low and the market prices more hikes, not fewer.
Where is credit cracking?
At the bottom of the junk market, and in AI. The spread of Caa-rated US high yield bonds, one of the weakest tiers, over Treasuries was 1,083 bp at the latest reading, 66 bp wider than a month earlier and almost twice its February low, after a one-year high of 1,127 bp on October 23. The broad high yield index is calm, at 316 bp.
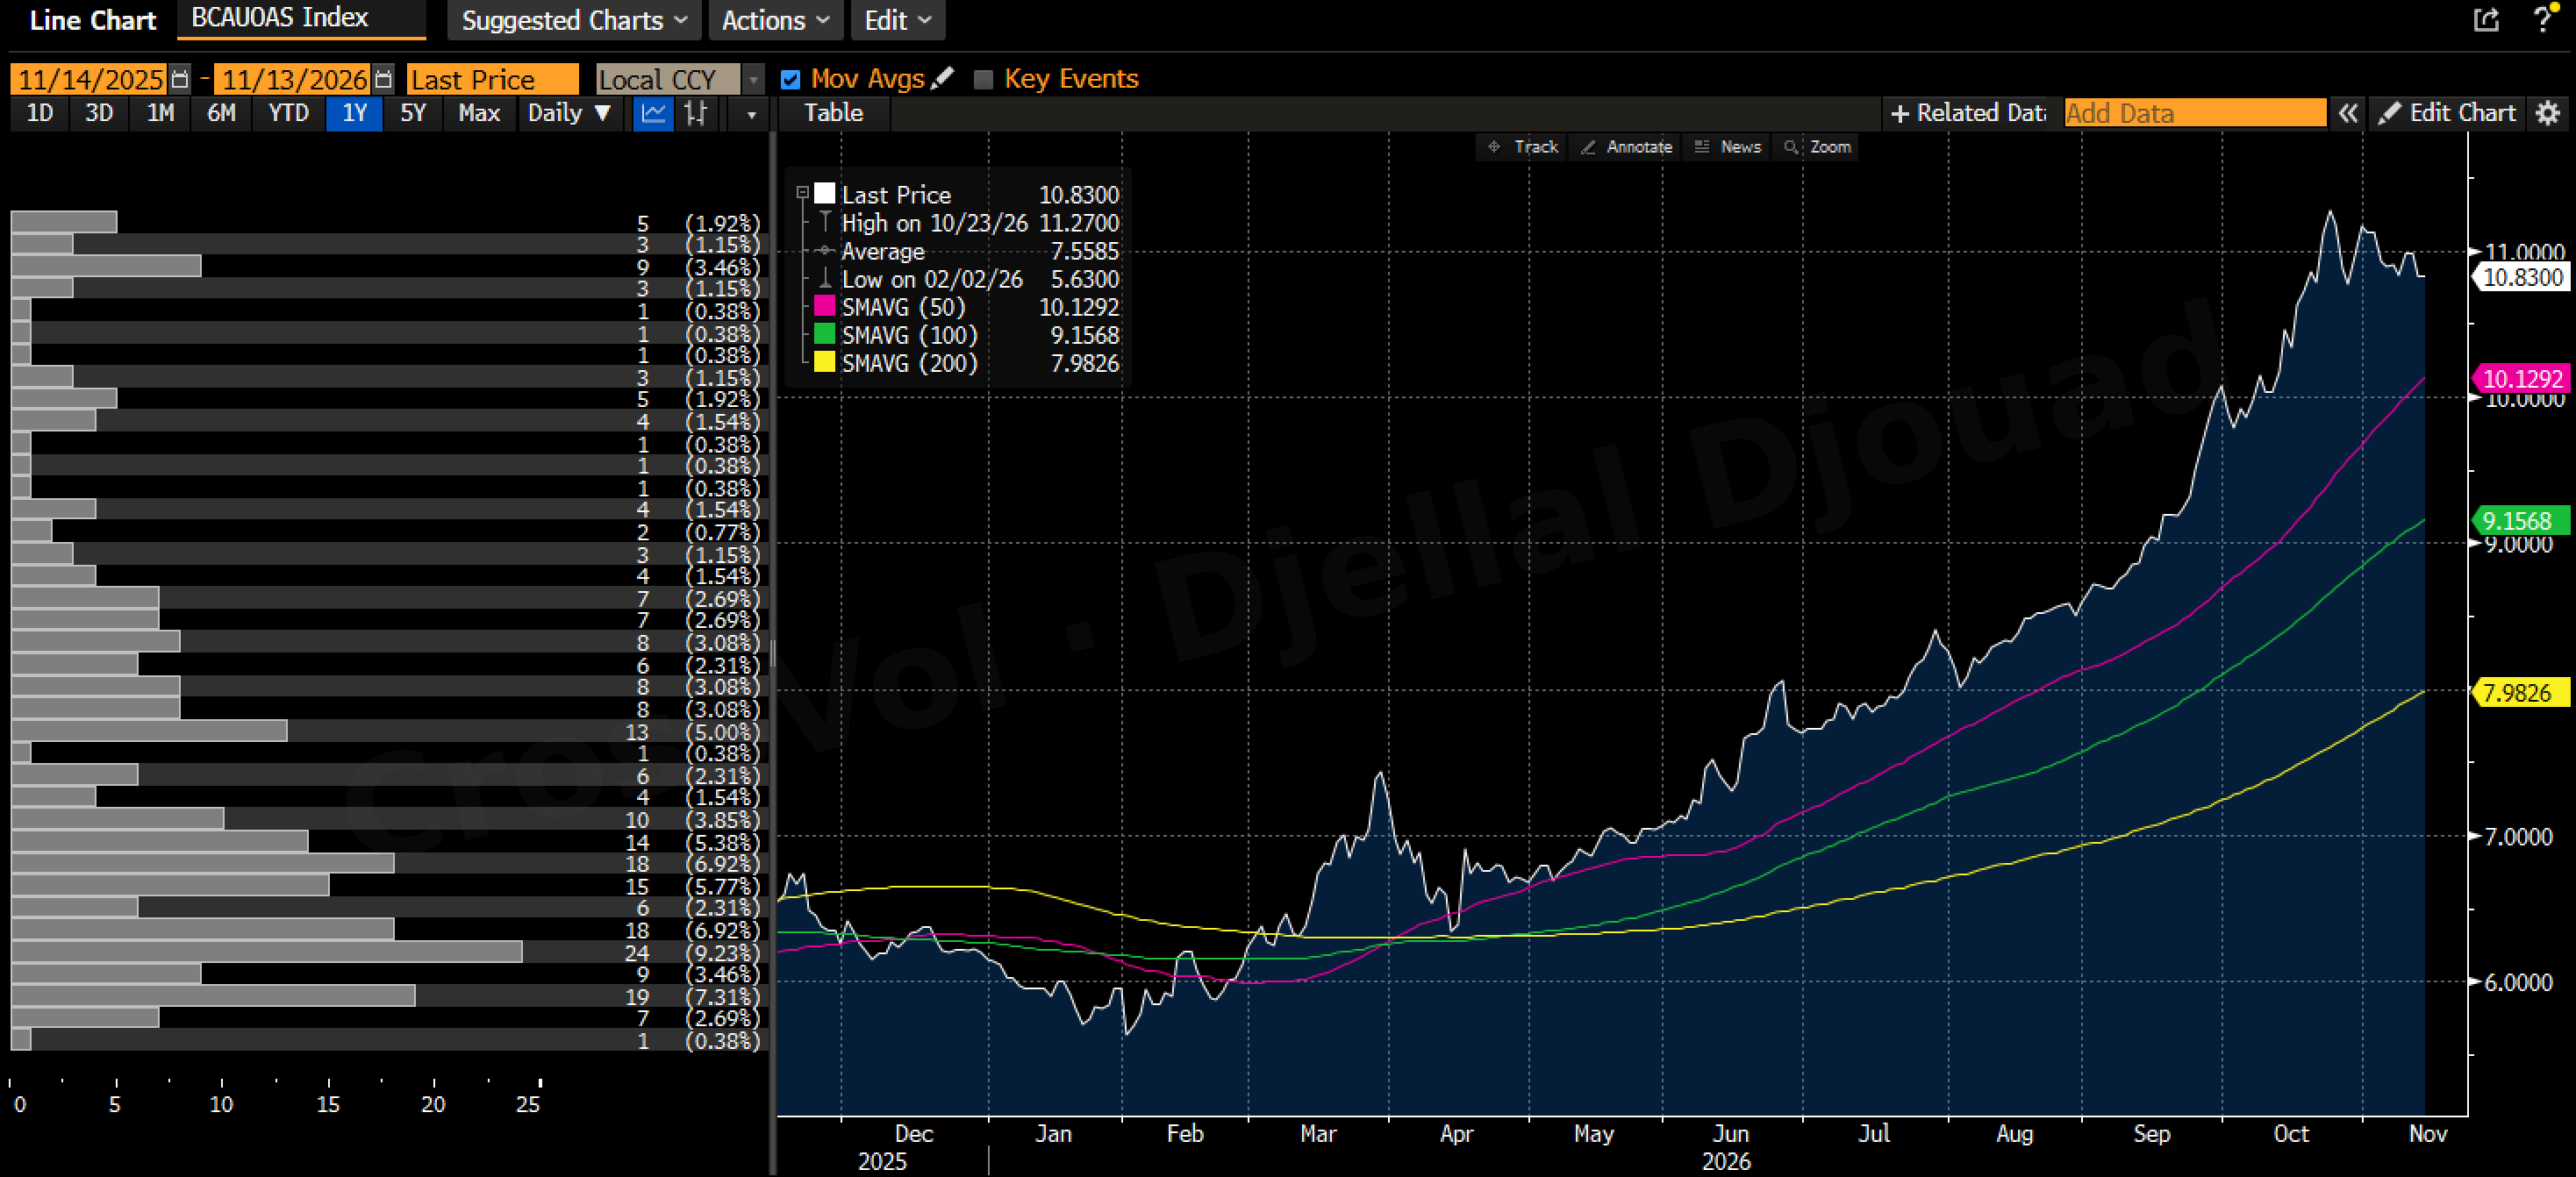
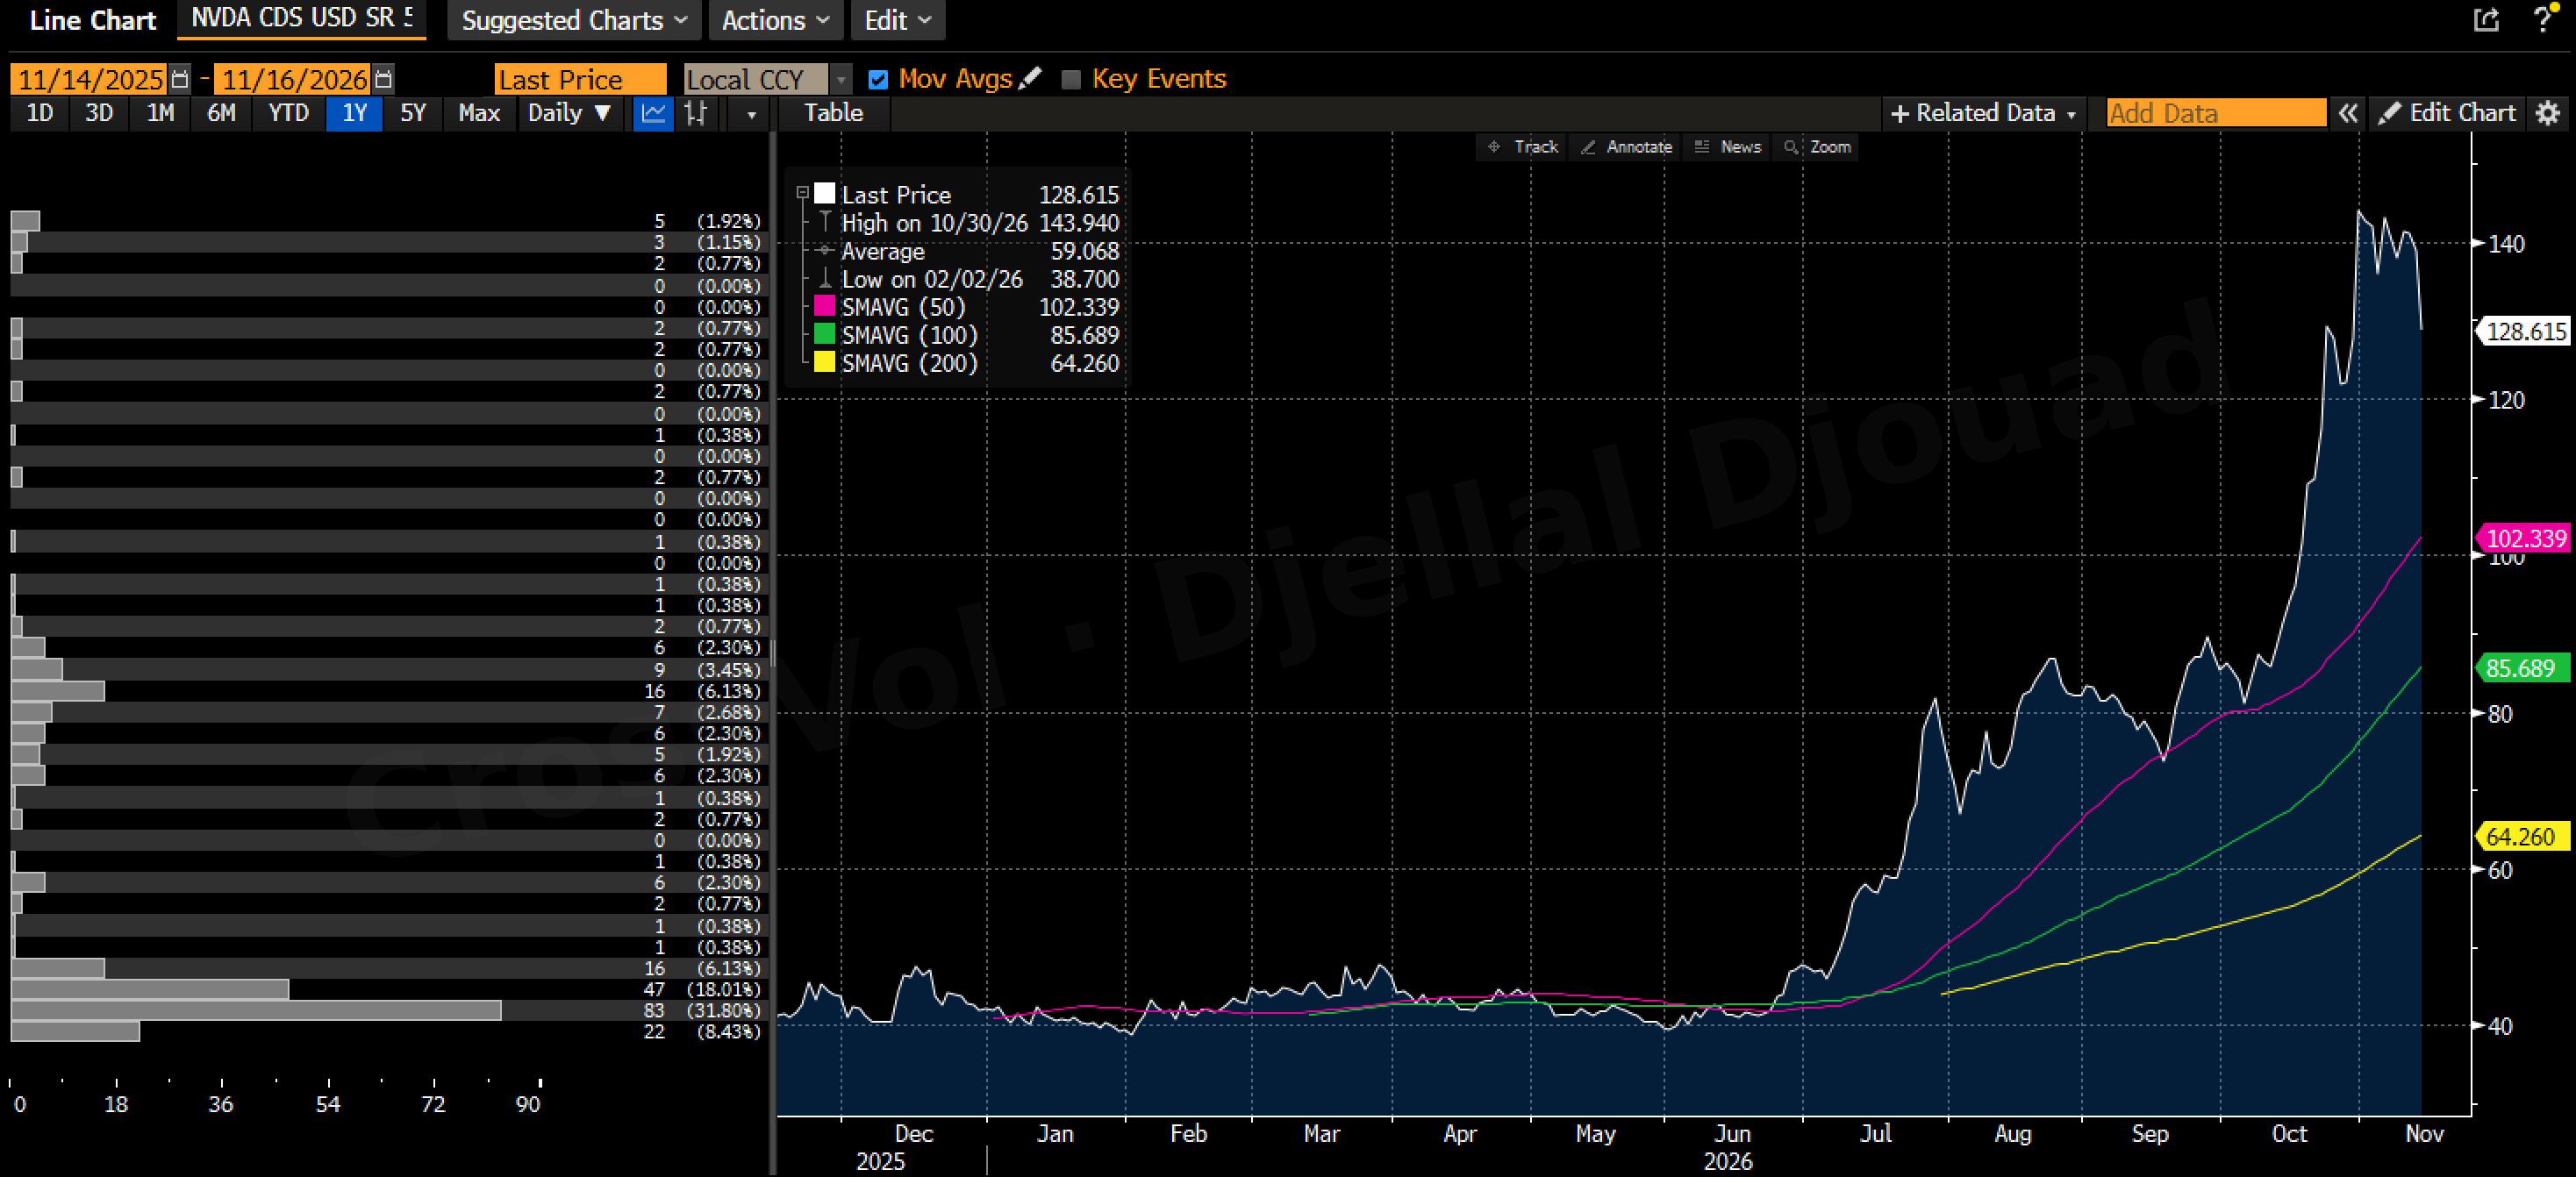
In AI, the stress sits with the chip makers and the neoclouds, the companies that rent out AI chips. Over the month to Friday, Nvidia's five year credit default swap (CDS), the annual cost of insuring its debt against default, rose 41 bp, or 46%, to 128.6 bp, 3.3 times its February low. Oracle's ended at 299.3 bp, against 263.2 bp on October 13, and CoreWeave's at 1,083.8 bp, against 982.1 bp, after a peak of 1,289.5 bp on November 5. Meta's rose only 5 bp over the month, to 108.6 bp.
This week, credit first eased from its early November peaks, then widened again on Friday: CoreWeave's CDS by 29.8 bp, Oracle's by 4.5 bp and the high yield index by 4 bp, while Nvidia's narrowed 10.2 bp, the day after its chief executive left. CoreWeave is back with its lenders: Bloomberg reported on Wednesday that it was in talks with banks for an investment-grade loan of at least $4 billion. That is the risk I described on November 5 in The AI Depreciation Bomb: The Chips Last Three Years, the Loans Last Ten: the debt that finances AI data centers outlives the chips it pays for. Index volatility has not followed credit: the VIX, at 19.30, sits close to its one-year average of 18.11, while the Caa spread is near its high.
Why does Japan matter for US stocks?
Yen money is getting dearer. In Tokyo, the three-month interbank rate (TIBOR) has stood at 1.787% since November 6, its highest in at least a year and 55.5 bp above the Bank of Japan's overnight rate. That gap has been wider on only 2% of the days since 2014. Its record, 67 bp, was set on September 17, the day before the Bank of Japan's last hike.
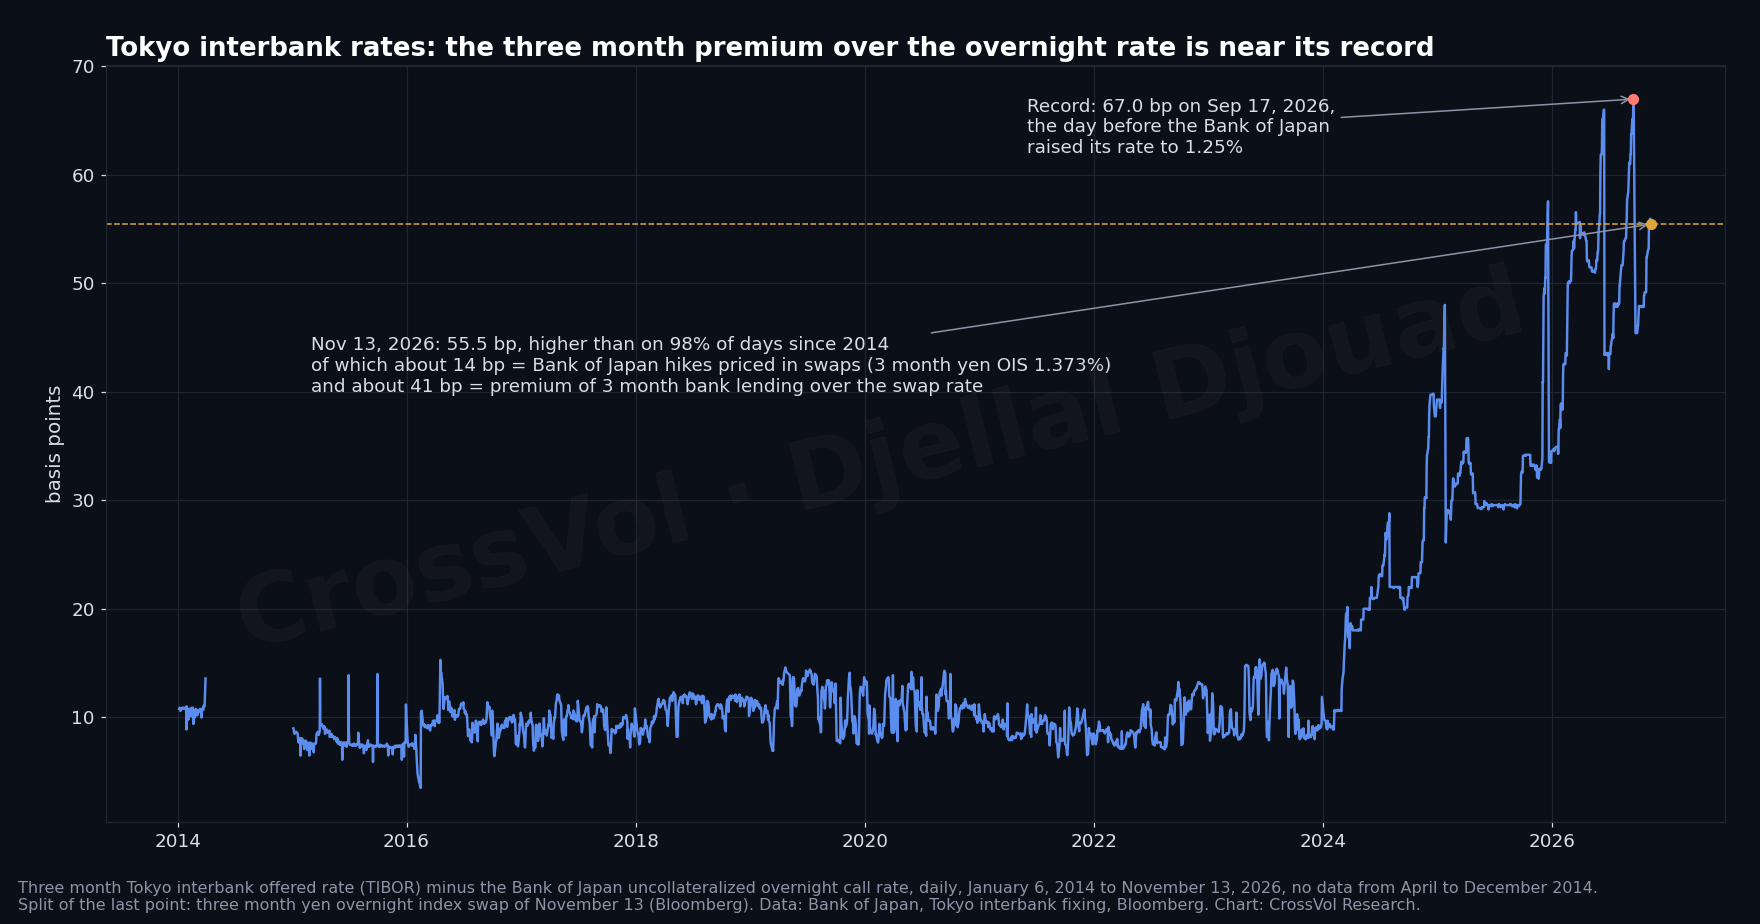
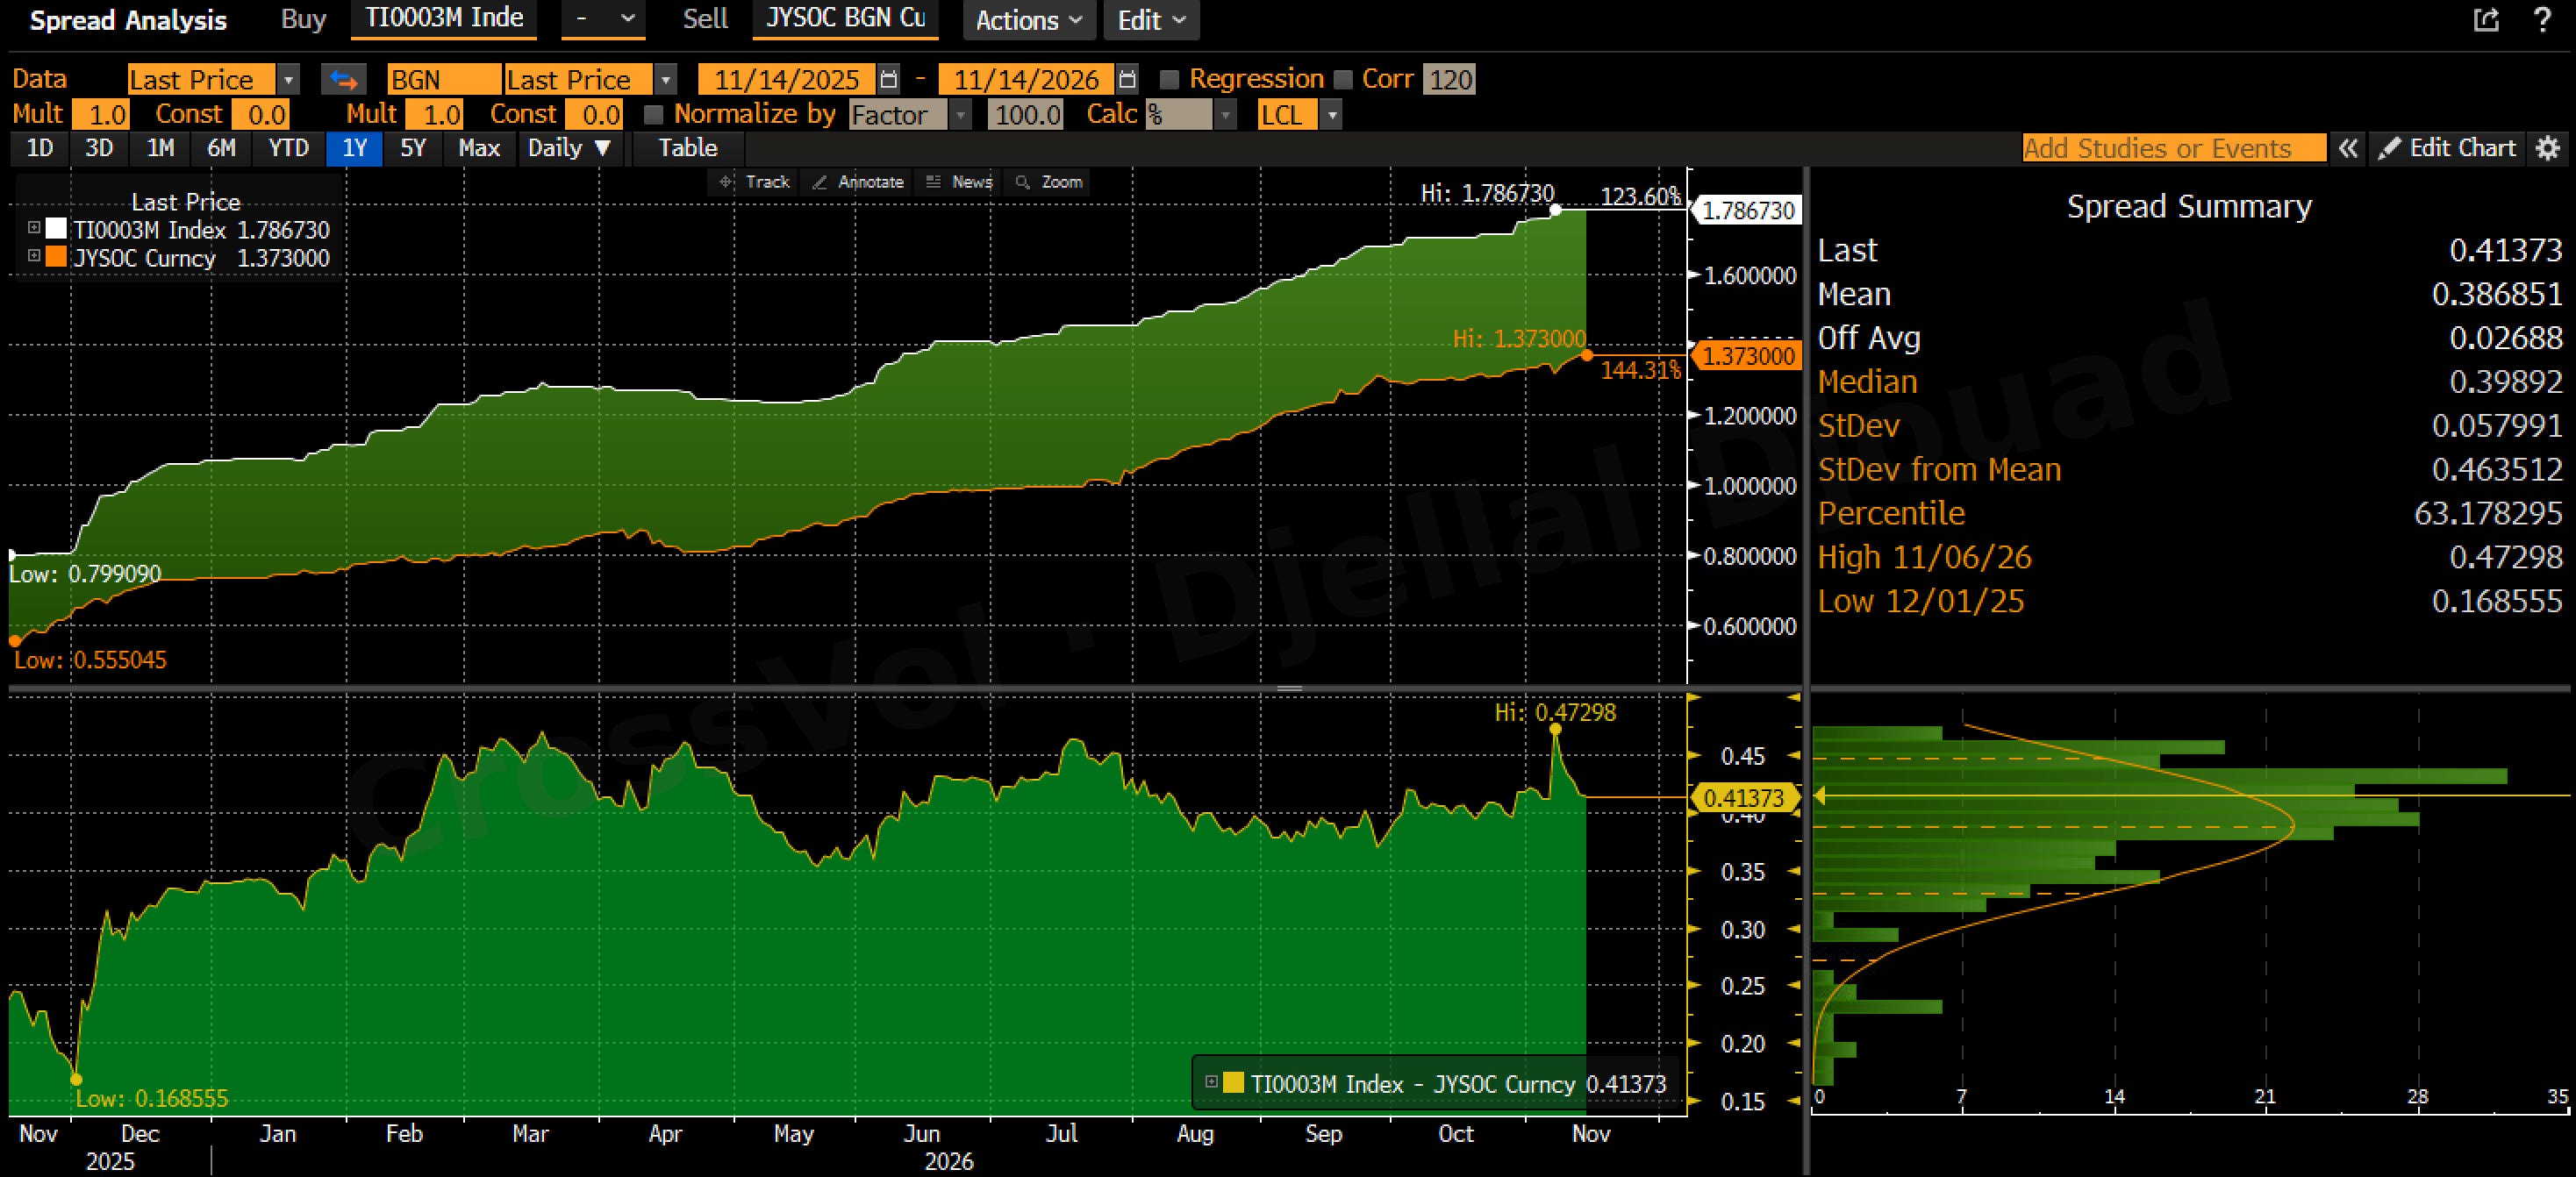
Part of it is the next hike. Swaps price a move on December 18 at 84.1%, and about three hikes by October 2027. The three-month yen swap rate, which prices only the expected overnight rate, is 1.373%, so about 14 bp of the gap is the central bank and 41 bp is what Tokyo banks charge each other on top. That premium jumped to a one-year high of 47.3 bp on November 6, the morning after Wall Street's worst day of the month, before easing toward its one-year average of 38.7 bp.
The 10 year JGB yield rose 21.7 bp on the week, to 2.871%, and the yen still fell, to 159.71 per dollar, because the Fed's path rose faster. Two channels lead back to New York. Japan is the largest foreign holder of Treasuries: $1,068 billion at the end of August according to the US Treasury, against $1,239 billion in February, a figure that includes the fall in bond prices. With the dollar overnight rate at 3.88% and the three-month yen swap at 1.37%, hedging the currency costs at least 2.5 points a year before the cross-currency basis, so a hedged 10 year Treasury yields less than a 10 year JGB at home. And yen-funded trades: after the Bank of Japan hiked on July 31, 2024, a stronger yen forced a fast unwind of positions financed in yen, and on August 5 the Nikkei fell 12.4% in a single session.
What does options positioning say for next week?
All figures use Friday's closes and the open interest of Thursday's close, the last one published.
S&P 500 and Nasdaq 100: below the gamma flip
The S&P 500 ended at 7,561.67, 1.1% below its gamma flip at 7,642, the level where the dealers' net gamma changes sign. Below it, dealers are short gamma: their hedging sells into declines and buys into rallies, so moves get bigger. For next week's expiries, November 16 to 20, the flip is 7,639, and the gamma sits at the 7,500 and 7,600 strikes. The large open interest at 8,000 in calls and 7,000 in puts is mostly paired positions at the same strikes, which largely cancel out.
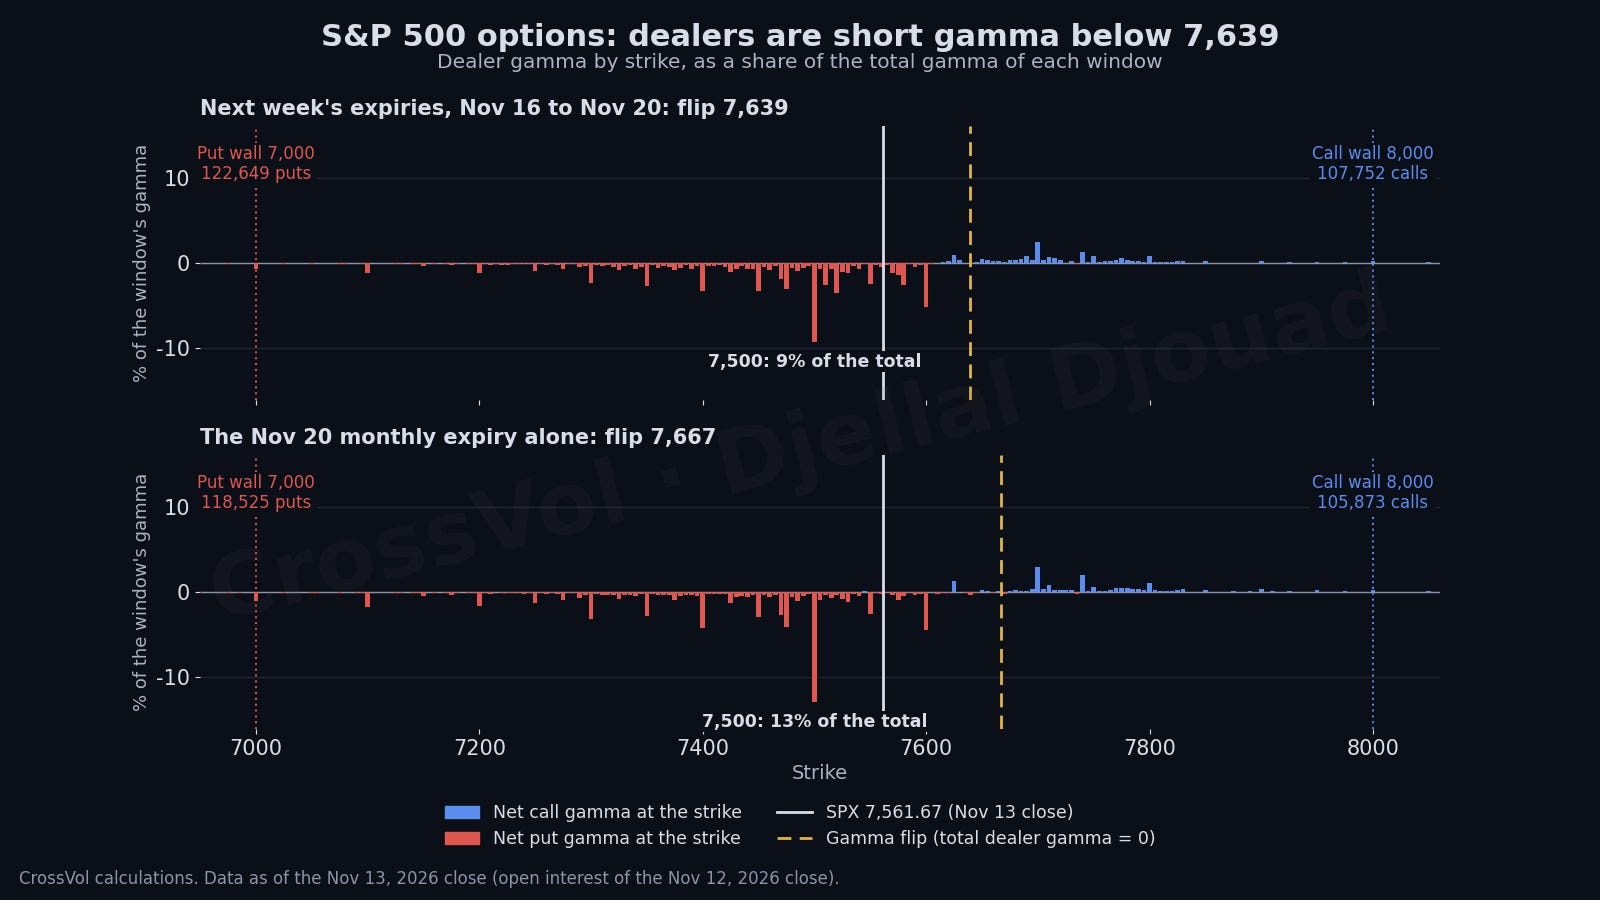
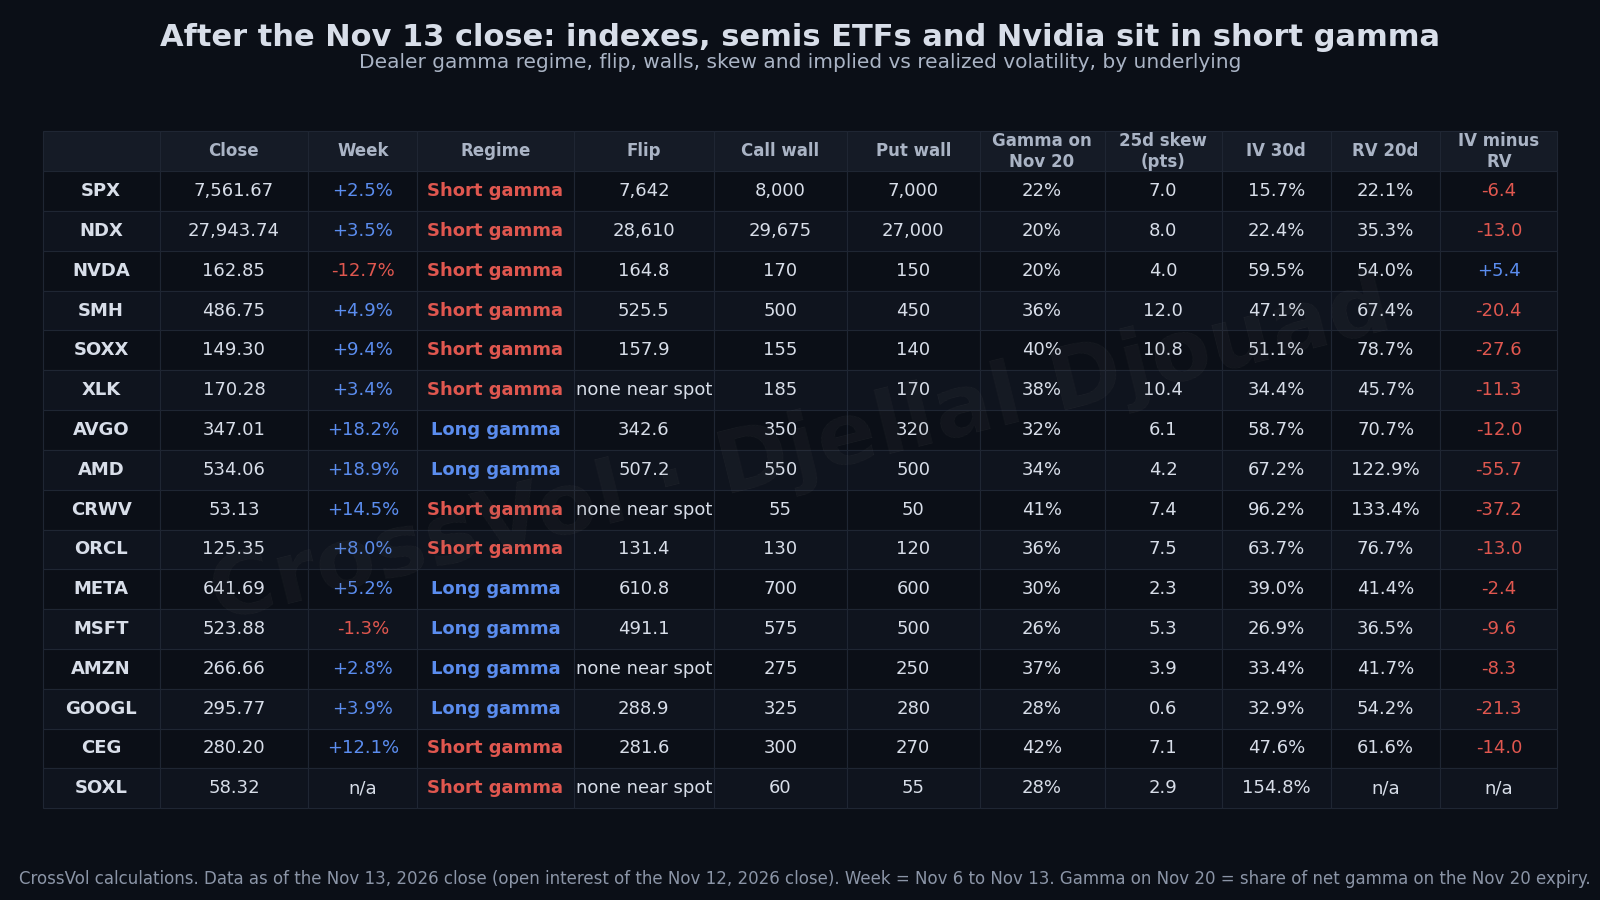
The November 20 monthly options carry 22% of the net gamma, so part of the short gamma rolls off on Friday. The Nasdaq 100 is in the same regime: 27,943.74 against a flip at 28,610, and 28,296 for next week's expiries. At-the-money implied volatility, 15.7% at 30 days for the S&P 500, sits below the 22.1% realized over 20 days, a window that still includes November 5.
Nvidia on Tuesday: what the options price
Nvidia reports on Tuesday, November 17, after the close, under an interim chief executive. It is the first test of the risk I described on Tuesday in AI Capex Cut: How a 20% Cut Could Tip the US Into Recession in 2027: any sign that next year's AI budgets are being trimmed would hit chip earnings first. On Friday, the November 20 straddle, a call and a put at the money, cost $15.70, 9.6% of the share price. The report day alone is priced at about 8.4% on our measure and 7.8% on Bloomberg's. Over its last eight reports, Nvidia moved 4.0% on average the next day, and only twice by more than 7.8%: -8.48% in February 2025 and +8.74% in August 2026. The options price twice the usual move, with an almost flat skew on the November 20 expiry: the size of the move, not its direction. On Bloomberg, Nvidia's implied volatility, at 60.2%, sits close to its one-year high, while the stock sits at its one-year low.
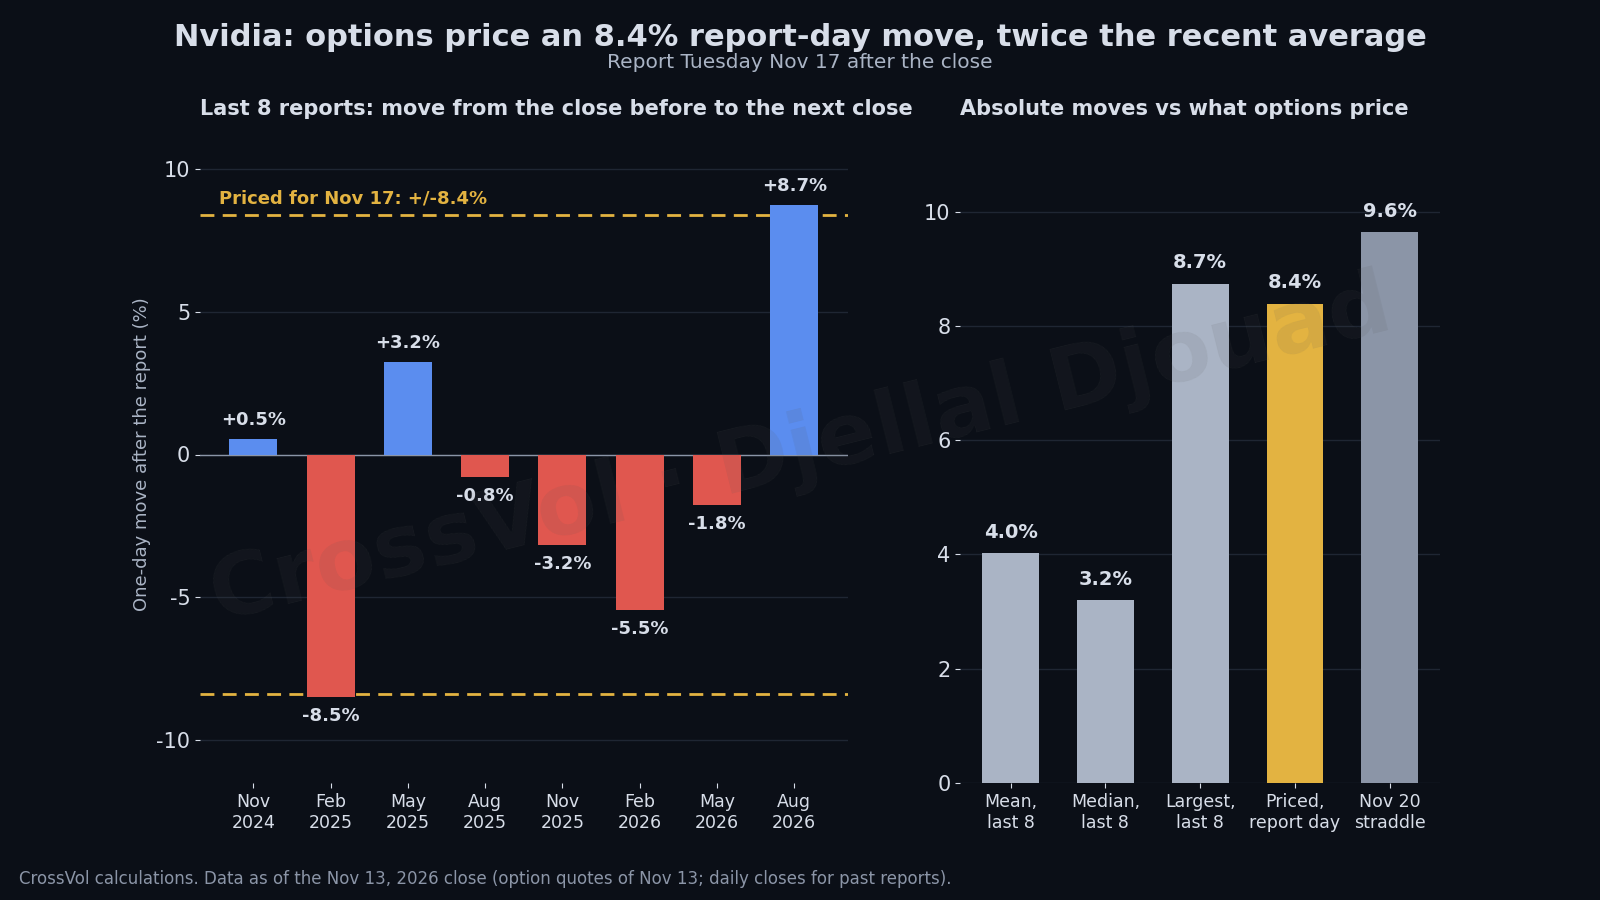
Nvidia weighs 6.14% of the S&P 500, 6.53% of the Nasdaq 100, 12.6% of the XLK technology ETF and 17.1% of the SMH semiconductor ETF. An 8.4% move in the stock moves the S&P 500 by about 0.5% on its own, roughly 39 points: not enough to cross the flip, but short-gamma dealers would add to it. The stock itself sits just below its own flip, at $165, between large put open interest at $150 and calls at $170.
Chips, cloud giants and neoclouds
The credit split shows up in options. The chip ETFs, Oracle and CoreWeave sit in short gamma, SMH 7.4% below its flip, SOXX 5.4% and Oracle 4.6%. Meta, Microsoft, Alphabet and Amazon sit in long gamma, and so do Broadcom and AMD after weekly gains of 18% and 19%; long gamma only cushions moves around the big strikes, it does not stop a shock. On the chips, implied volatility is far below realized volatility, 47.1% against 67.4% for SMH: options price calmer days than the past month.
The VIX on Wednesday, the monthly expiry on Friday
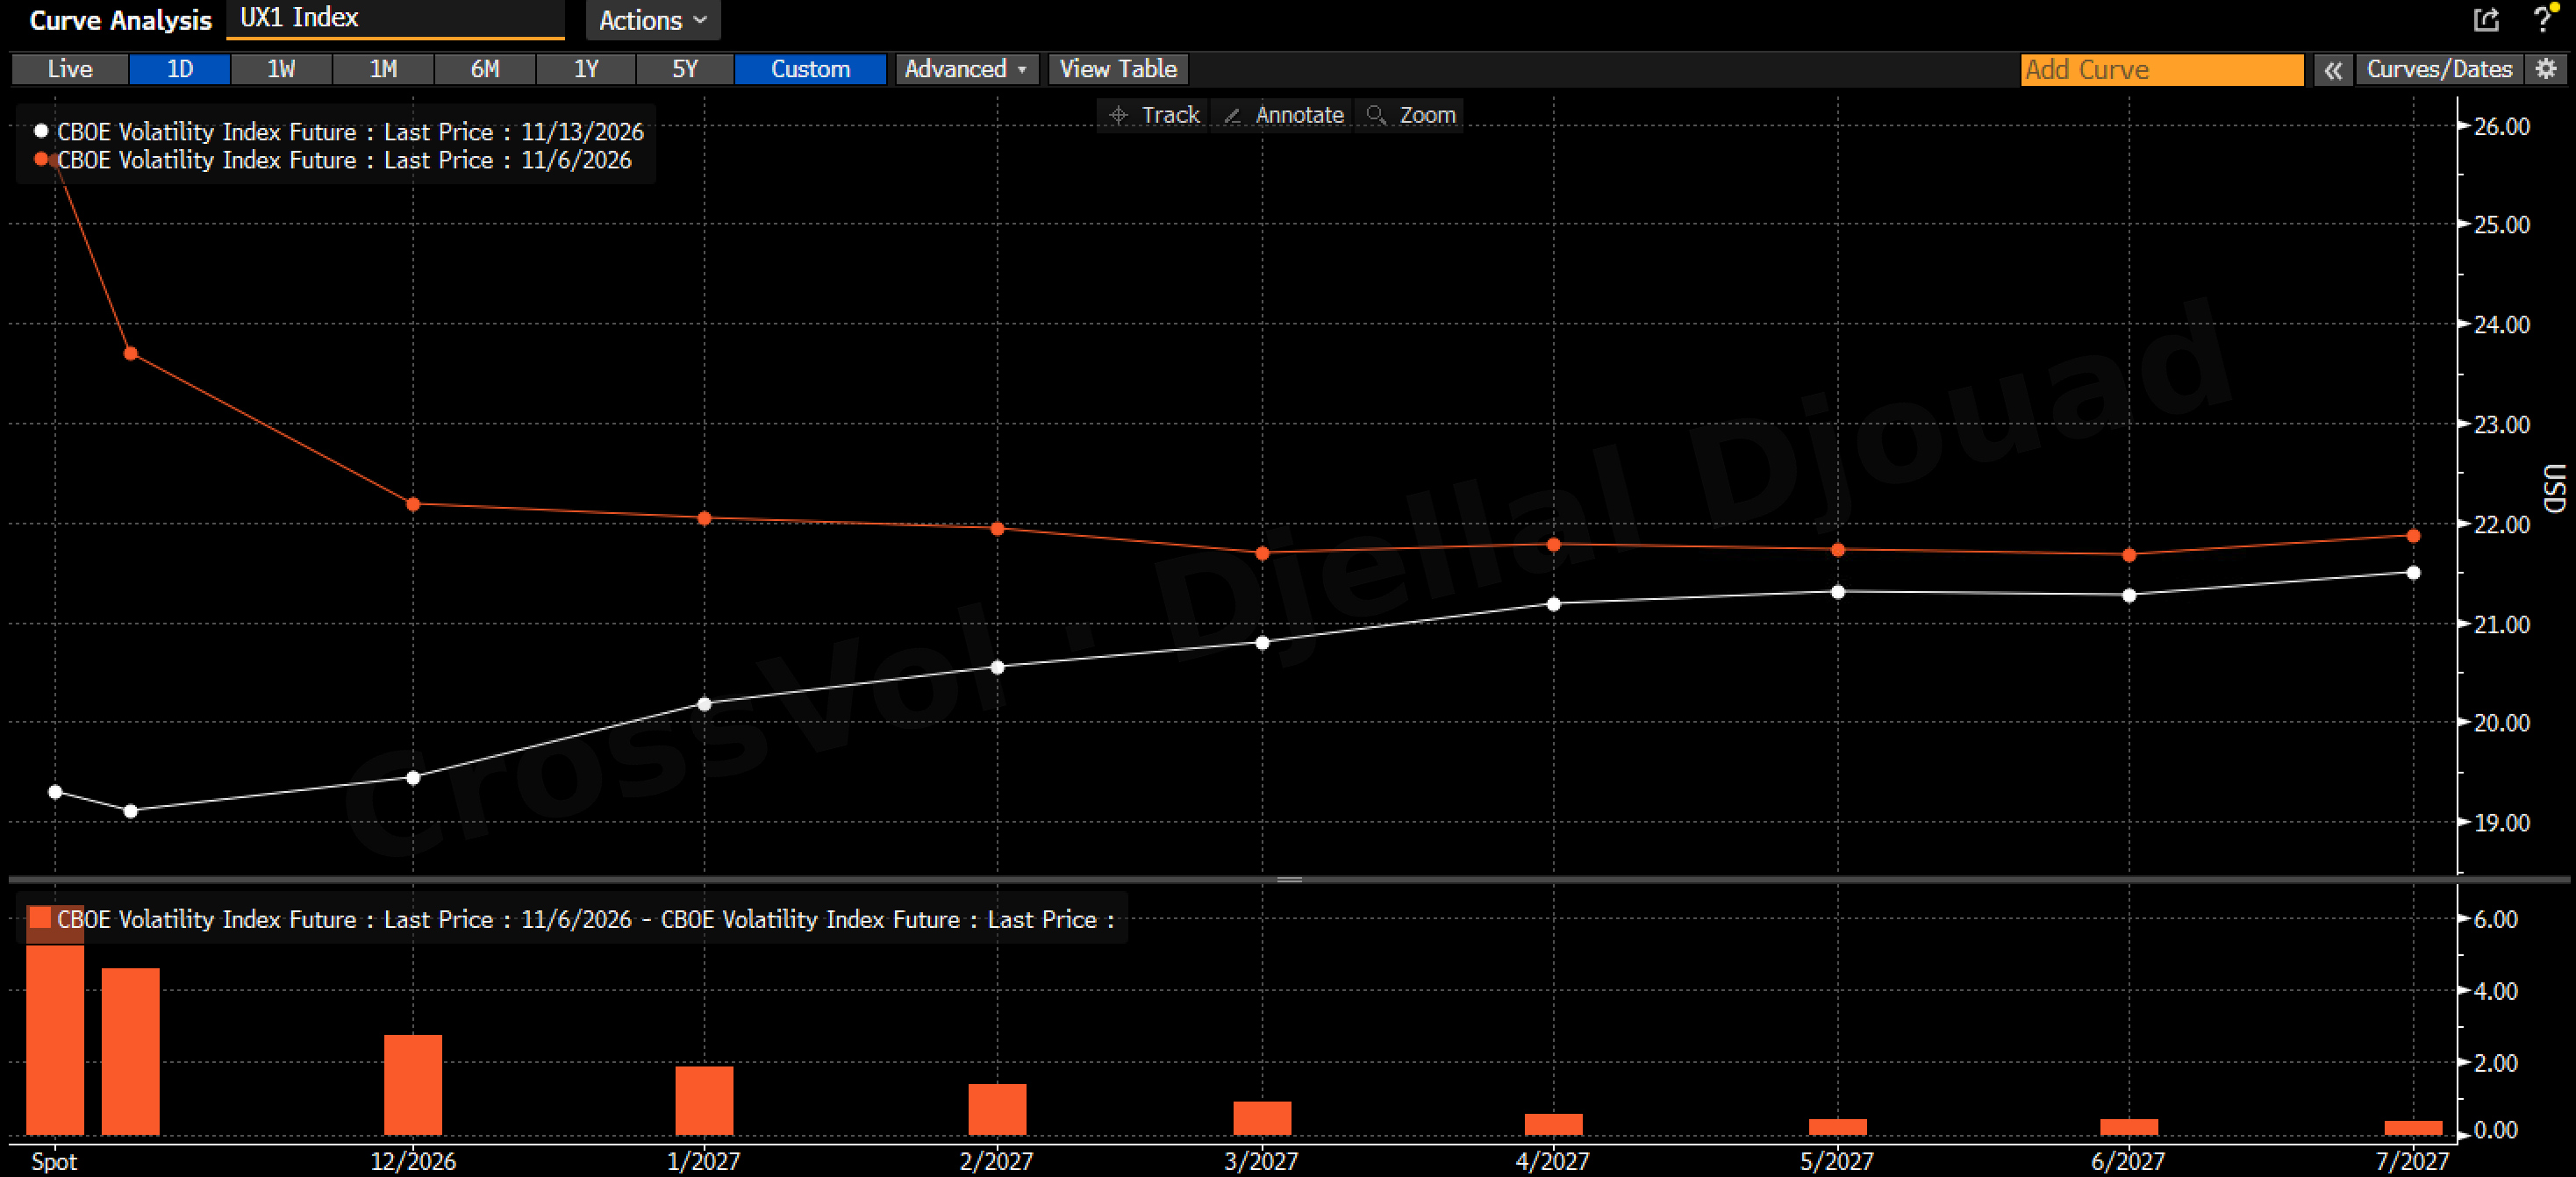
On November 6, the November VIX future traded at 23.69, above the February one at 21.94: an inverted curve. On Friday, November was at 19.11 and February at 20.56. In October, in The VIX Woke Up Loaded the Other Way, I flagged VIX calls piling up while S&P 500 dealers were short gamma; the VIX then spiked on November 5, and the dealers are still short gamma. The November VIX options settle on Wednesday morning, with twice as much open interest in calls, 4.4 million contracts, as in puts, the calls clustered between 20 and 30. On Friday, the monthly equity options expire, and the gamma map restarts from December.
What could go wrong next week, and what could start a Santa rally?
What could go wrong:
Nvidia on Tuesday. About 8% is priced, with the S&P 500 below its gamma flip. A sharp drop would be amplified by dealers, leveraged ETFs and trend followers, who would sell again on a renewed drop.
Funding. Bill settlements this week, then the Treasury's cash build toward $1.025 trillion in late November. Watch SOFR against 3.90%, and its 99th percentile against 4.00%.
The Fed. The minutes on Wednesday afternoon: any serious talk of a half point pushes December pricing further above 100%.
Credit. The Caa spread near its high, and CoreWeave's loan talks.
Japan. A December 18 hike priced at 84.1%, with the dollar near 160 yen.
What could start a Santa rally:
Buybacks. With 91% of the S&P 500 past its results, most companies can buy back their shares again, a steady bid for the coming weeks.
A clean Nvidia report, then a broad fall in implied volatility. On Friday's positions, a vol crush would again turn into dealer buying: the same vanna loop as on November 9.
Trend followers. From a small long, they would add on a further rise.
Volatility-target funds. As the November turbulence fades from their measures, they can add back exposure, a support that builds into December.
December liquidity. The Treasury's cash falling to $850 billion by the end of the year.
Most of the second list lands in December.
My bet: no Santa rally before the Fed
Strictly speaking, the Santa rally covers the last five sessions of December and the first two of January. Before it come Nvidia, the funding squeeze of late November, the jobs report of December 4 and the Fed on December 9, the day before the November CPI. This week's data support my reading, with nuances: Monday was a mechanical rebound, driven by the vol crush and short-gamma hedging, and it has not followed through. My bet stands: we can't expect a Santa rally before the December 9 Fed meeting, and if the Fed is still hawkish there, we will not get a Fed put to support the market.
What would change my mind: a clean Nvidia report followed by a broad fall in implied volatility, SOFR staying under 3.90% through the November month end, and the Caa spread back below 1,000 bp.
FAQ
Will there be a Santa rally in 2026? Seasonality favors late December, but this year the December 9 Fed meeting, priced for a hike, comes first. I don't expect one to start before that meeting.
What is a vanna rally? A rally fed by dealers buying back the hedges of the options they sold, as implied volatility falls and those options lose delta. On November 9, the vol crush and short-gamma hedging fed each other in a mechanical loop.
When does Nvidia report earnings? On Tuesday, November 17, 2026, after the market close: results around 4:20 p.m. New York time, conference call at 5 p.m.
This article is for educational purposes only. It is not investment advice and not a recommendation to buy or sell anything. Options and futures carry a high risk of loss, and leveraged products can lose more than the amount invested. Figures are Friday November 13, 2026 closes unless stated otherwise; funding data are the latest official ones, of November 12.
Further reading
The Volatility Risk Premium Explained: Why Implied Beats Realized
Risk Reversal Skew Explained: Reading Put vs Call Implied Vol
How to Trade Earnings With Options: My Nebius (NBIS) Earnings Trade, Step by Step
How to cite: Djellal Djouad, CrossVol Research, "Stock Market Next Week: No Santa Rally Before the Fed", 14 November 2026. https://newsletter.crossvolresearch.com/p/stock-market-next-week-santa-rally-fed-nvidia