


By Djellal Djouad. November 6, 2026.
A CrossVol analysis by Djellal Djouad, built on the CrossVol terminal, our own options, positioning and market history data, and public filings.
This article is for educational purposes only. It is not investment advice and not a recommendation to buy or sell anything. Options and futures carry a high risk of loss, and leveraged products can lose more than the amount invested. Prices are closing prices of Friday, November 6, unless stated otherwise. Option surface figures marked "Friday midday" were taken around noon New York.
On Thursday the Nasdaq 100 fell 6.36%, its worst session since March 2020. About $2.3 trillion of market value disappeared in one day, the largest loss in dollars on record. Semiconductors lost 12.3%. On Friday the index rose 2.6% in the first twenty minutes, fell back to its low of the day when Bloomberg reported, early in the New York afternoon, that Microsoft is winding down an arrangement to rent AI computing capacity from Oracle, and closed up 1.35% at 26,990, with half of its morning gain gone.
Thursday's crash and Friday's dead cat bounce are the setup. What happens next is the bomb. Over the next two weeks, the whole chain that rents out AI computing power reports, one link after the other. The client, Microsoft, has just walked away from capacity it rented at Oracle. The landlords, Oracle, CoreWeave and Nebius, borrowed to build data centers: CoreWeave reports on Tuesday, Nebius on Thursday. The supplier, Nvidia, worth about $4.5 trillion, reports on November 17, three days before the monthly options expiry. And the market walks into it after selling its hedges on Wednesday, buying them back in a panic on Thursday, and bouncing on Friday mostly because volatility fell.
My reading: Friday's bounce is a dead cat bounce, the next two weeks carry the real danger, and next week could turn black. I tested that view against the options market, the positions reported to the US futures regulator, leveraged ETFs, dealer hedging, trend followers, our terminal and forty years of Nasdaq 100 history. The data agree with the first two parts. On the black week they are more careful than I am, and I will show you why.
In short:
The bomb is the calendar. CoreWeave on Tuesday, Nebius on Thursday and Nvidia on November 17 report within days of Microsoft letting rented Oracle capacity go. Options price moves of about 21%, 19% and 11% by the expiry that follows each report. For Nvidia, that is about $500 billion of market value, up or down, three days before the November 20 expiry.
The bounce has the profile of a dead cat bounce. It was narrow and mechanical: it came from dealer hedges unwinding as volatility fell, not from a wave of buyers.
The market sold its hedges on Wednesday and bought them back on Thursday. The one-month QQQ skew went from 5.2 points, the 28th percentile of the past year, to 12.4, the 99th. Cboe counted 11.2 million puts traded on Thursday, against 7.7 million on Wednesday.
The crash tail stayed expensive. On the bounce, investors sold back ordinary protection but kept their crash insurance near the highest price of the past year.
Hedge funds were caught long. Leveraged funds went from their largest short in Nasdaq 100 futures in five years, in August, to a net long in late October, still in place on November 3, two days before the crash.
Leveraged ETFs are forced sellers. On Thursday they had to sell about $40 billion into the close, more than half of it in chip funds. A 6% fall next week would force about $32 billion more.
Below 26,600, then 26,000, there is a trap door. Dealers reach their shortest gamma, leveraged ETFs and volatility-targeting funds sell by construction, trend followers are already short on two horizons out of three, and the Fed is not coming to the rescue.
A black week, down 5% or more, is not the central case. Options price it at about 14%, history at about one in four after a bounce like Friday's, and only inside crises already underway. It is a tail that options price below its historical frequency, and the next two weeks give it a fuse.
The week in five lines
Monday to Wednesday, rotation then relief. The market read Tuesday's Democratic sweep of the midterms as gridlock. On Wednesday the S&P 500 gained 1.58% and Microsoft 6.7%.
Thursday, the crash. Nasdaq 100 down 6.36%, S&P 500 down 4.36% with 426 members down and 72 up, semiconductors down 12.3%.
Friday, a bounce that faded. Up 2.6% in the first twenty minutes, down to the low of the day on the Microsoft and Oracle headline, up 1.35% at the close. On the week the Nasdaq 100 lost 4.9% and the S&P 500 2.7%.
Volatility woke up. The Nasdaq volatility index posted its biggest one-day jump since at least April 2020, and the VIX curve inverted.
AI credit names kept falling. Oracle lost 11.2% on the week and CoreWeave 15.4%.
What happens next? The AI bomb of the next two weeks
On Thursday, less than half an hour after the open of what became the worst Nasdaq 100 session since March 2020, I published The AI Depreciation Bomb. Its argument was that the accounts assume GPUs keep their value far longer than they do, and that data center loans "look comfortable until the first contract renewal at a lower price." One day later, the most creditworthy tenant of the AI build-out passed on a renewal at Oracle. Over the next two weeks, the rest of the chain faces the same question in public, in New York time:
Tuesday, November 10. October CPI at 8:30 am. After the close, CoreWeave reports its third quarter, with a call at 5 pm. Microsoft was CoreWeave's largest customer, 62% of its 2024 revenue according to its IPO prospectus: this is the first public test of how Microsoft treats the capacity it rents. Options expiring on Friday, November 13 price a move of about 21% either way.
Thursday, November 12. Nebius reports before the open. In September 2025 it signed a contract to supply Microsoft with GPU capacity through 2031, worth $17.4 billion and up to $19.4 billion. Its options price about 19% by Friday. After the close come Cisco and Applied Materials, which sell the networks and the chipmaking tools of the build-out: about 10% and 11%. The 30-year Treasury auction falls in between, at 1 pm.
Tuesday, November 17. Nvidia reports after the close. Options expiring on Friday, November 20 price a move of about 11% either way. On a market value of about $4.5 trillion, that is about $500 billion, up or down, on one stock.
Wednesday, November 18. VIX options and futures expire.
Friday, November 20. The monthly options expiry, three days after Nvidia. Dealers will have to rebuild a large part of their hedges in the same week as the most important report of the quarter.
Why call it a bomb rather than a calendar? Three reasons.
The chain runs on debt. The landlords borrow to buy the chips and build the halls, and lenders, as I wrote on Thursday, "lend mainly against the rental contracts," so that "the real collateral is then the tenant's promise to keep paying." A tenant that does not renew is that collateral leaving the building. The credit market had started to price it before Friday: the cost of insuring Oracle's debt for five years went from about 84 basis points a year ago to 304 on November 5, and CoreWeave's nearly tripled since June, from 452 to 1,289 on November 5, its highest of the past year. CoreWeave's results will be read for the renewal terms of its contracts, Nebius's for the pace of its Microsoft contract, and Nvidia's for whether the landlords keep ordering.
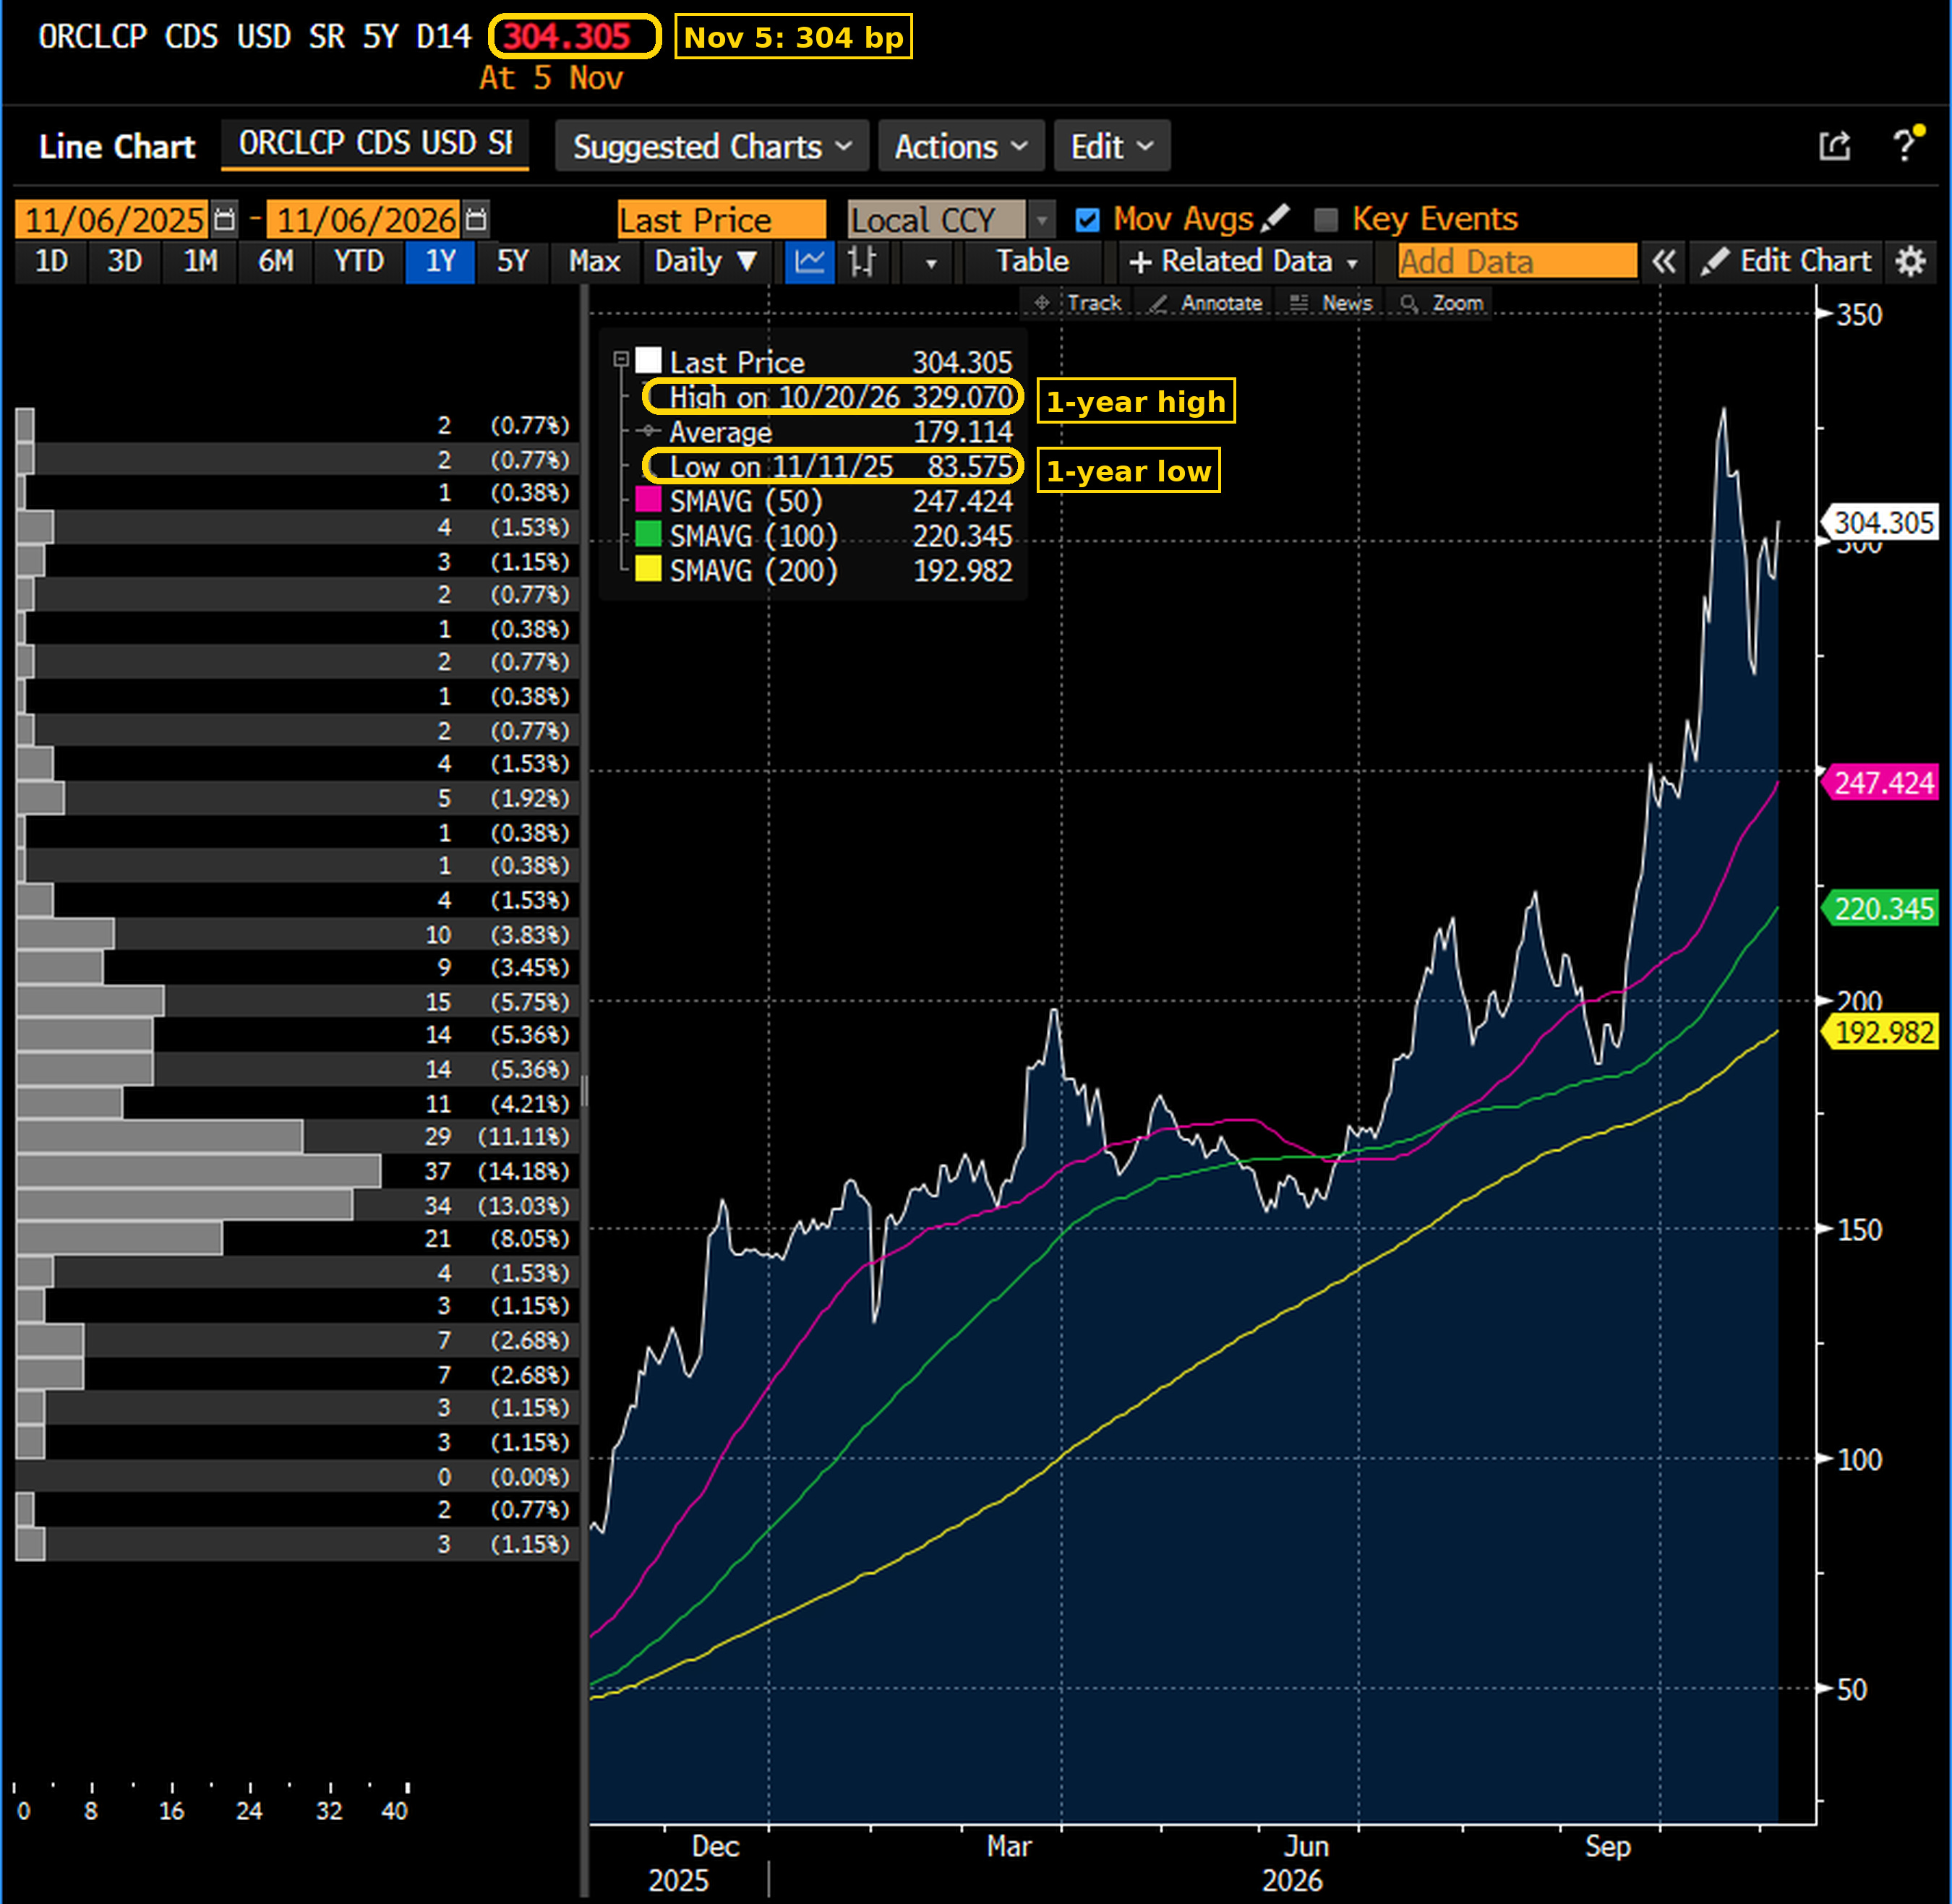
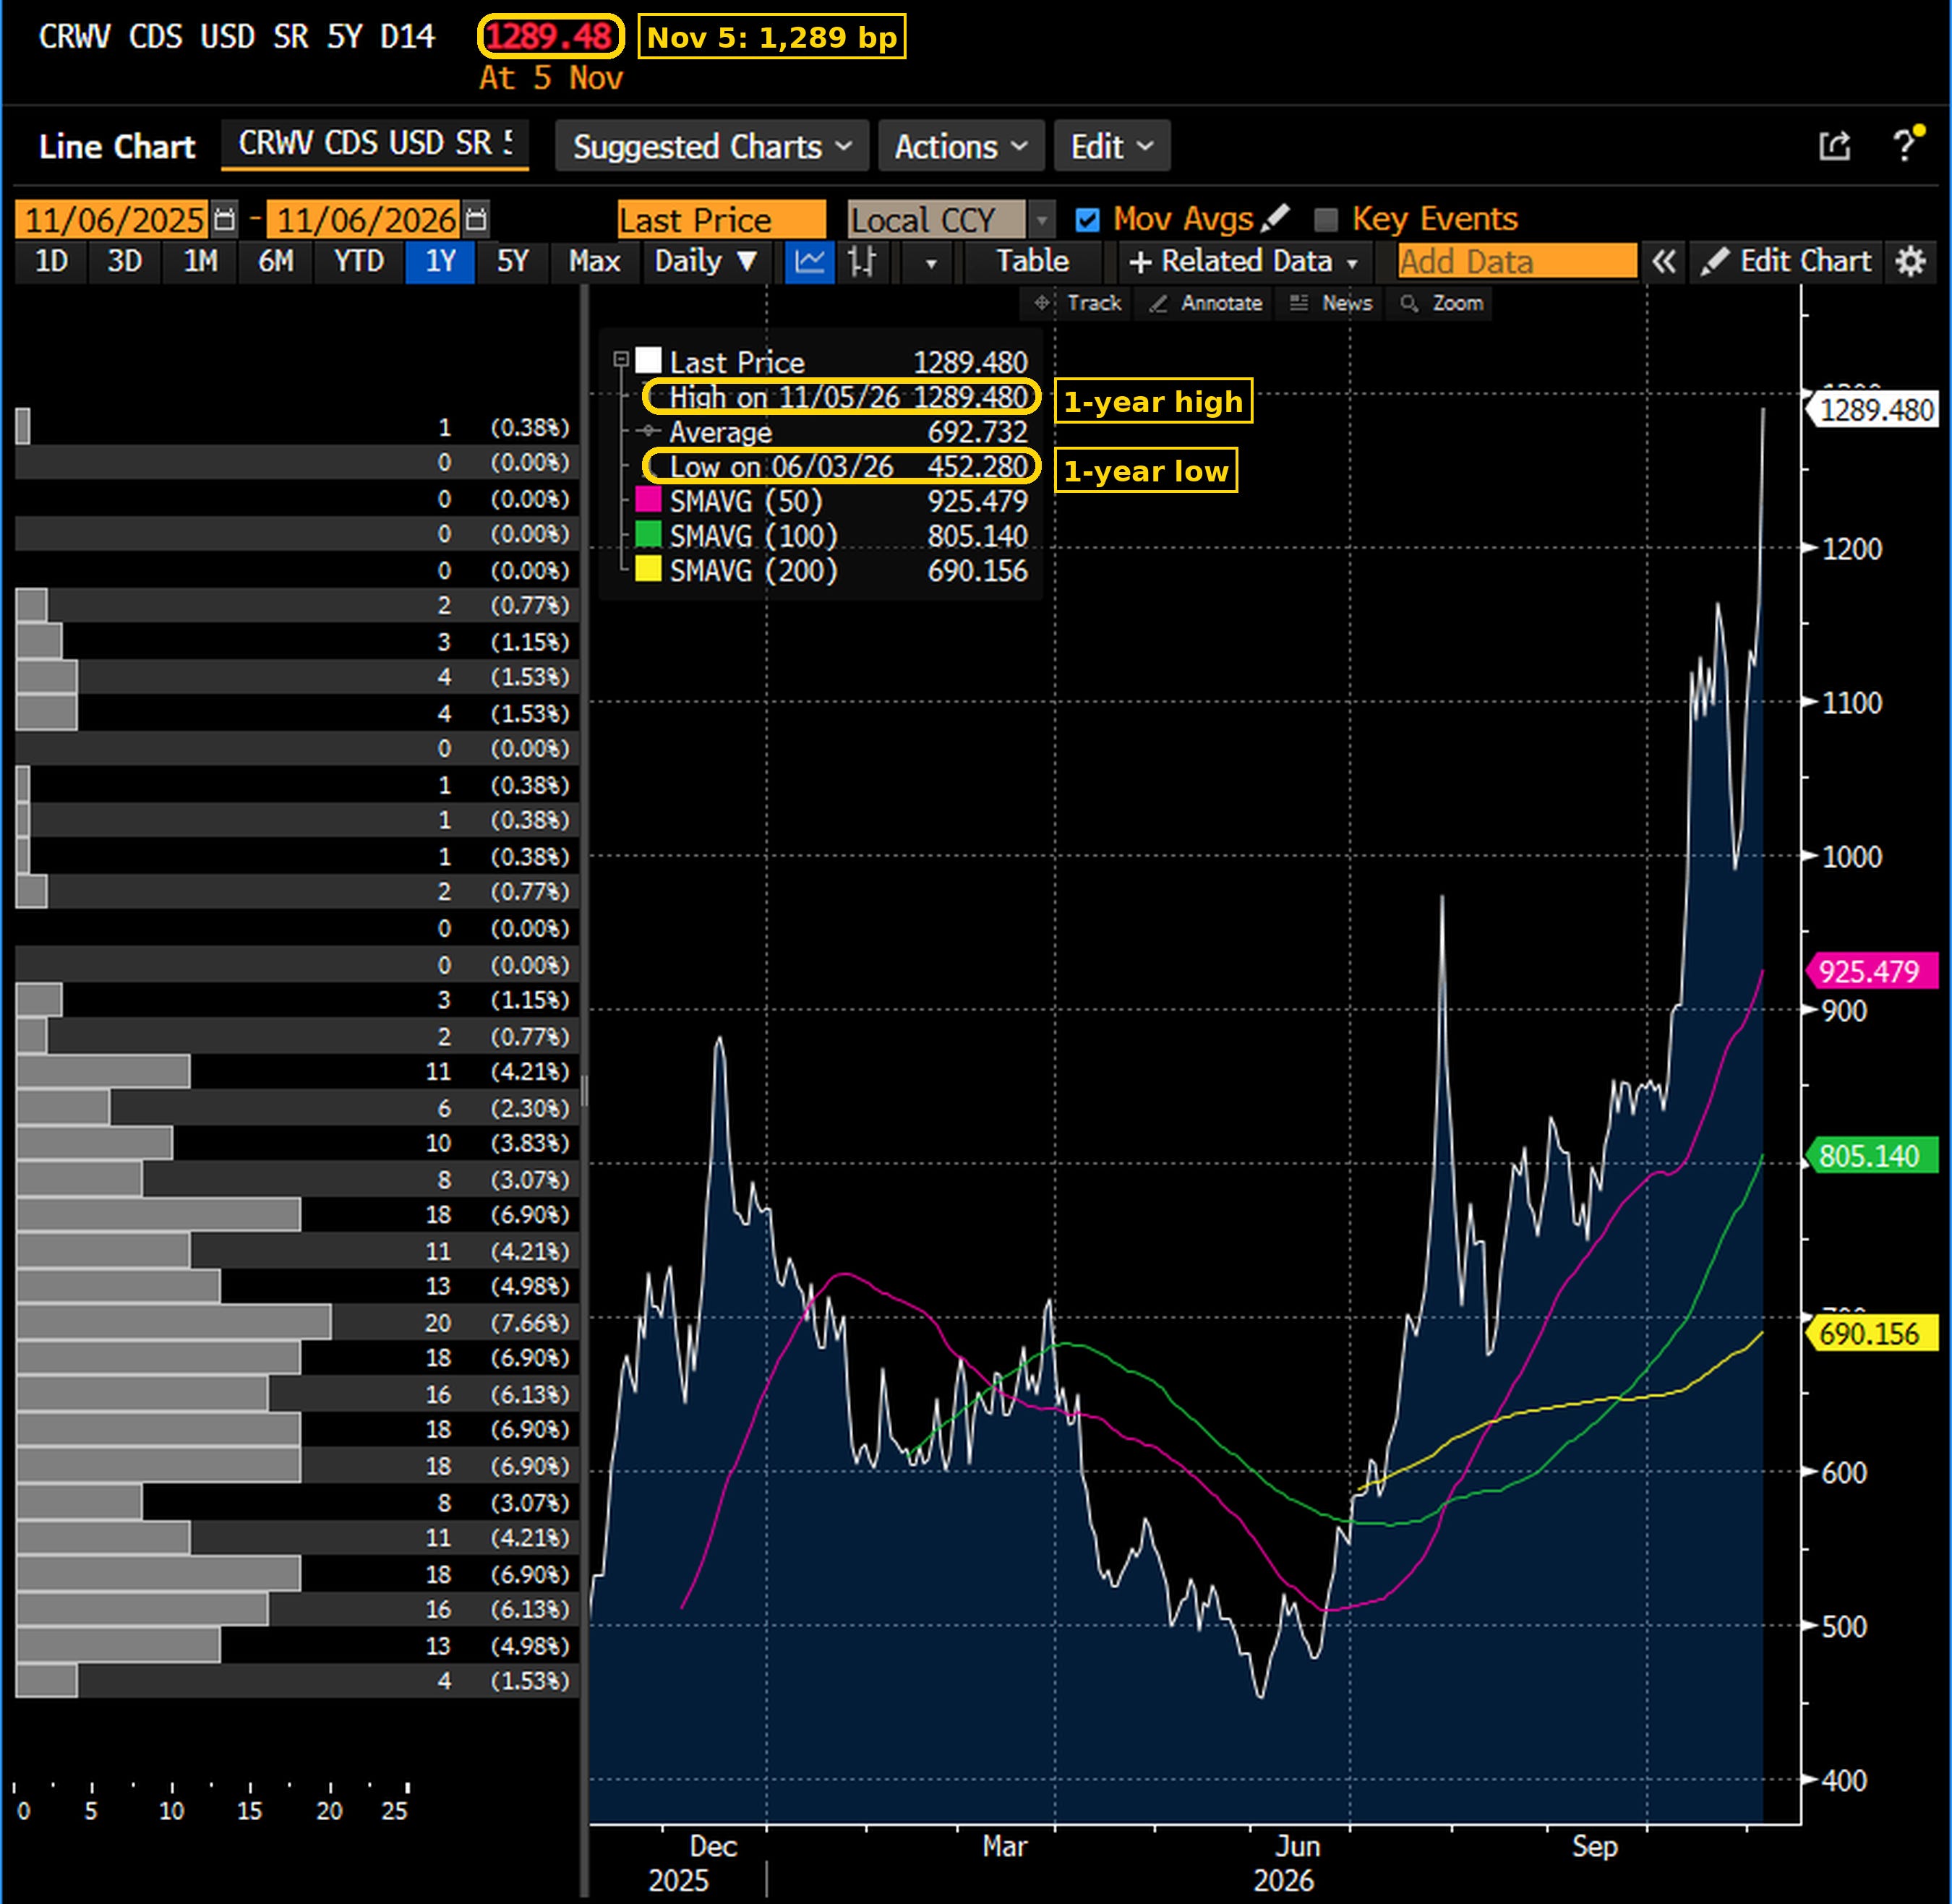
The market is not hedged for it. On Wednesday investors sold their hedges into the relief rally. On Thursday they bought them back at any price. On Friday they sold the ordinary protection again and kept only the crash wing, and the bounce itself came from dealer hedges unwinding as volatility fell, as I show below. That is the usual rhythm after a panic: the newly hedged sell into the bounce, then sell their puts once they feel safe, just before the next leg. A bounce built on falling volatility leaves the market less protected by the time the reports arrive, and the first disappointment pushes volatility back up, which turns Friday's mechanical support into selling.
The Fed is not coming to the rescue. In 1987, 1998 and 2020 the Fed stepped in after the panic. This time Friday's strong October jobs report left futures markets pricing a December 9 hike at more than 75%. A hot CPI on Tuesday morning, hours before CoreWeave reports, would make it worse.
Each of these moves is priced on its own. What options do not price is the chain: a disappointment at the first link raises volatility for the whole index just before the next link reports.
Was Thursday a stock market crash?
For the Nasdaq 100, yes. A fall of 6.36% in one session is a one-day crash by any usual measure. Since October 1985 the index had fallen 5% or more in a day 69 times, and only 30 of those falls were larger than Thursday's. All 30 came during known crises: 1987, the Asian and Russian crises of 1997 and 1998, the dot-com bubble and bust, 2008 and March 2020.
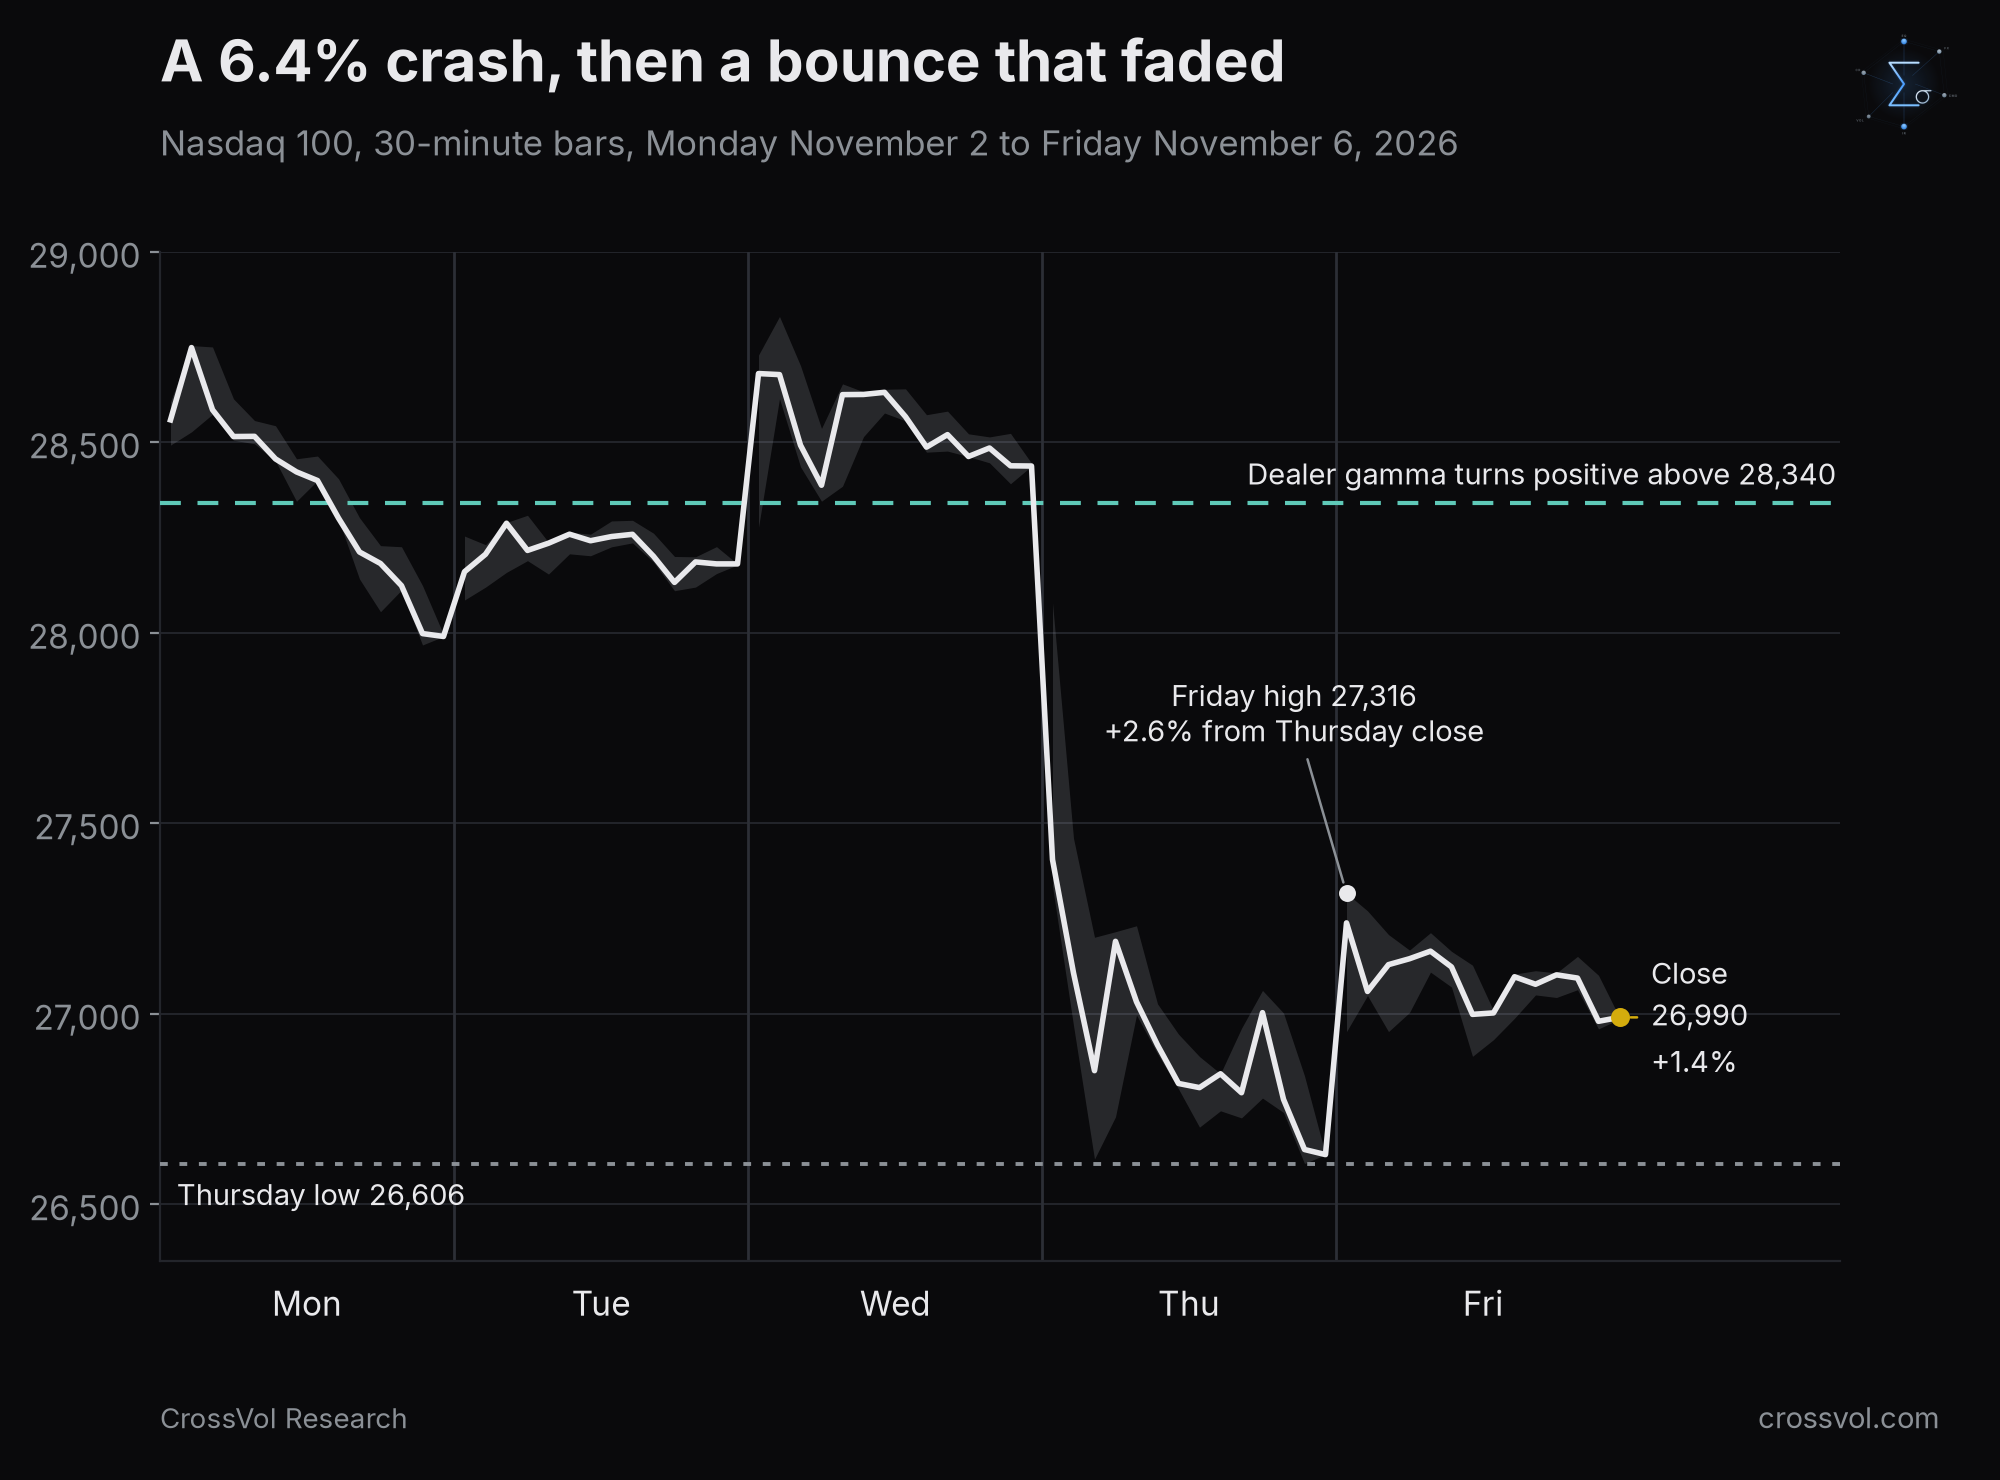
The week started as a rotation. On Monday the Nasdaq 100 lost 1.4% while the equal-weight S&P 500, where every stock counts the same, rose. On October 29, in The Megacaps Did Not Outrun the Fed, I wrote that "so far the market has rotated rather than broken." That still held on Wednesday.
On Thursday the same election result was read the other way. Newly elected Democrats could push local moratoriums on new data centers, and a large share of the US data center pipeline suddenly looked at risk. Then positioning took over: the stocks hedge funds owned most fell, the ones they were short rose, and forced selling fed on itself. The Nasdaq 100 closed at 26,629.81, after a low of 26,606.43. The Philadelphia Semiconductor Index lost 12.3%, its worst day since March 2020. Micron fell 17.5%, AMD 17.3%, Lam Research 16.4%, Broadcom 10.4% and Nvidia 9.3%. The S&P 500 lost 4.36%, its largest fall since April 2025.
On Friday, after a strong October jobs report, the Nasdaq 100 opened higher and reached its high of the day, 27,316, up 2.6%, at 9:50 am. It never got back there. It printed its low of the day, 26,888, at 12:50 pm, minutes after the Microsoft headline, and closed at 26,990, up 1.35%, keeping about half of its morning gain.
Is Friday's bounce a dead cat bounce?
A dead cat bounce is a short rebound inside a decline that does not change its direction. Four things make me think Friday is one.
It faded early and it was narrow. The stocks that had fallen most led the bounce: AMD closed up 11.0%, Lam Research 8.2%, Micron 5.1%, Nvidia 2.8%. Apple and Microsoft closed lower and Broadcom barely moved. A rebound led by the most beaten names, with the largest stocks absent, rarely marks a bottom.
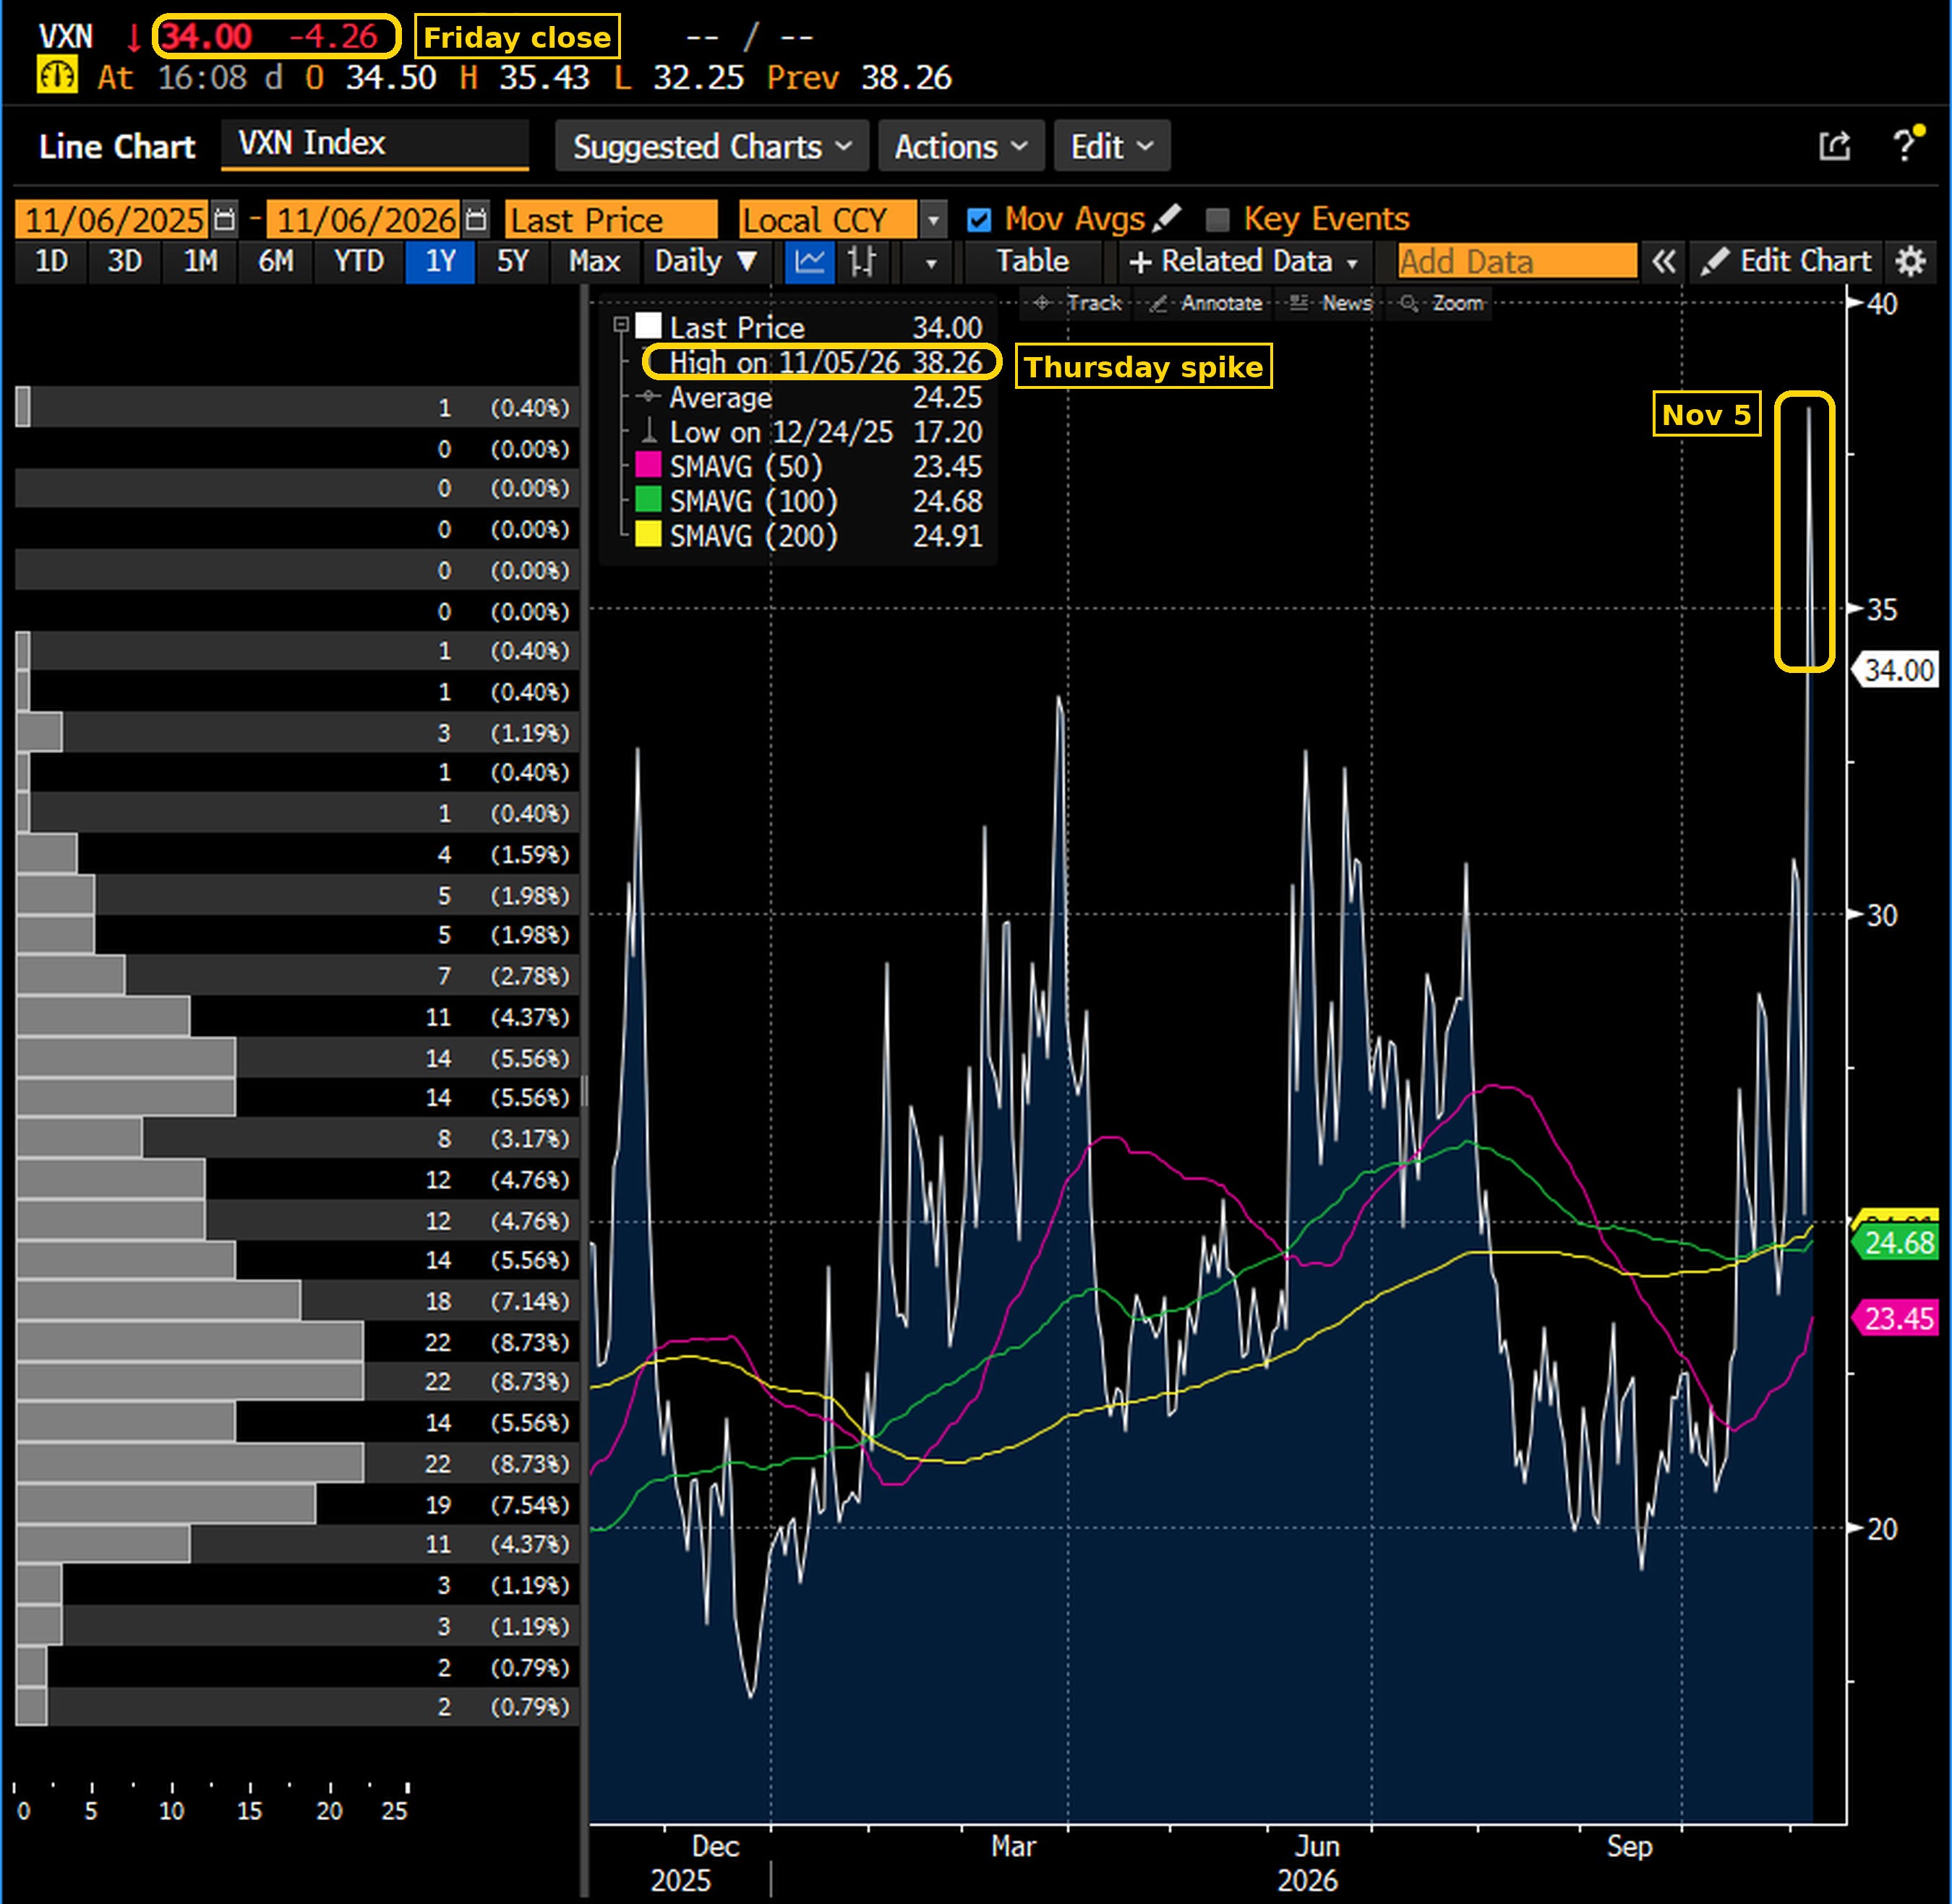
It was mechanical. On Thursday investors bought puts in record numbers, and the dealers who sold them hedged by selling Nasdaq futures. On Friday morning implied volatility fell hard: the VXN, the Nasdaq 100 volatility index, went from 38.26 at Thursday's close to 32.25 at 9:50 am, six points lower. When volatility falls, an out-of-the-money put loses delta, its sensitivity to the index, so the dealers who sold it need fewer futures against it and buy some back. That effect is called vanna. The index peaked at 27,316 in the same five minutes as the volatility low. At 12:50 pm, on the Microsoft headline, the VXN rose to its high of the day, 35.43, and the index printed its low of the day, 26,888, again in the same five minutes. Volatility down, index up. Volatility up, index down. On our terminal, dealer vanna on the Nasdaq 100, QQQ and Nasdaq 100 futures still read as supportive at the close, concentrated around 26,500 on the index, the QQQ 650 strike and 27,500 on the futures. That support lasts as long as volatility keeps falling. It turns into selling when volatility rises, and the next two weeks are a calendar of reasons for it to rise.
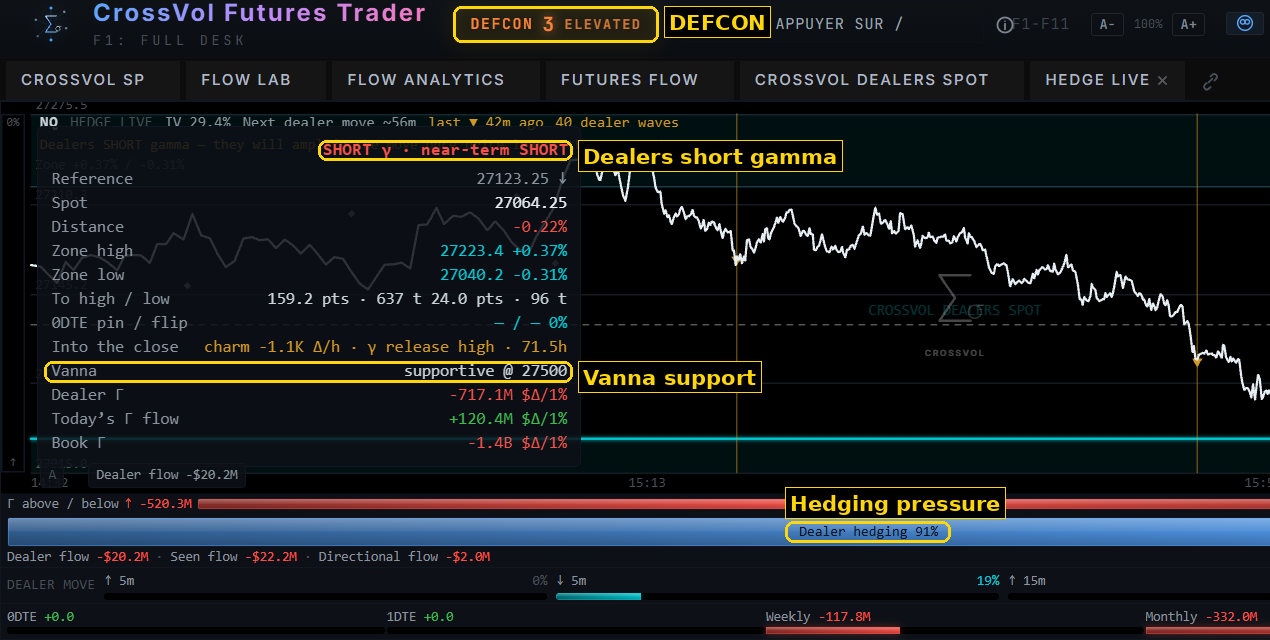
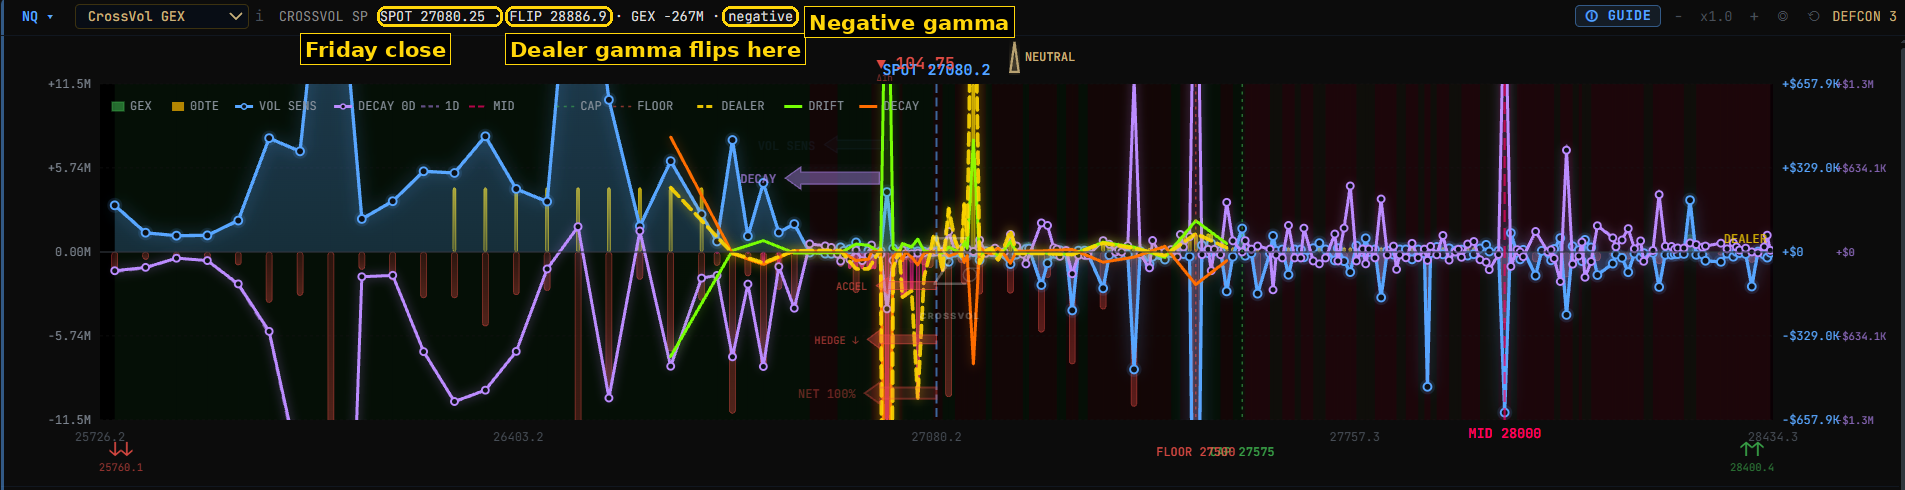
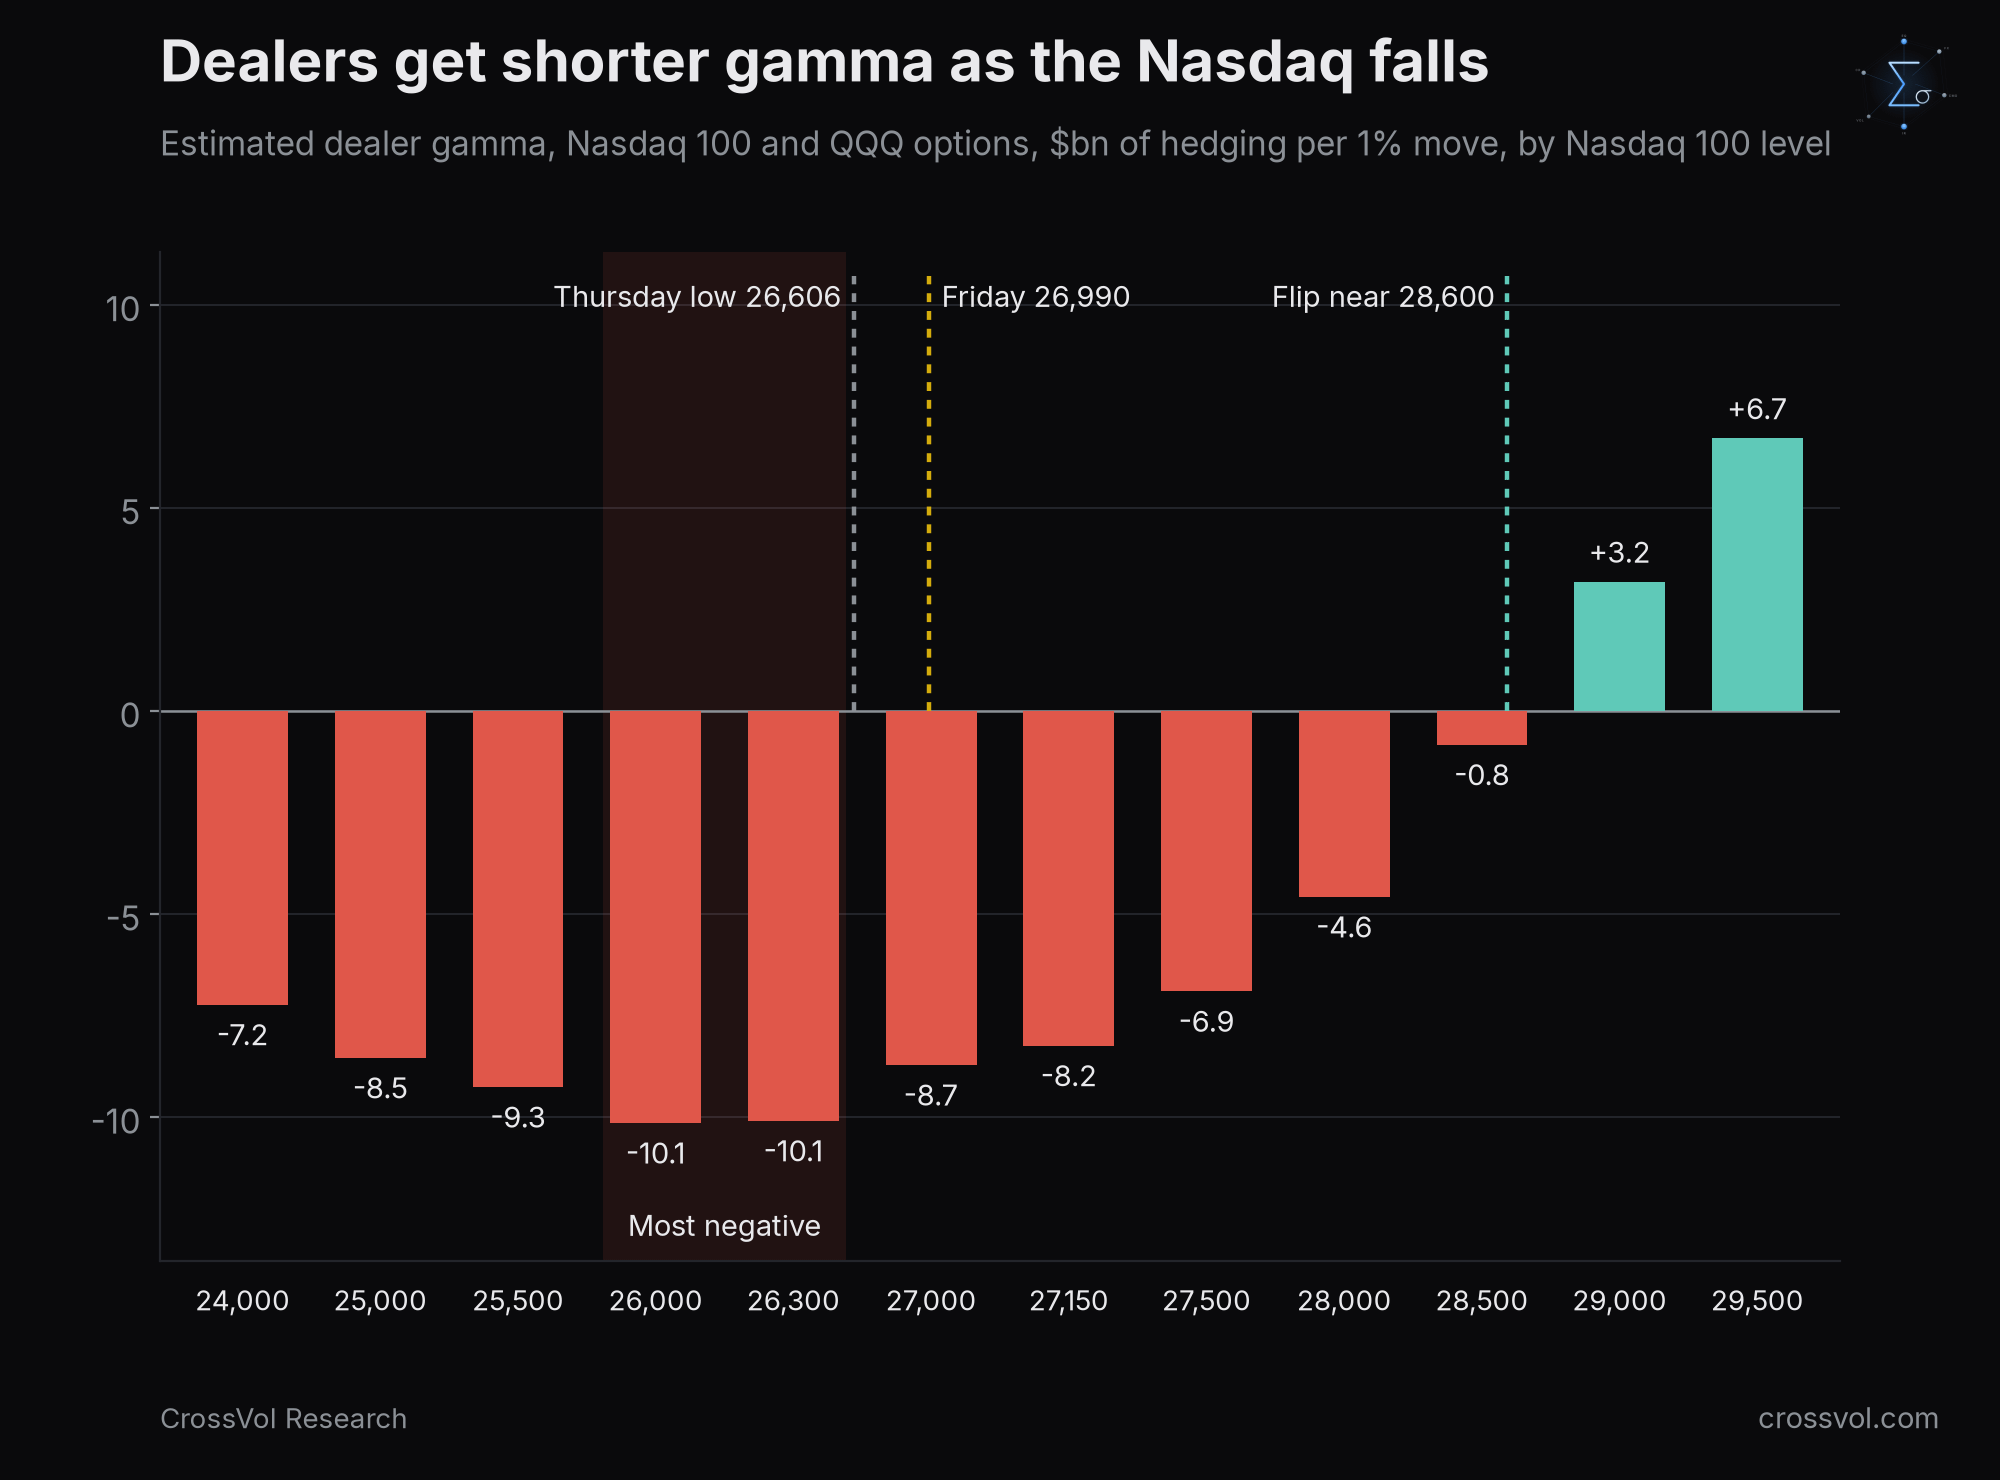
Dealers did not change sides. Dealers are the banks and market makers on the other side of option trades, and they hedge by buying and selling the index. When they are short gamma, their hedging forces them to sell into declines and buy into rallies, which amplifies moves. On our terminal, dealer gamma on the Nasdaq 100 stays negative below 28,340, and on Nasdaq 100 futures below about 28,890. Our own calculation on Thursday night's positions puts the switch near 28,590. Either way, the index closed about 5% below it. On October 16, as I wrote two days later in The VIX Woke Up Loaded the Other Way, it was 4.1% below its switch level. The gap has widened.
Option buyers used the bounce to buy protection. On standard Nasdaq 100 index options, 2.4 puts traded for every call by midday on Friday, led by December puts at 26,000, 24,000 and 27,000. Our own scanners agree: almost all of the setups they flagged on Friday were put spread purchases.
History gives the same answer, as I show below: after a crash like Thursday's, a new closing low came within a week in 68% of all cases, and in 40% after a bounce of at least 1% like Friday's. On Friday's midday prices, the options market gave a probability of about 55% that the index trades back down to Thursday's low before next Friday's close. Our positioning indicators push me above the options: I put the odds of a retest of 26,600 by next Friday at 60% to 65%.
What is volatility saying, from one week to one year?
On October 4, in Volatility Is Starting to Talk Even While the VIX Sleeps, I wrote that the VIX "will be the last to admit it." This week it admitted it. The VIX measures the 30-day volatility of the S&P 500 implied by option prices. The VXN does the same for the Nasdaq 100.
On Thursday the VXN jumped 13.18 points to 38.26, up 52.6%, its largest one-day rise in points and in percent since at least April 2020. The VIX closed at 28.18, up 69.7%. The VIX rose above its three-month equivalent, VIX3M, to a ratio of 1.103, the highest of the past year, and the first VIX future settled 2.34 points above the second. When near-term protection costs more than protection three months out, the curve is inverted. In our review of October 19 to 23, I noted that the volatility curve never inverted during that week's AI selloff. This time it did.
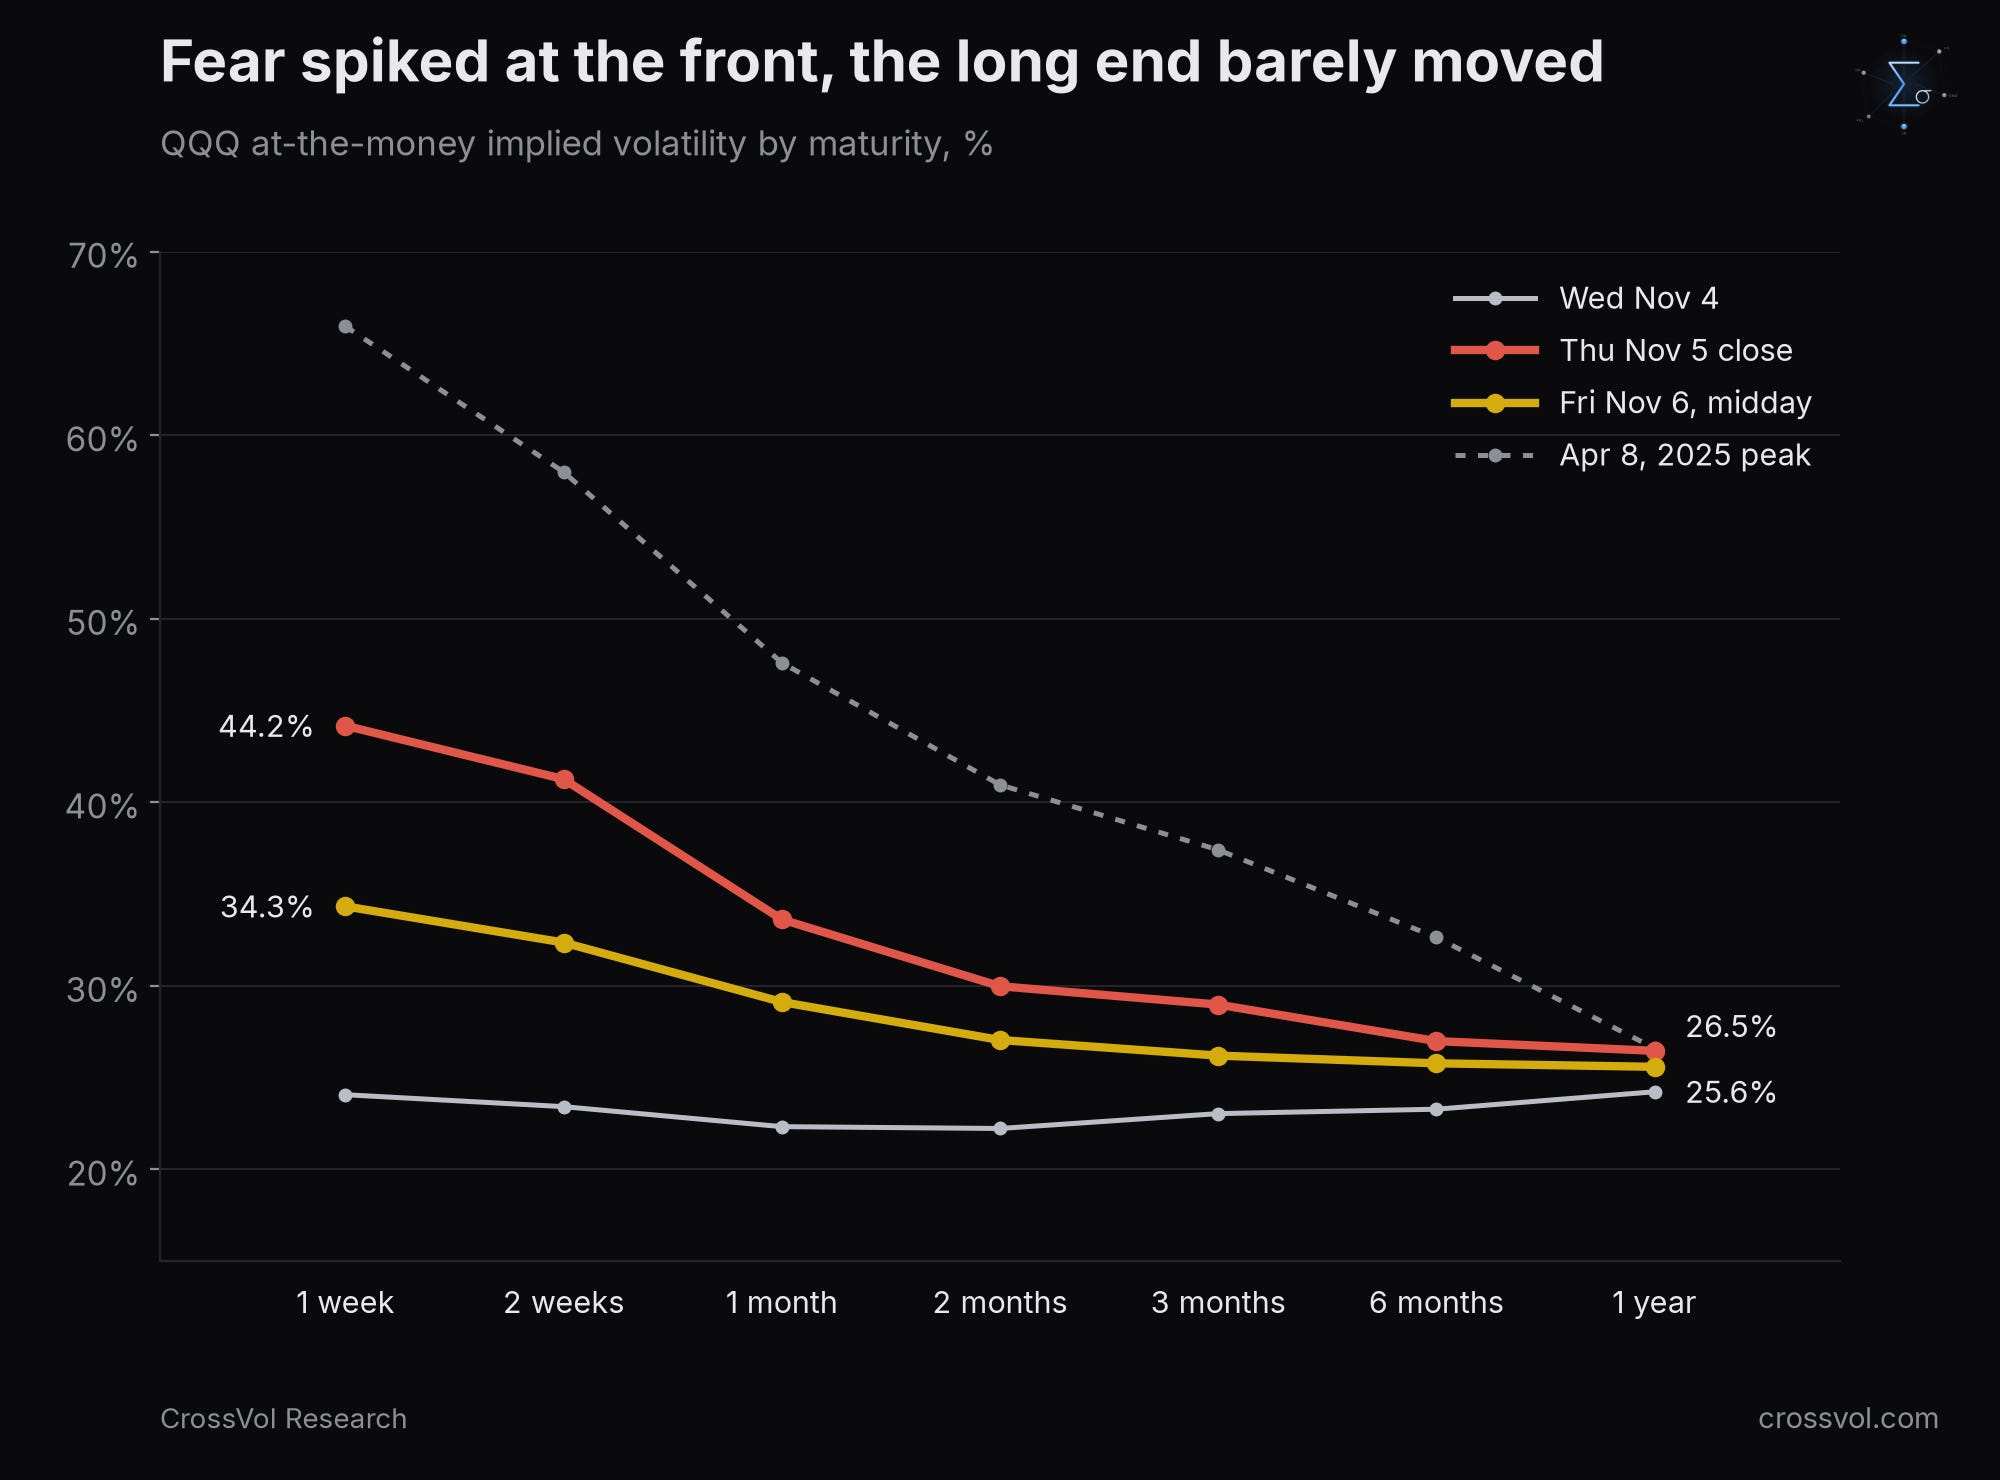
The term structure tells the story by horizon. At-the-money implied volatility on QQQ, the Nasdaq 100 tracker:
One week: 24.1% on Wednesday, 44.2% at Thursday's close, 34.3% at Friday midday.
One month: 22.3%, then 33.6%, the highest of the past year, then 29.1%, still in the 97th percentile of the year.
One year: 24.2%, then 26.5%, then 25.6%.
The gap between one week and three months: +1.0 point on Wednesday, +15.2 on Thursday, +8.1 on Friday. At the peak of the April 2025 tariff shock it was +28.5.
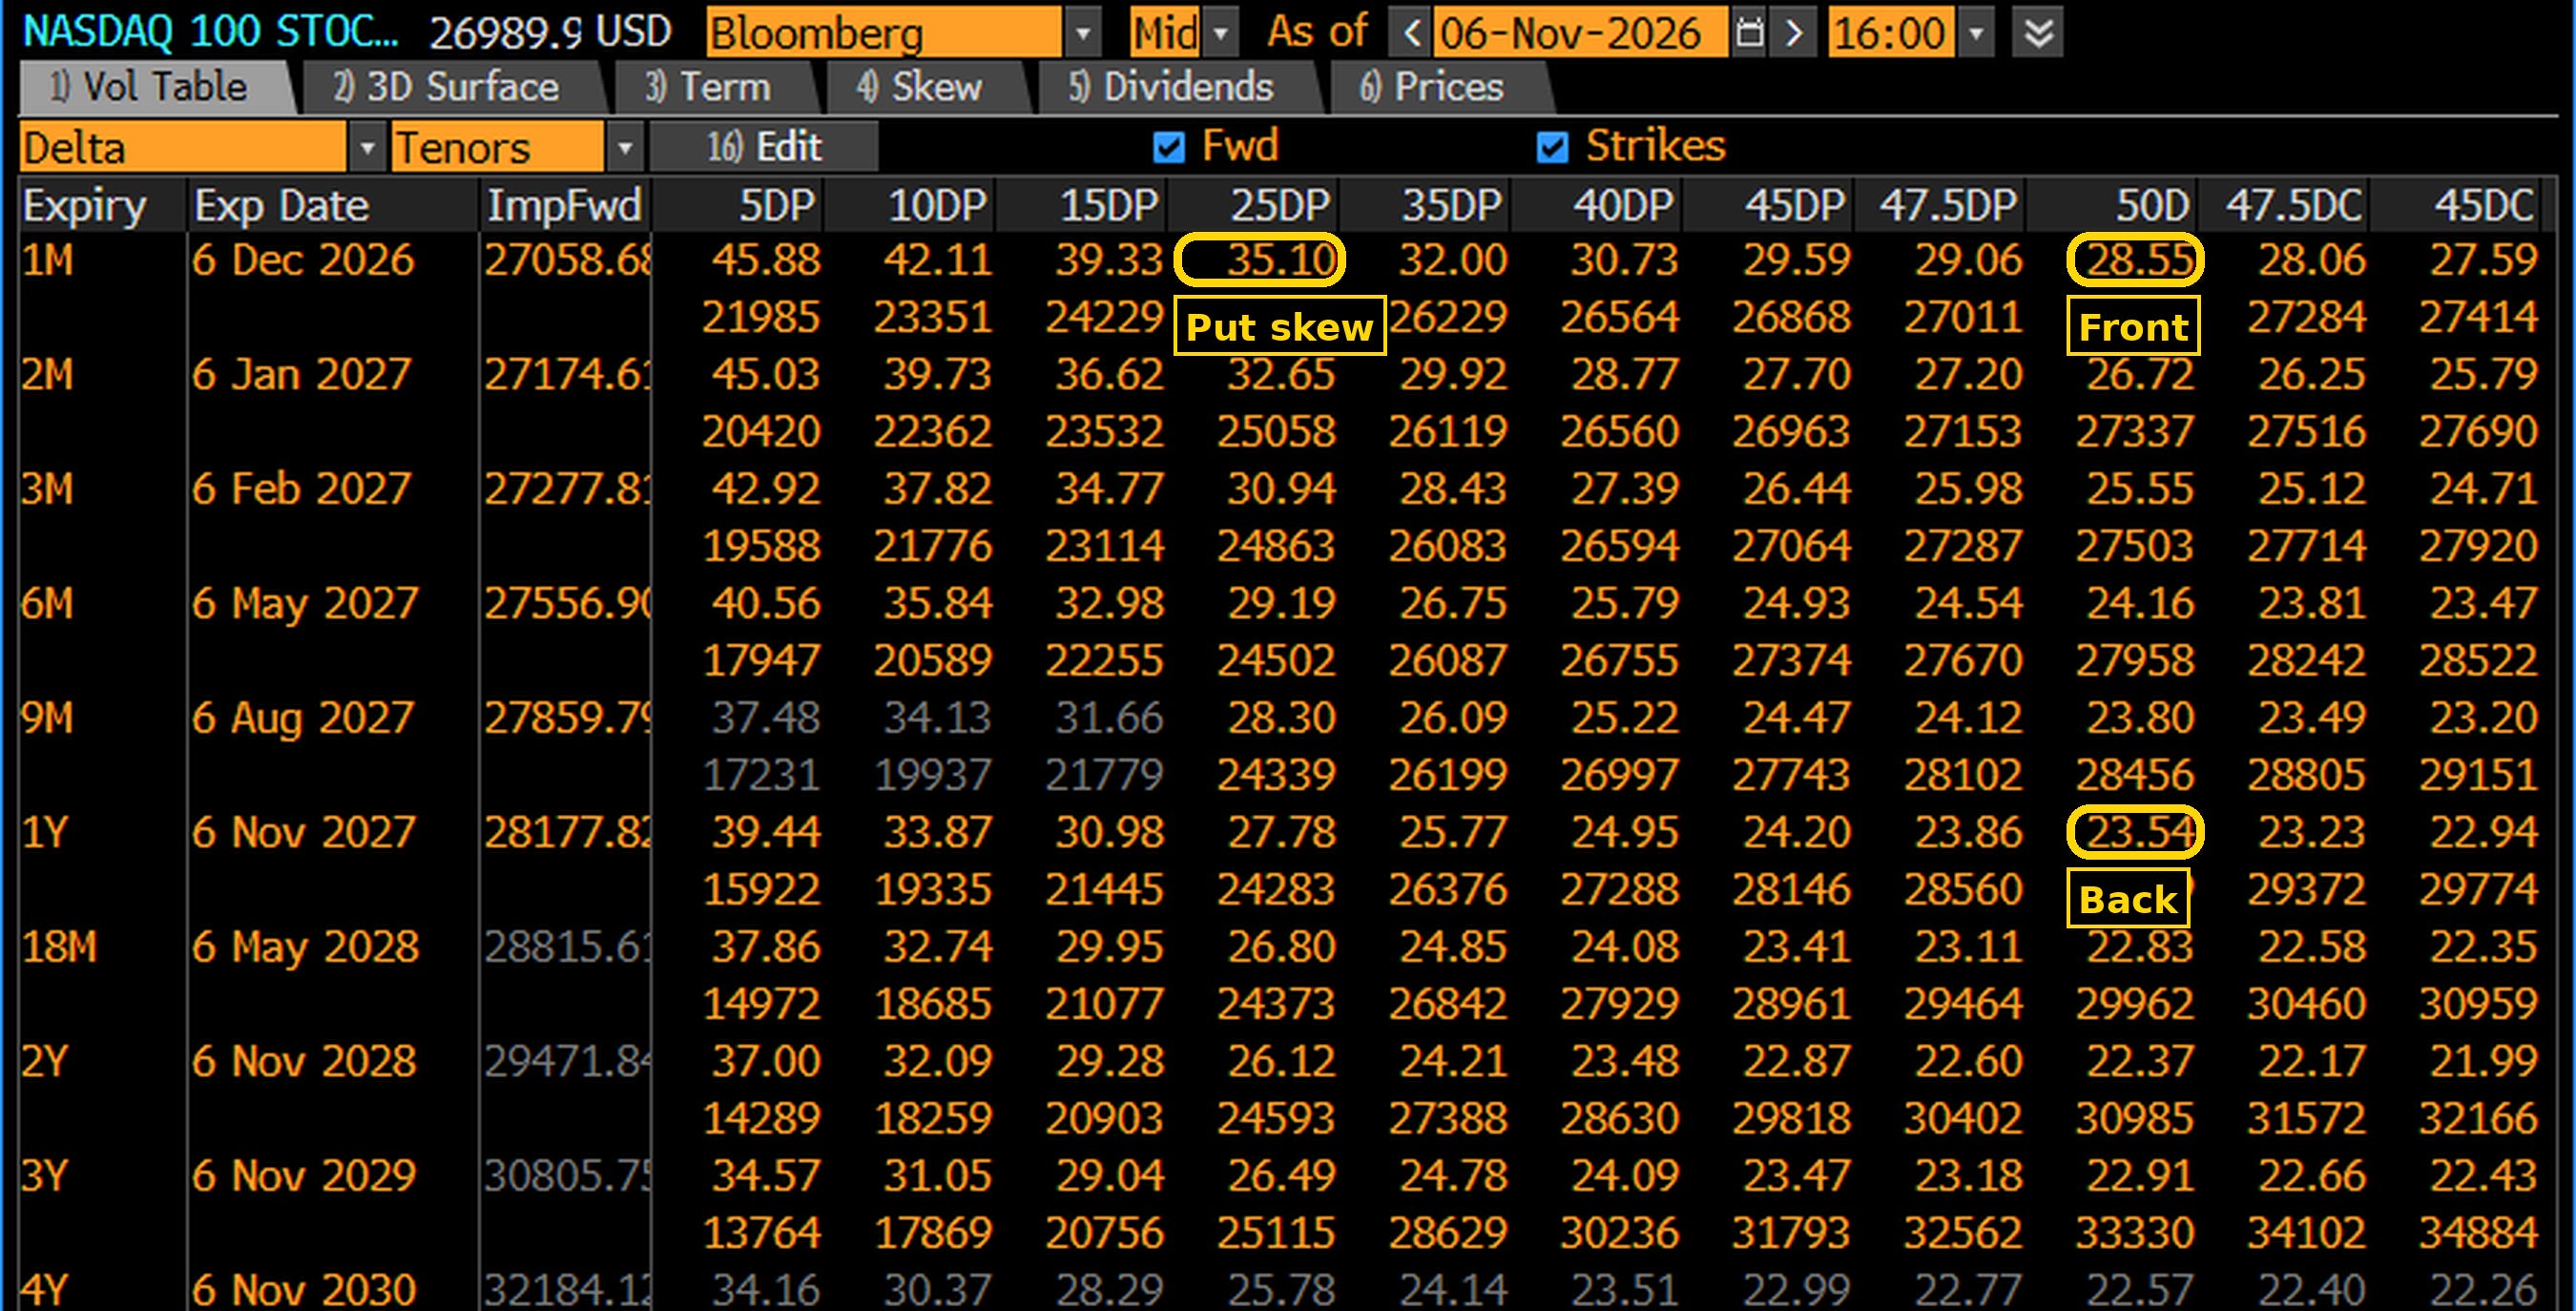
So Thursday reached about half of the April 2025 stress at the front, and Friday gave half of it back. The one-year volatility barely moved. The market treats Thursday as an event, not as a change of regime. On Friday the VIX closed at 25.52, the VXN at 34.0 and the VIX to VIX3M ratio at 1.04: the curve is still inverted going into the weekend. At the close, the Nasdaq 100 surface told the same story: one-month at-the-money volatility at 28.55%, three months at 25.55% and one year at 23.54%, with the one-month 25 delta put at 35.10%.
The skew: sold on Wednesday, bought back on Thursday, and the tail never relaxed. Skew measures how much more investors pay for puts, protection against a fall, than for calls. I explained how to read it in Risk Reversal Skew Explained. On one-month QQQ options:
The gap between 25 delta puts and calls, the standard skew measure, fell to 5.2 volatility points on Wednesday, the 28th percentile of the past year, below the 7.1 of the previous Friday: investors were selling protection into the relief rally. It jumped to 12.4 on Thursday, the 99th percentile, and eased to 9.9 at Friday midday, the 92nd.
The premium of far out-of-the-money puts, the crash insurance, rose from 12.1 to 12.8 points, the 99th percentile.
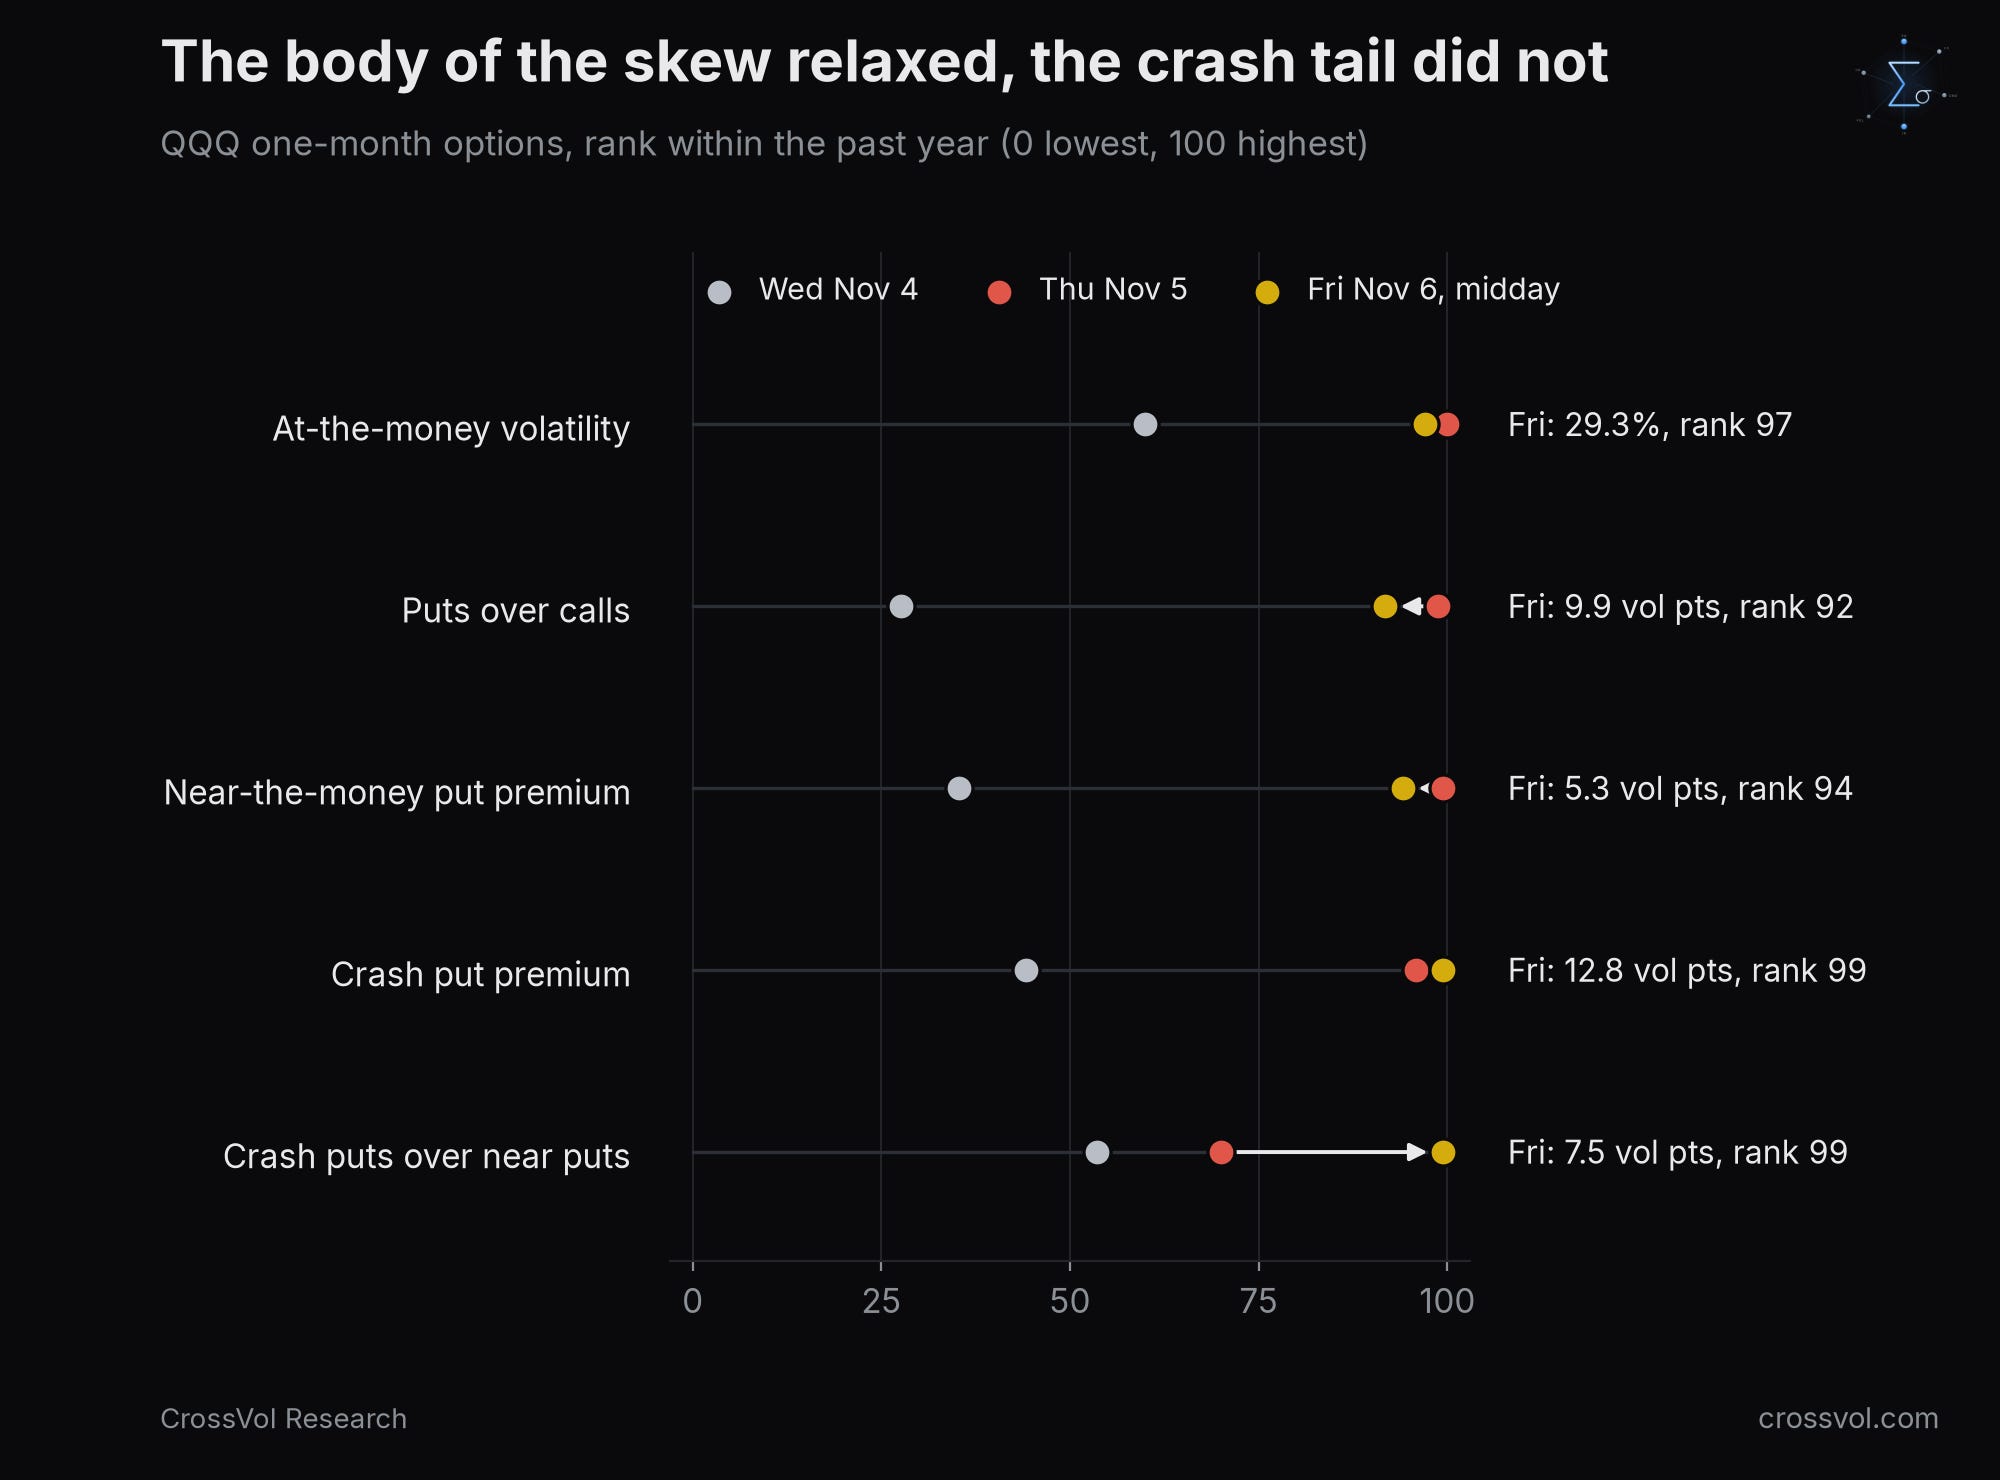
Investors sold back ordinary protection on the bounce, and kept their crash insurance near the highest price of the year. That is not what a market convinced the bottom is in looks like.
Implied volatility is below realized volatility at the front. Normally implied volatility sits above the volatility the index then delivers. That gap is the volatility risk premium, the price of insurance, which I explained in The Volatility Risk Premium Explained. Today it is negative at the front. One-week implied volatility was 34% at Friday midday, while the Nasdaq 100 has delivered about 49% over the last five sessions. Implied stays below realized up to one month. Only from three months does the premium turn positive again, by about 3.5 points. The QQQ straddle for next Friday prices a move of about 3.8% either way.
Read from the prices of Nasdaq 100 puts at Friday midday, the options market gives a 28% chance that the index closes next Friday below Thursday's close, 14% for a fall of 5% or more, and 3.7% for a fall of 10% or more. These probabilities include the premium investors pay for puts, which usually makes them overstate the real odds of a fall. That is why I call the black week a tail, not a forecast.
Who holds the puts? Put and call positions on QQQ and the Nasdaq 100
Volume tells you what traded during the day. Open interest, the number of option contracts still open at the close, tells you who stays exposed overnight.
Thursday set a record for puts, but on QQQ calls traded almost as much. Cboe's daily statistics show 11.2 million puts traded on Cboe on Thursday, against 7.7 million on Wednesday, and 1.06 puts for every call, against 0.80. Bloomberg reported it as the most puts ever traded in one day. On QQQ, though, about 7.0 million puts traded against 6.8 million calls, 1.03 puts for every call, less than the 1.14 of Wednesday. The three most traded contracts were QQQ puts expiring the same day, at the 645, 650 and 640 strikes, with 478,946, 471,022 and 332,425 contracts.
The open positions lean toward puts. At Thursday's close, 7.53 million QQQ puts were open against 6.89 million calls, 1.09 puts per call. On Nasdaq 100 index options the ratio was 1.17, with 107,023 puts against 91,319 calls.
The puts sit at a few strikes. QQQ 650, about 26,725 on the index, holds 428,691 puts in expiries after Friday, and QQQ 600, about 24,670, holds 320,854. The largest single position is a long-dated one: 202,356 QQQ March 2027 puts at the 670 strike, protection on about $13 billion of Nasdaq 100 exposure. On the call side, the largest strikes are far above the market: QQQ 700 and 800, about 28,780 and 32,890 on the index, with about 245,000 calls each. On the November 20 expiry alone, 49,831 QQQ 650 puts were open after Thursday, 8,371 more than the day before, and another 16,771 traded on Friday.
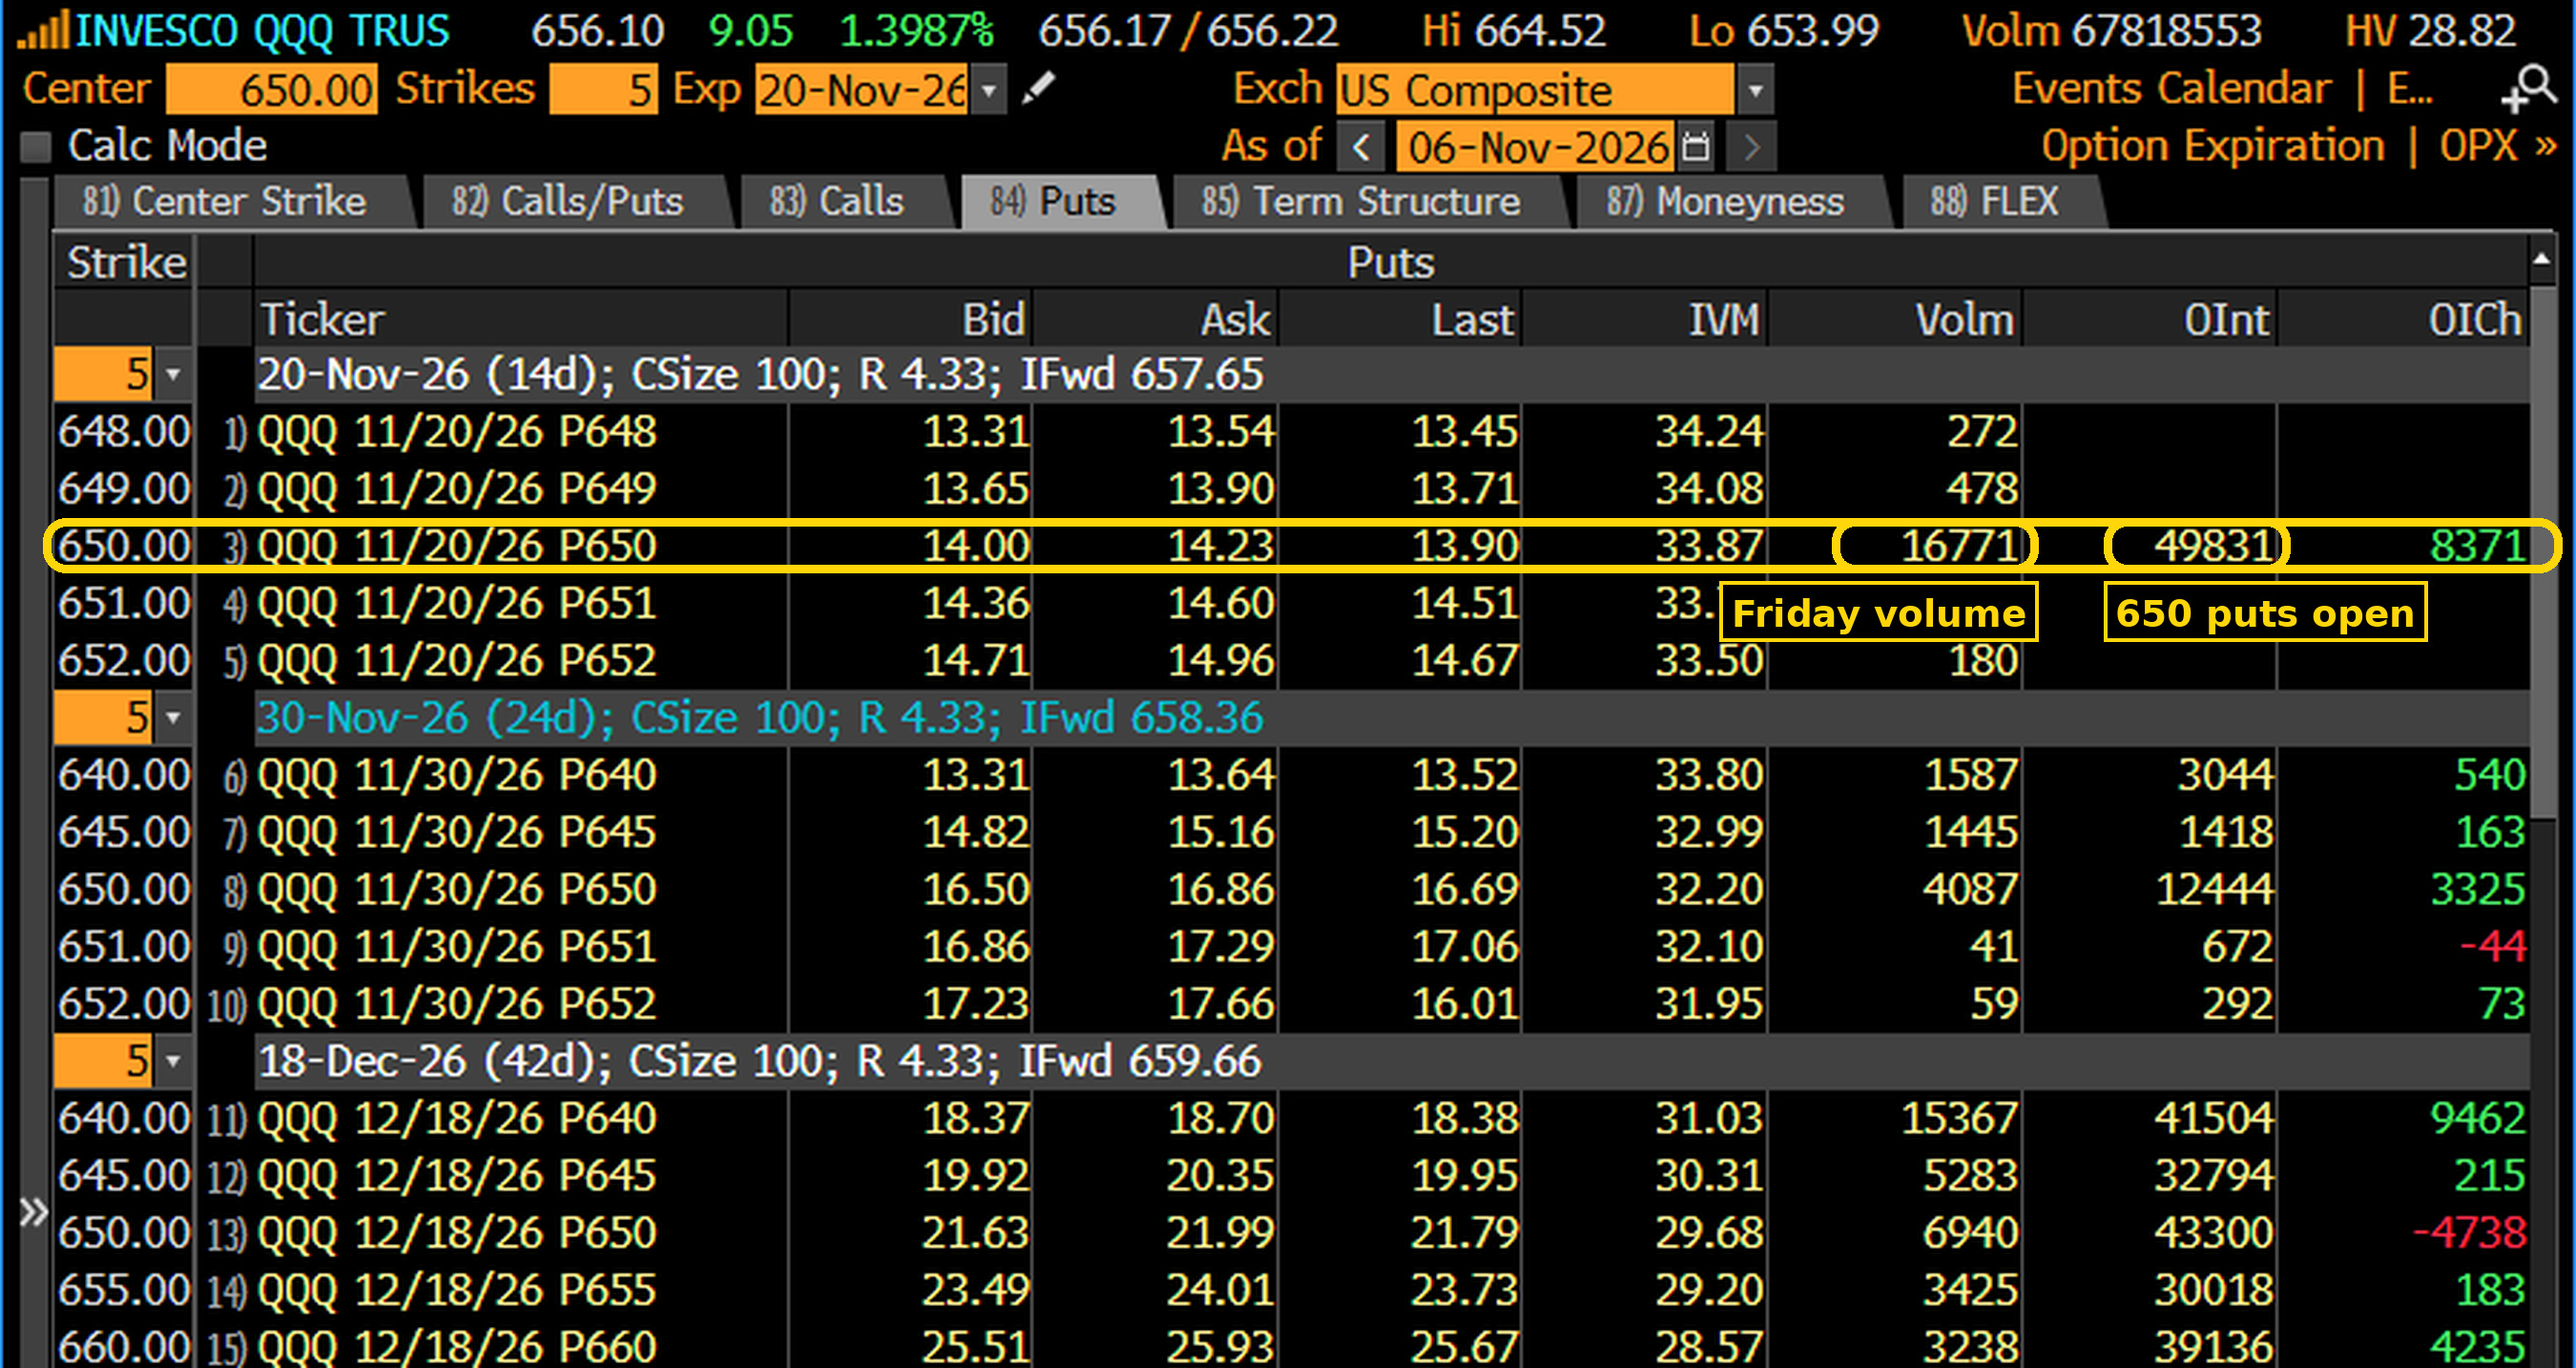
Who sold and who bought. On Thursday, 62,022 QQQ November 20 puts at the 650 strike traded, $108.6 million of premium, mostly at the bid, which usually means sales, while 22,847 December puts at the 690 strike traded, $91.4 million, mostly at the ask and largely to close existing positions. Between Tuesday's close and Thursday's close, open interest in QQQ puts after March 2027 rose by 76,853: protection is moving to 2027.
What do swaps tell us about positioning?
Two kinds of swaps matter here: one can be read every day, the other can hardly be seen at all, which is a risk in itself.
Variance swaps: the price of the tails. A variance swap pays the difference between the volatility an index actually delivers and a level fixed at the start. The VXN is computed from the whole strip of out-of-the-money Nasdaq 100 options, which is how a 30-day variance swap is priced, so it is a good guide to that level. The gap between the VXN and one-month at-the-money QQQ volatility shows how much investors pay for the tails: 2.8 points on Wednesday, 25.08 against 22.3, then 4.7 on Thursday, 38.26 against 33.6, and about 4.3 at Friday midday, 33.4 against 29.1. The bounce took 4.5 to 5 points off both and left the gap almost intact: the tails kept their price. The VXN also closed more than 8 points above the VIX on Friday, against a median of 5.7 over the past year. The stress is concentrated in the Nasdaq.
A variance swap struck near the VXN's Friday close of 34 needs the Nasdaq 100 to move less than about 2.1% on a typical day over the next month for its seller to make money. Over the last five sessions the index delivered about 49% annualized, more than 3% a day. Sellers of variance are betting that Thursday was a one-off, just before the two weeks most likely to prove them wrong.
One old danger is absent. In February 2018, products linked to the VIX had to buy VIX futures into a spike, and one of them was wiped out. On our terminal, what these products would have to buy if the VIX rose another 10 points is a few percent of a normal day's volume, the lowest reading of the past year. They are not the weak link this time.
Equity swaps: the positions nobody can see. Hedge funds hold much of their stock exposure through total return swaps with their prime brokers: the bank owns the shares and the fund receives the performance, with leverage. New swap trades are reported without names, and the stock of positions is not reported at all. That is how Archegos built large, concentrated positions in 2021 without appearing in any public filing. What can be observed is indirect: on Thursday the stocks hedge funds own most fell hardest while the most shorted rose, the signature of a forced unwind of long and short books at the same time. What is not observed is the size of the swap books and where their margin calls start. That is why I treat the hedge fund unwind as a risk to watch in prices, not as a number.
What does the CFTC report say about hedge funds and asset managers?
Every Friday, the CFTC, the US futures regulator, publishes the positions held the previous Tuesday in financial futures, split by type of trader. For stock index futures, three groups matter. Asset managers are pension funds, mutual funds and insurers. Leveraged funds include hedge funds and trend followers. Dealers are the banks on the other side.
The latest report covers Tuesday, November 3, with the Nasdaq 100 at about 28,180. It was published on Friday at 3:30 pm New York. It does not show Thursday's selling. It shows who was exposed when it started.
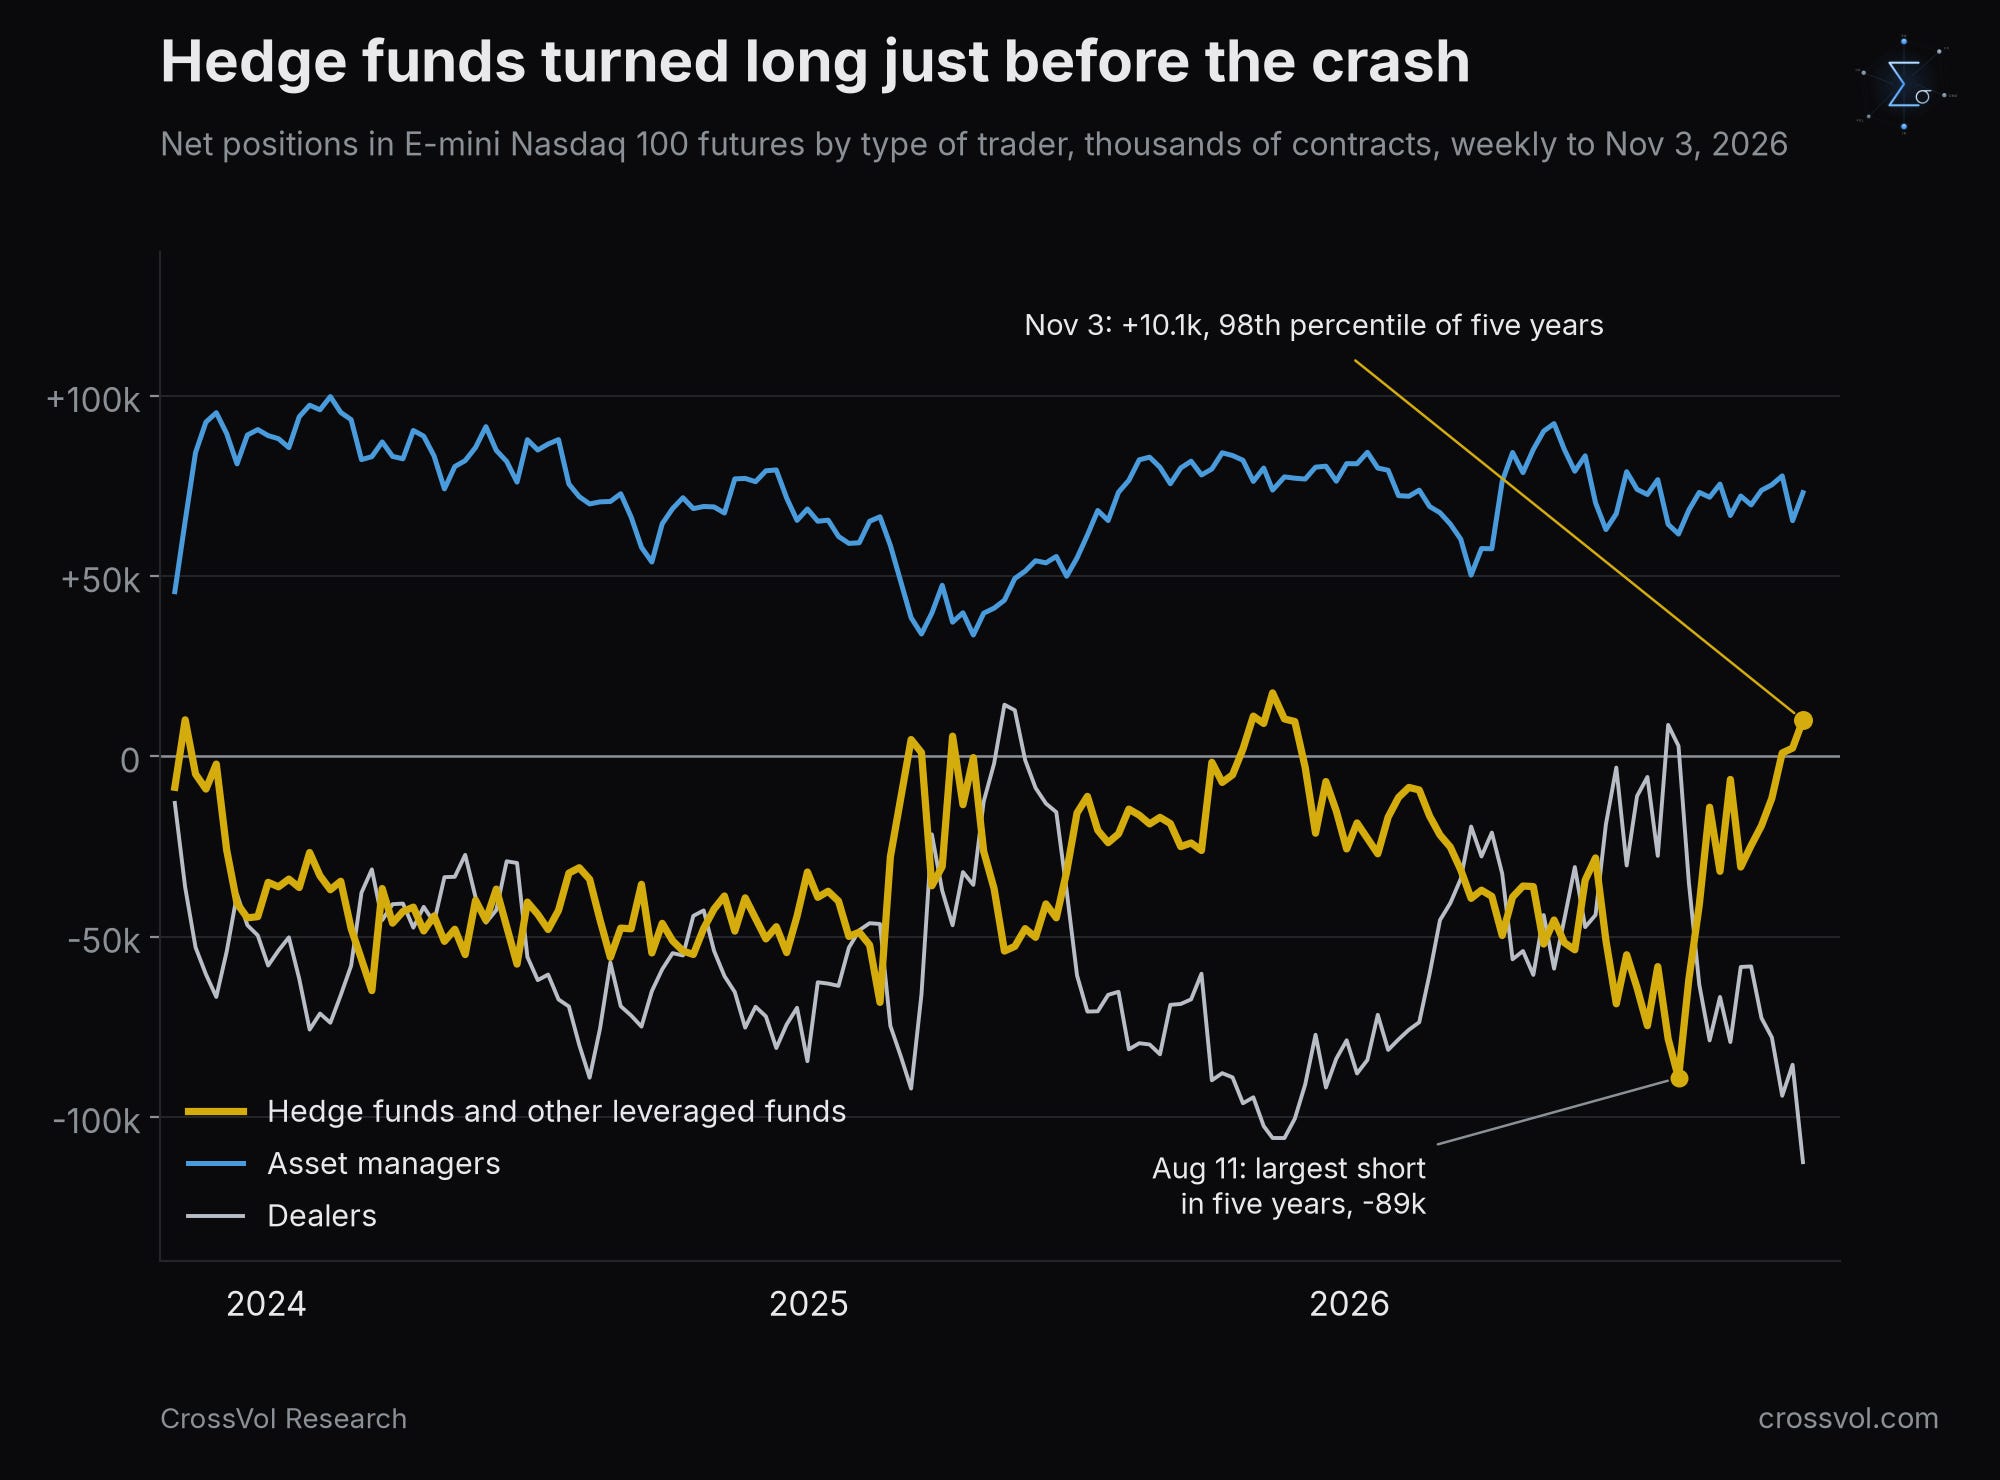
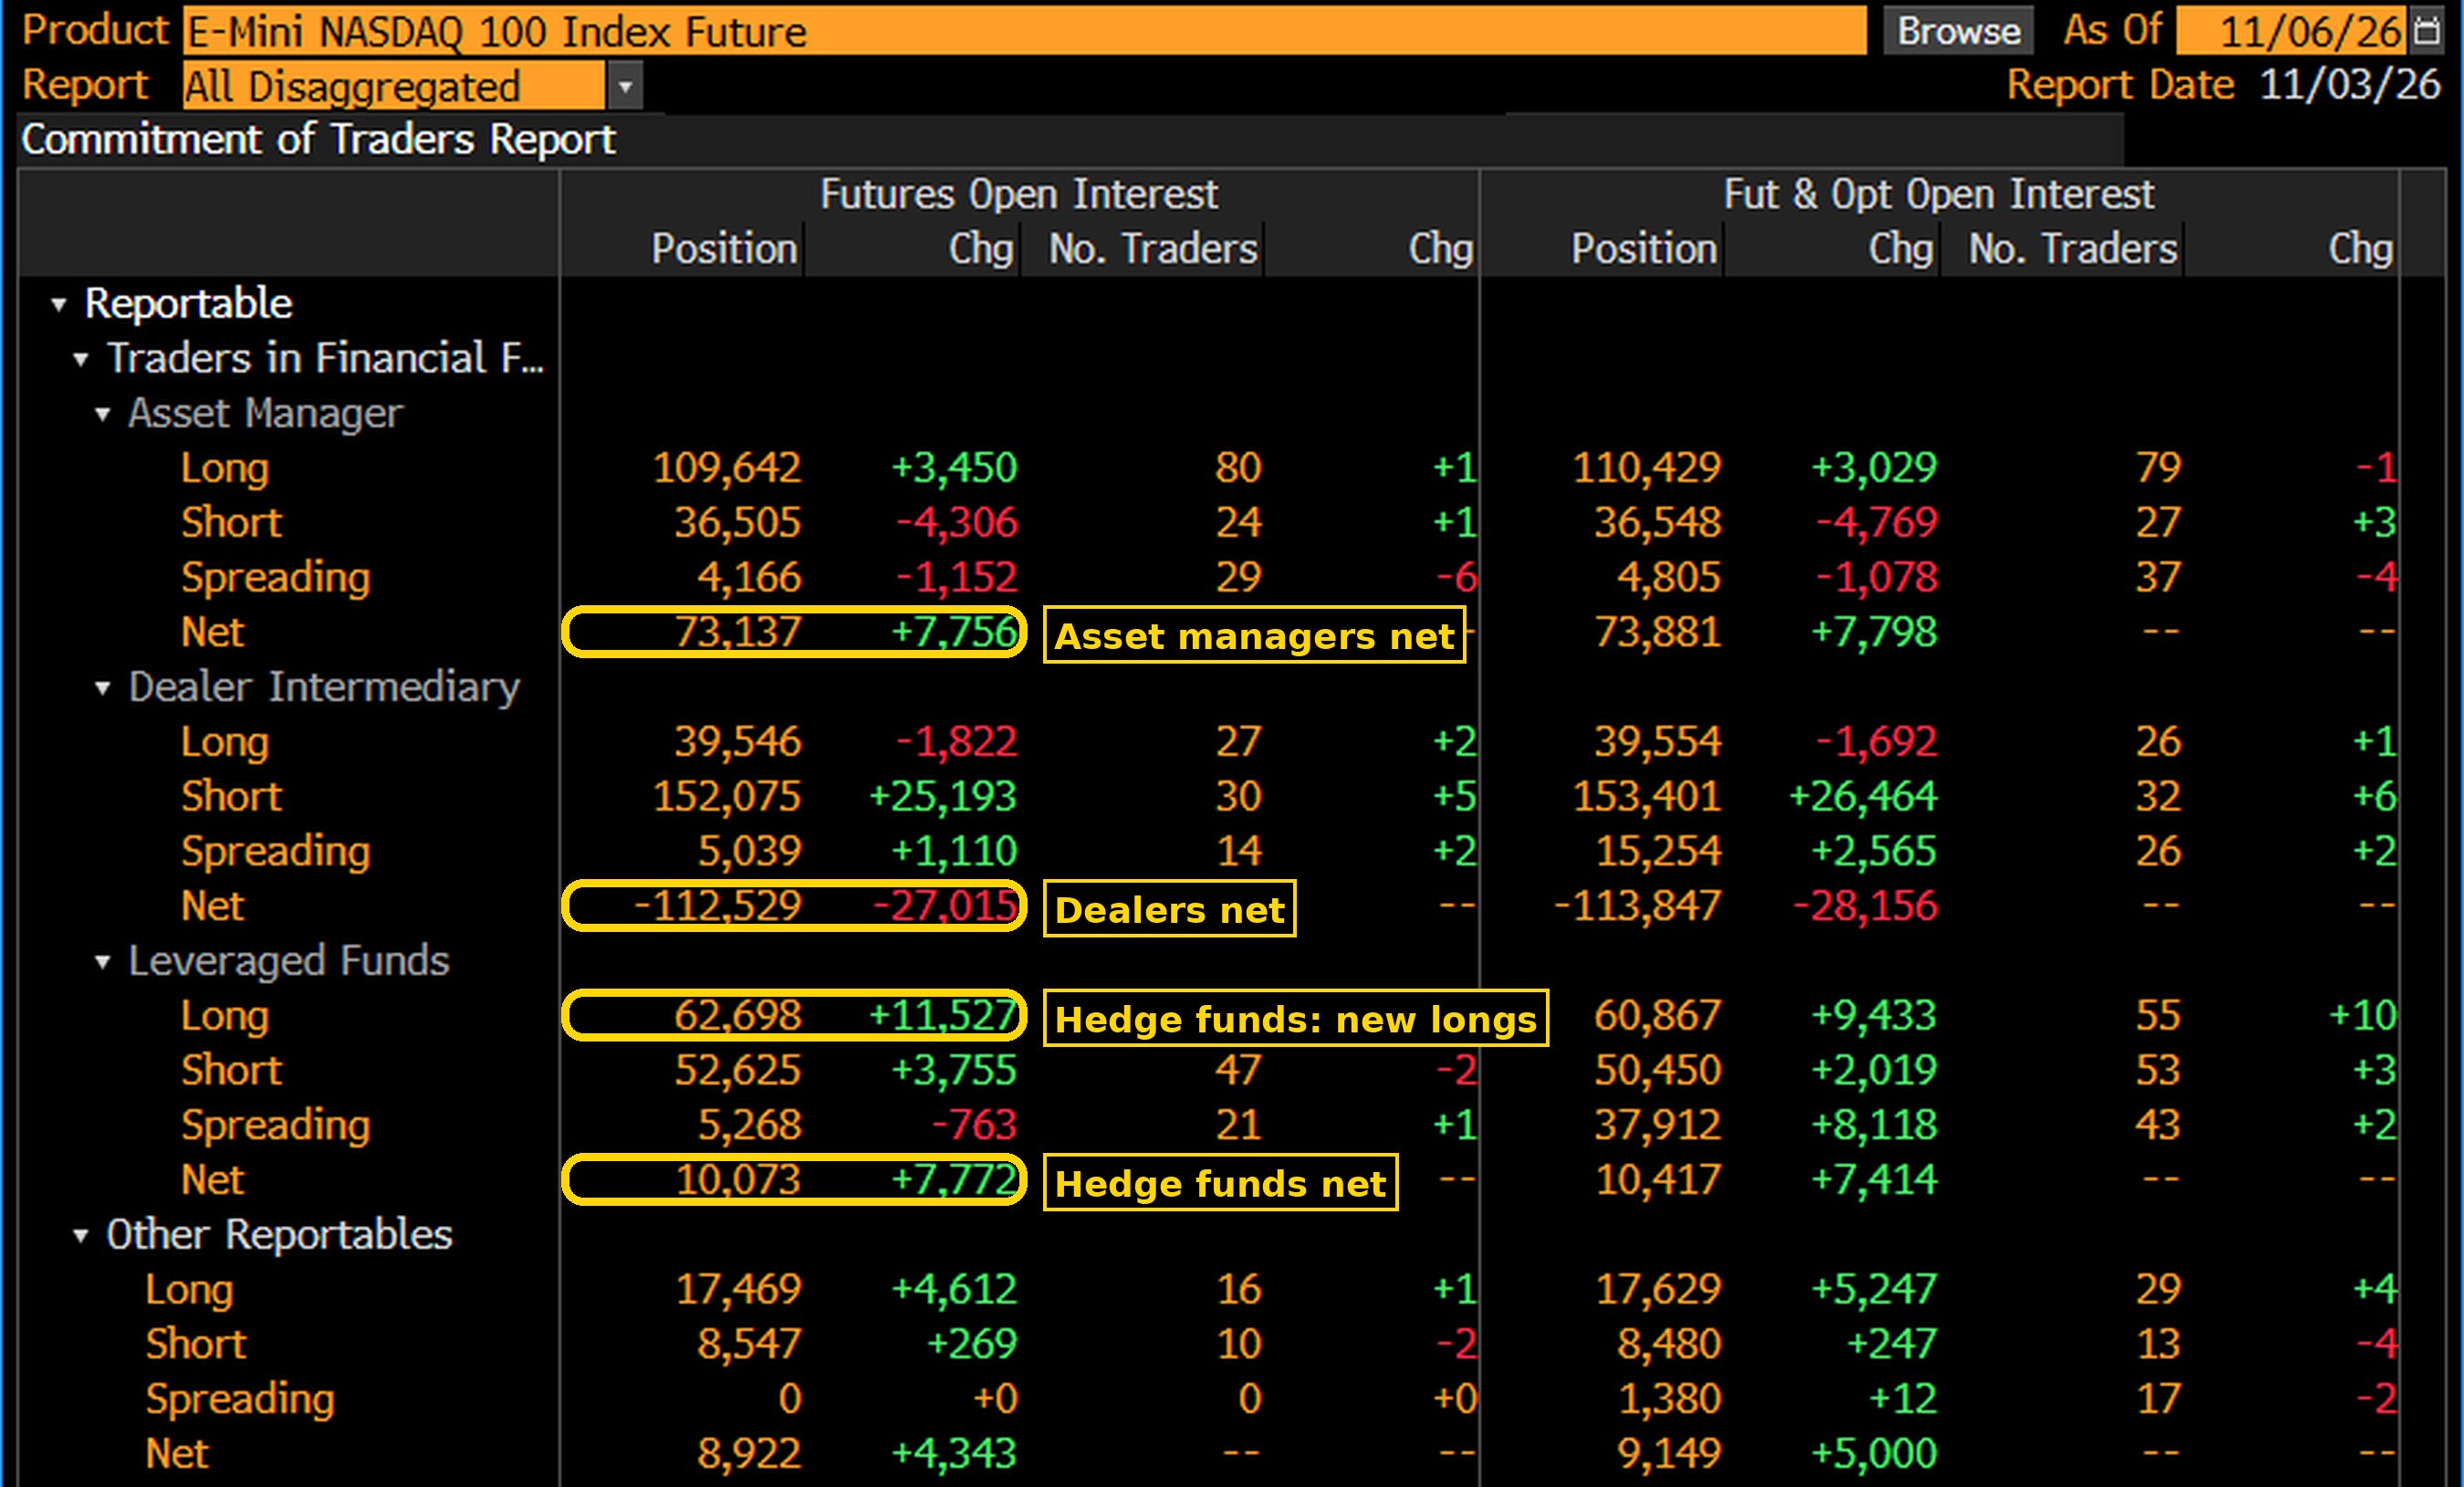
Leveraged funds turned long at the wrong time. On August 11, leveraged funds were net short 89,125 E-mini Nasdaq 100 contracts, their largest short of the past five years. They turned net long on October 20, for the first time since November 2025, and held 10,073 contracts net long on November 3, after adding 7,772 in the last week. In twelve weeks they bought 99,198 contracts, about $56 billion of Nasdaq 100 exposure at November 3 prices. A small net long sounds harmless, but for this group it ranks in the 98th percentile of the past five years: leveraged funds are usually short Nasdaq futures, as a hedge against their stock portfolios or as a trend bet. They lifted the hedge, or bought the trend, near the top.
Dealers took the other side. Over the same twelve weeks, dealers went from a small net long to a net short of 112,529 contracts, their largest short of the past five years.
Asset managers did not run. Asset managers held a net long of 73,137 contracts, about $41 billion, in the 67th percentile of five years. In the week to November 3 they added 7,756 contracts, about $4.4 billion.
On the S&P 500, the picture is calmer. Asset managers held a net long of 928,584 E-mini S&P 500 contracts, about $351 billion, in the 69th percentile of five years. Leveraged funds were net short 372,318 contracts, about $141 billion, partly the futures leg of the basis trade, in which funds buy stocks and sell futures against them, so not a pure bet on a fall.
What it means for next week. The money that chased the Nasdaq into late October is the money that has to cut first. On our terminal's positioning monitor, those longs were built well above current prices and are now under water. The next report, for Tuesday, November 10, will be the first to show how much of it was sold in the crash.
What are leveraged ETFs forced to sell?
Leveraged ETFs promise two or three times the daily move of an index, or of a single stock, or the inverse of it. To keep that promise they rebalance every day at the close, and always in the direction of the market.
Take a fund with $100 of assets and three times leverage: it holds $300 of exposure. After a 6.36% fall, as on Thursday, it has $80.9 of assets and $280.9 of exposure, so it must sell $38.2 into the close to get back to three times. A fund that bets three times against the index must add to its short after a fall, which is also a sale. Long or short, leveraged ETFs sell after down days and buy after up days, in the last minutes of trading, all in the same direction.
How large is it this week? From the assets the issuers publish, I estimate that the leveraged and inverse ETFs on the Nasdaq 100, on chips and on single AI stocks had to sell about $40 billion of exposure at Thursday's close. About $16 billion came from the Nasdaq 100 funds, $13 billion of it from TQQQ alone. About $22 billion came from the chip funds, because semiconductors fell twice as much as the index. Funds on single stocks such as Nvidia, Micron and AMD added about $2 billion. On Friday's bounce, the same funds had to buy back about $10 billion at the close. Retail money keeps buying these dips with leverage: according to 247 Wall St., investors put $7.27 billion into SOXL and $3.49 billion into TQQQ in October, and Korean retail investors alone net bought $2.97 billion of SOXL.
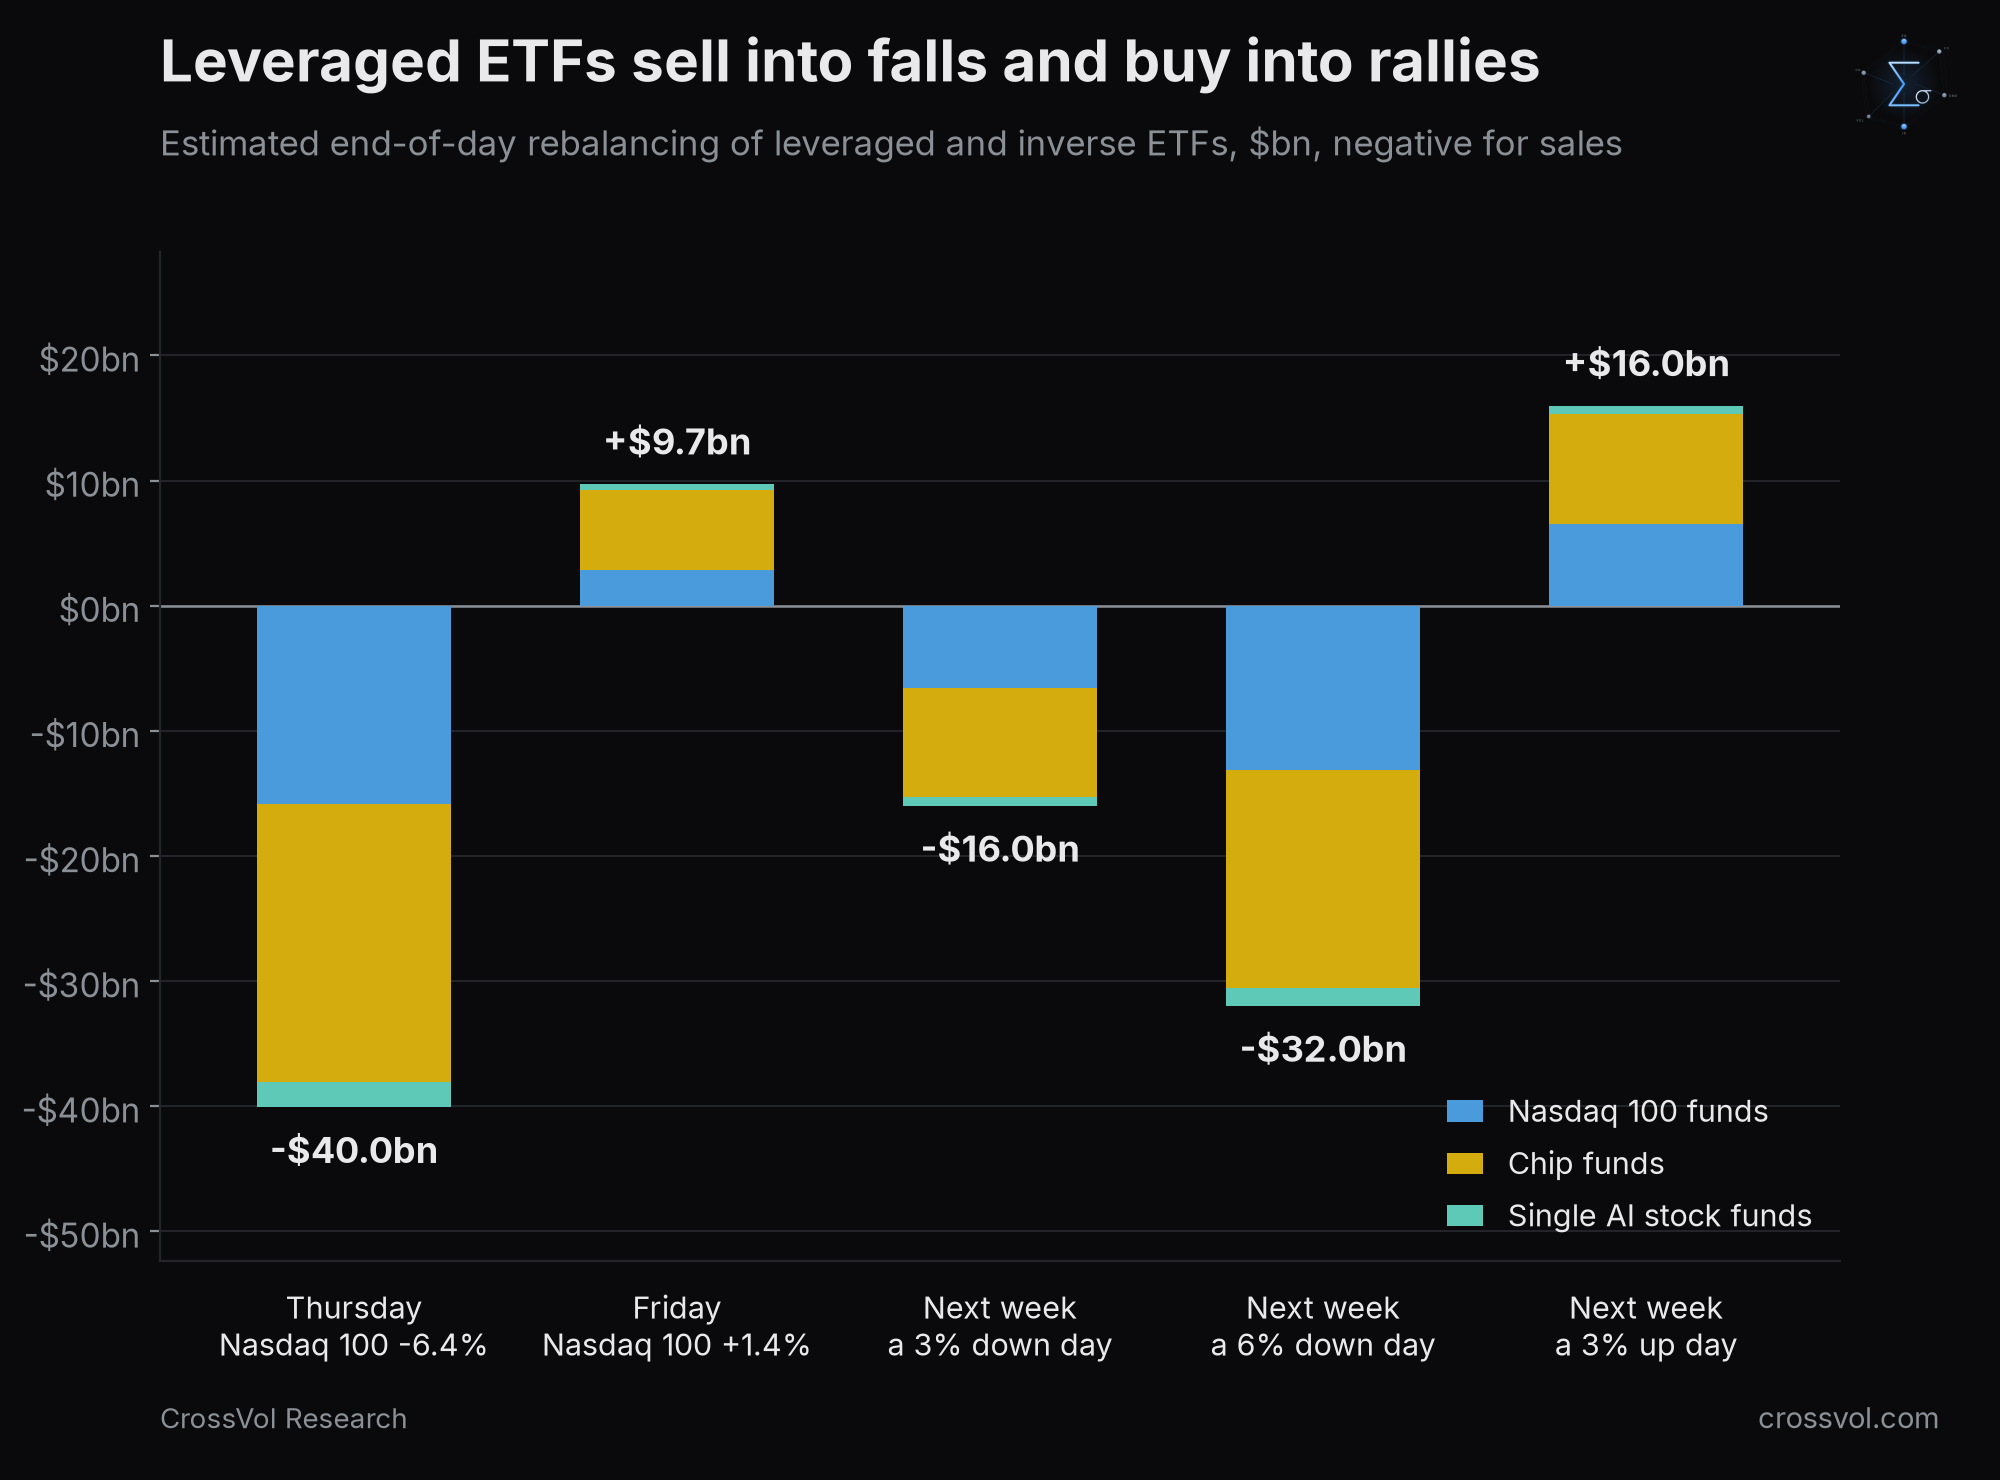
Next week, at Friday's asset levels, a 3% fall of the Nasdaq 100 in one session would force about $16 billion of sales at the close, and a 6% fall, a repeat of Thursday, about $32 billion. A 3% rise would force about $16 billion of purchases. The group's assets have shrunk from about $85 billion at Wednesday's close to about $68 billion at Thursday's, so the same fall now forces about a fifth less selling than on Thursday, and chip funds still carry more than half of it. On a day when Nvidia or CoreWeave disappoints, the chip funds are the first to sell.
Where is the trap door below 26,600?
Five groups of mechanical sellers line up at the same levels. Above 27,000 they are a headwind. Below 26,600 they become a trap door.
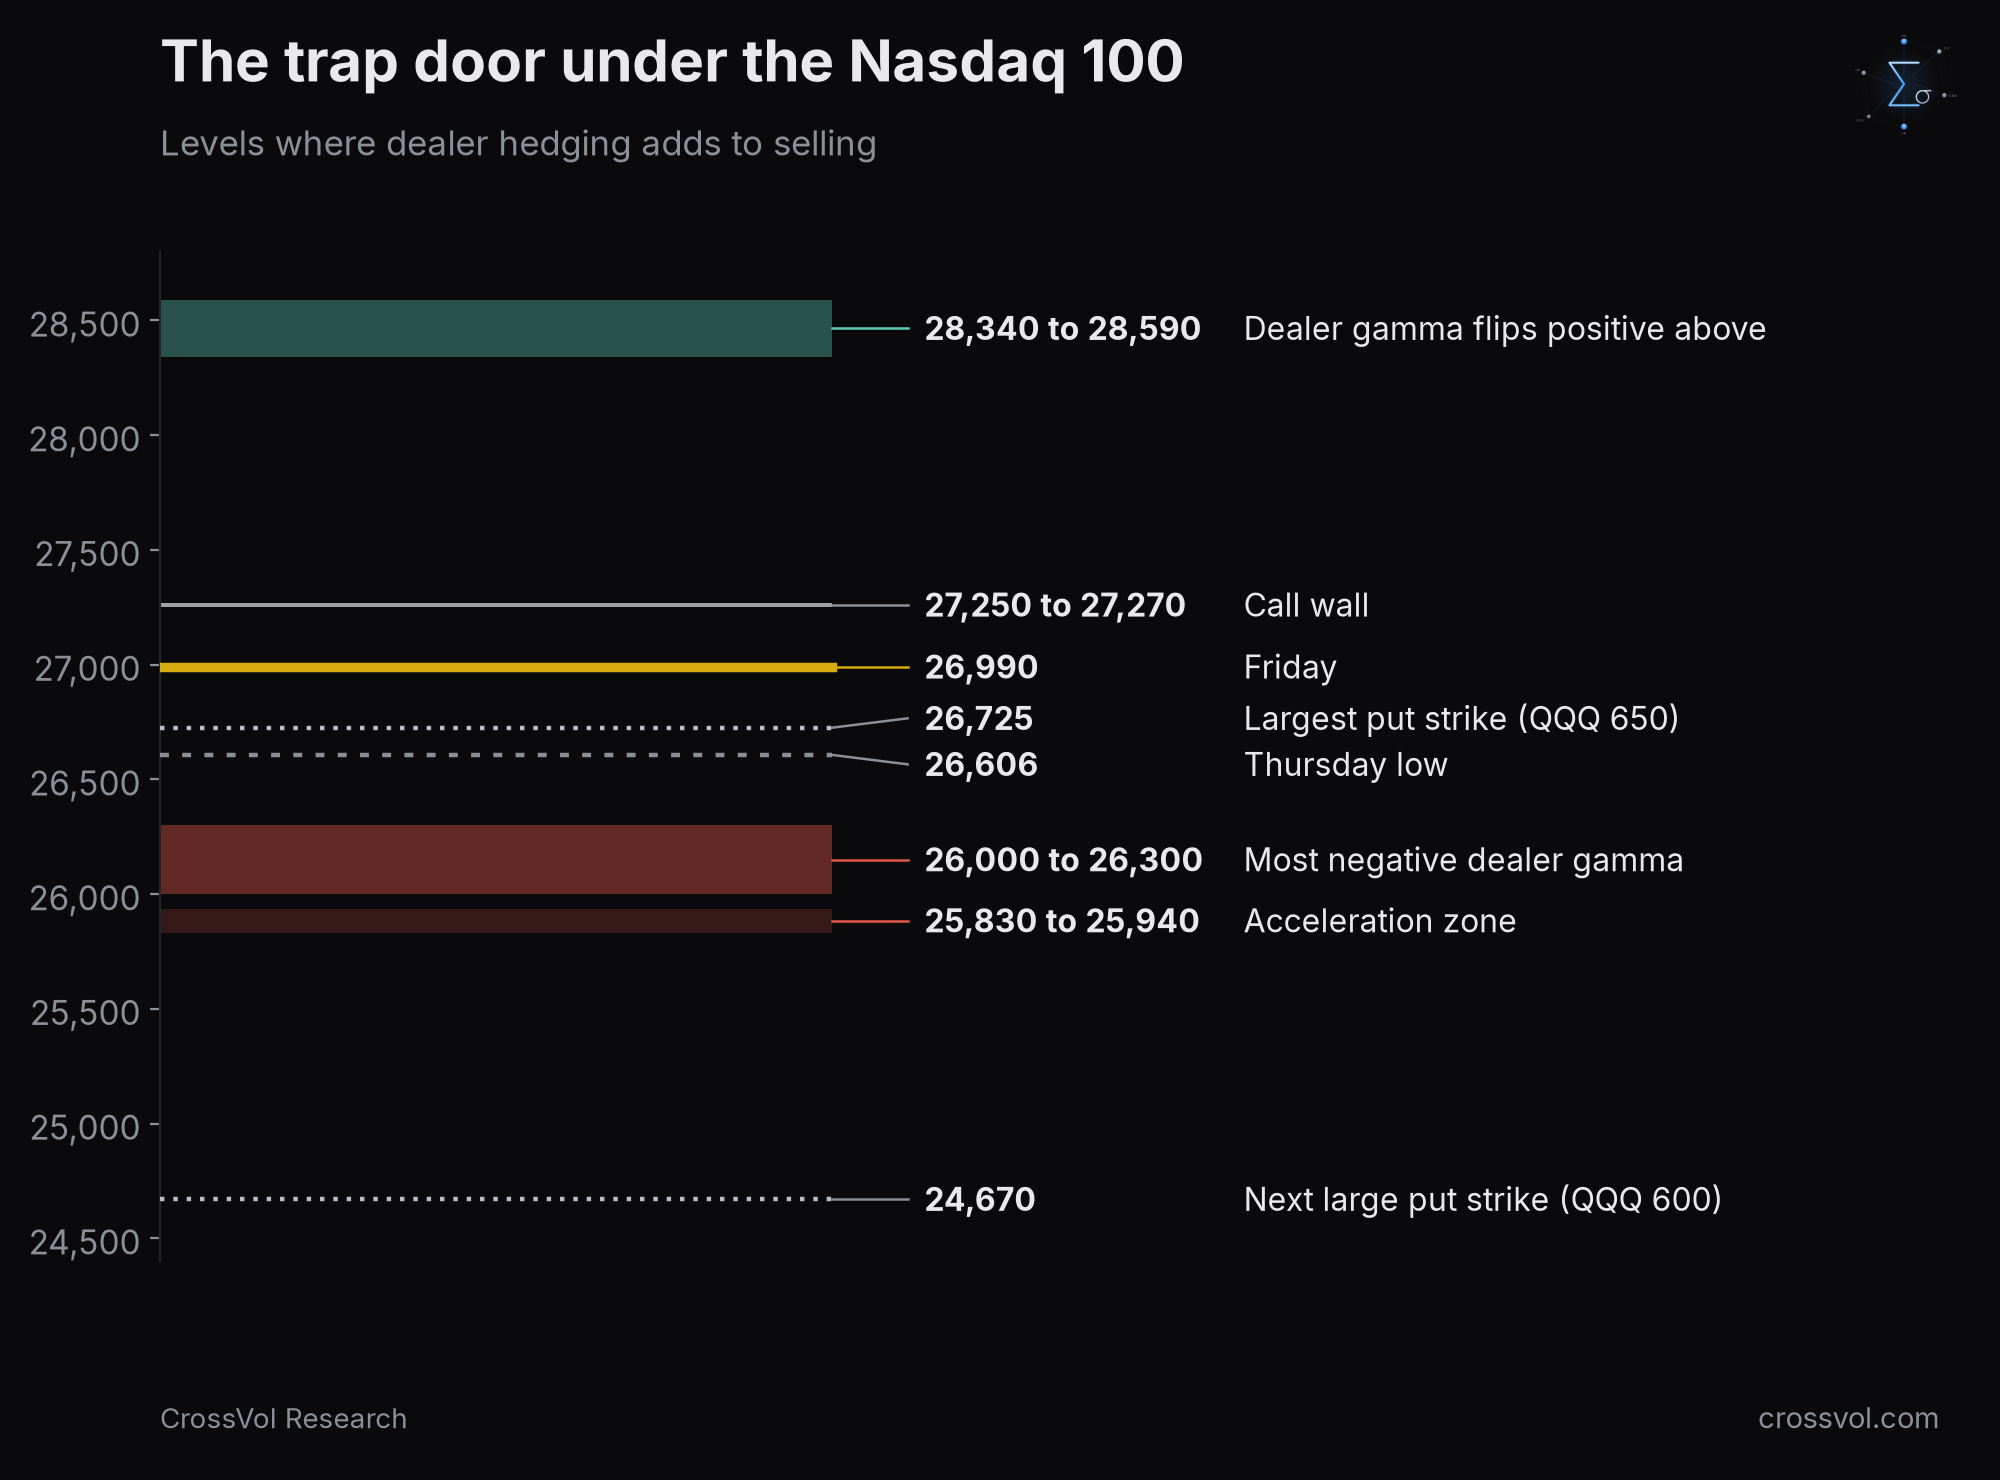
Dealers. Our estimate of dealer gamma on Nasdaq 100 and QQQ options, on Thursday night's positions, is about minus $8.7 billion per 1% move around Friday's close. It gets worse as the index falls, reaching minus $10.1 billion between 26,000 and 26,300, and there is no positive gamma floor below. In plain terms, every 1% fall below 26,630 would force dealers to sell roughly $9 billion to $10 billion of Nasdaq exposure. Our terminal marks an acceleration zone near 25,850 on the index. Its DEFCON gauge, a five-level stress scale where 1 is the worst, swung between 3 and 2 on Friday, at 2 shortly after the Microsoft headline, and ended the week at 3.
The largest put strikes sit right there: QQQ 650, about 26,725 on the index, then 26,500, 26,000 and QQQ 600, about 24,670. In a market where dealers are short gamma, big put strikes act as magnets more than floors. They become support only when put buyers start taking profits.
Leveraged ETFs. They sell at the close of every down day: about $16 billion for a 3% fall of the Nasdaq 100, $32 billion for a 6% fall, more than half of it in chip funds.
Trend followers. CTAs, or commodity trading advisors, are systematic funds that buy futures when prices trend up and sell when they trend down, over short, medium and long horizons. On our trend model, the Nasdaq 100 futures signal is near its most negative level of the past year: the short and medium-term signals are already short, and the long-term signal is still slightly long and close to turning. When it turns, all three horizons sell together. Across US equity futures, trend followers have gone from a large long a year ago to a small short.
Volatility-targeting funds. These funds hold more stocks when markets are calm and fewer when they are volatile, to keep the risk of the portfolio constant. The realized volatility of the S&P 500 over 20 sessions has gone from 12.6% on Wednesday to 20.1%, and over 10 sessions from 15.0% to 26.2%. For a fund that targets 10% volatility, that means going from about 79% invested to about 50%. These funds spread the cut over several sessions, so part of that selling lands next week even without a new fall. Thursday stays inside the 20-session window until early December.
Hedge funds. The CFTC data above show leveraged funds net long Nasdaq futures two days before the crash, in the 98th percentile of five years. Our hedge fund monitor shows the same crowd from another angle: gross exposure near the top of its range, net exposure middling. Funds positioned like that protect themselves with index puts rather than by selling their longs, which fits Thursday's record put volume, and they sell the longs only when the puts stop being enough. Our deleveraging gauge, which tracks the pressure on hedge funds to cut, is in its high zone and rose again this week. A list of hedge fund losses circulated this week, which I could not verify: Arini was reported down 26%, VARA 33%, Tiger Global 8.5% and Lone Pine 8.8%. On October 25 I wrote that "the real risk sits in the longs." That is where it sits now.
One piece is still missing: capitulation. One-month implied correlation on the S&P 500 jumped from 9.5 on Wednesday to 22.8 on Thursday, but it remains far from its high of the year, 41.7, and the realized correlation between S&P 500 stocks is still low, around 0.17. Bottoms usually come when everything falls together and diversification stops working. If the selling spreads from AI to the whole market, correlation rises, and the systematic funds have to sell even more.
What happens after a stock market crash? Forty years of Nasdaq history
Before Thursday, the Nasdaq 100 had fallen 5% or more in one session 69 times since October 1985. Thursday was the first such fall since April 2025.
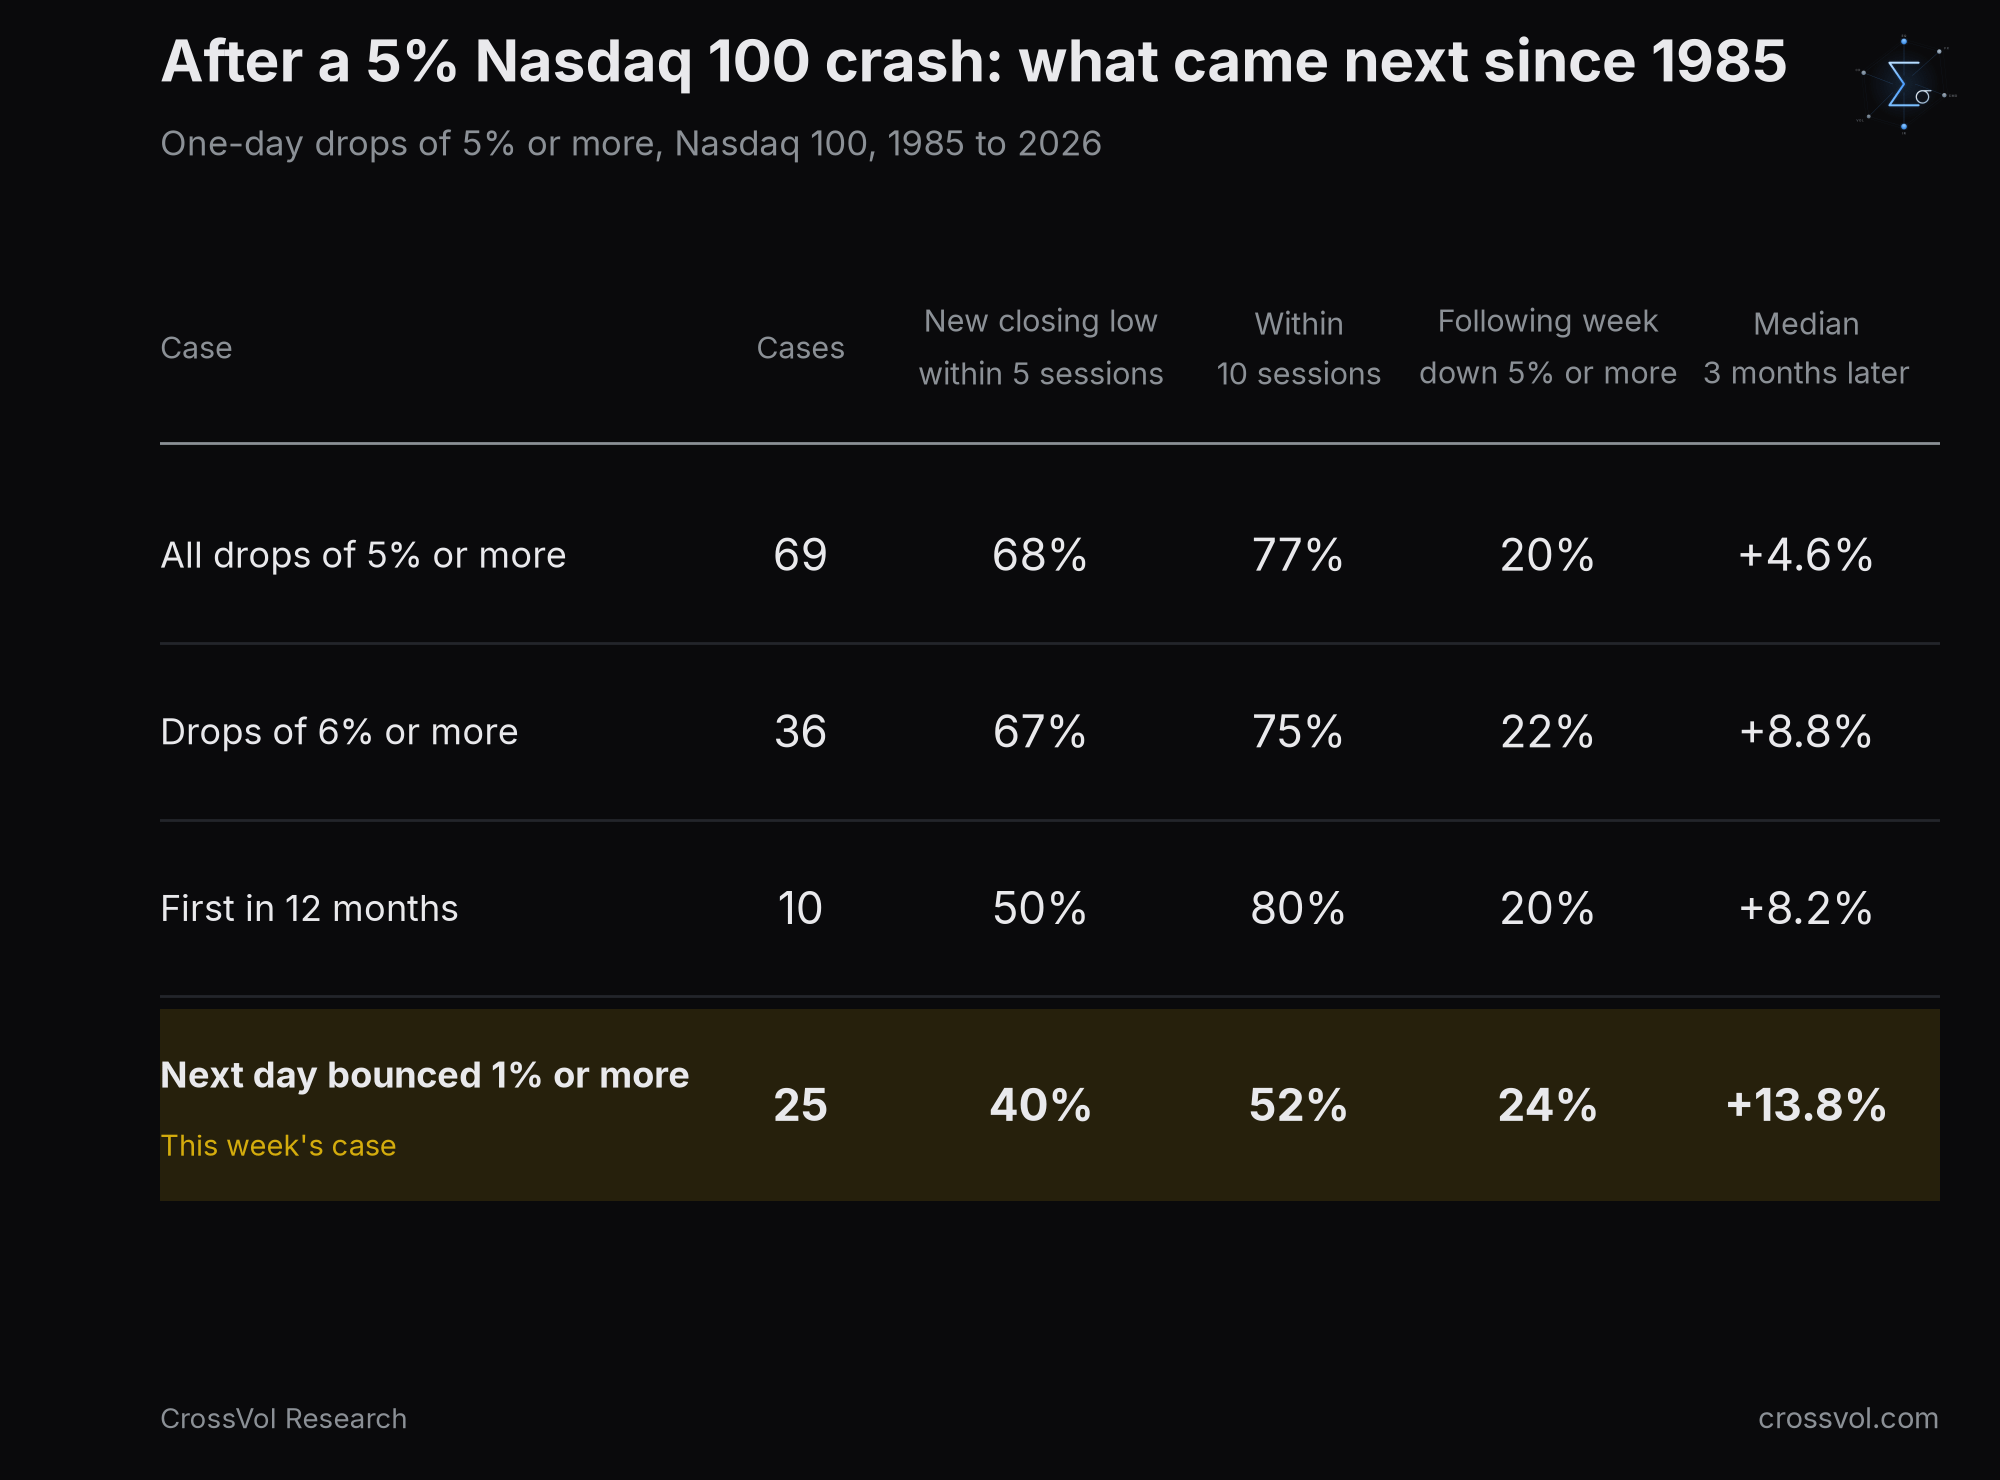
Across all 69 cases, the index closed below the crash day's close within five sessions 68% of the time and within ten sessions 77% of the time. The median maximum loss over the next 20 sessions was 10.7%.
When the next day bounced at least 1%, as on Friday, 25 cases, a new closing low came within the following five sessions 40% of the time, and within two weeks 52% of the time.
The black week. In 6 of those 25 cases the week after the bounce fell 5% or more: October 1987, March 2001, September and October 2008, and twice in March 2020. Every one of them came inside a crisis that was already underway.
Three months later, the median return after such a bounce was plus 13.8%, and the index was higher in 18 of the 25 cases.
History supports the dead cat bounce more than the black week. It also says that a crash like Thursday's has usually been bought within three months, unless the market is already in a crisis. The next two weeks will tell us which regime this is.
Why did Microsoft walk away from Oracle?
Bloomberg reported on Friday that Microsoft is winding down an arrangement to rent AI computing capacity from Oracle. According to the report, Microsoft chose not to renew the contract and has been switching that capacity off in recent months. People familiar with the matter said the rented capacity no longer met Microsoft's requirements, and several accounts of the story point to the older generation of Nvidia chips it ran on. The value of the arrangement was not disclosed, and Microsoft declined to comment. Oracle answered that demand for its AI infrastructure remains strong, including for earlier-generation GPUs.
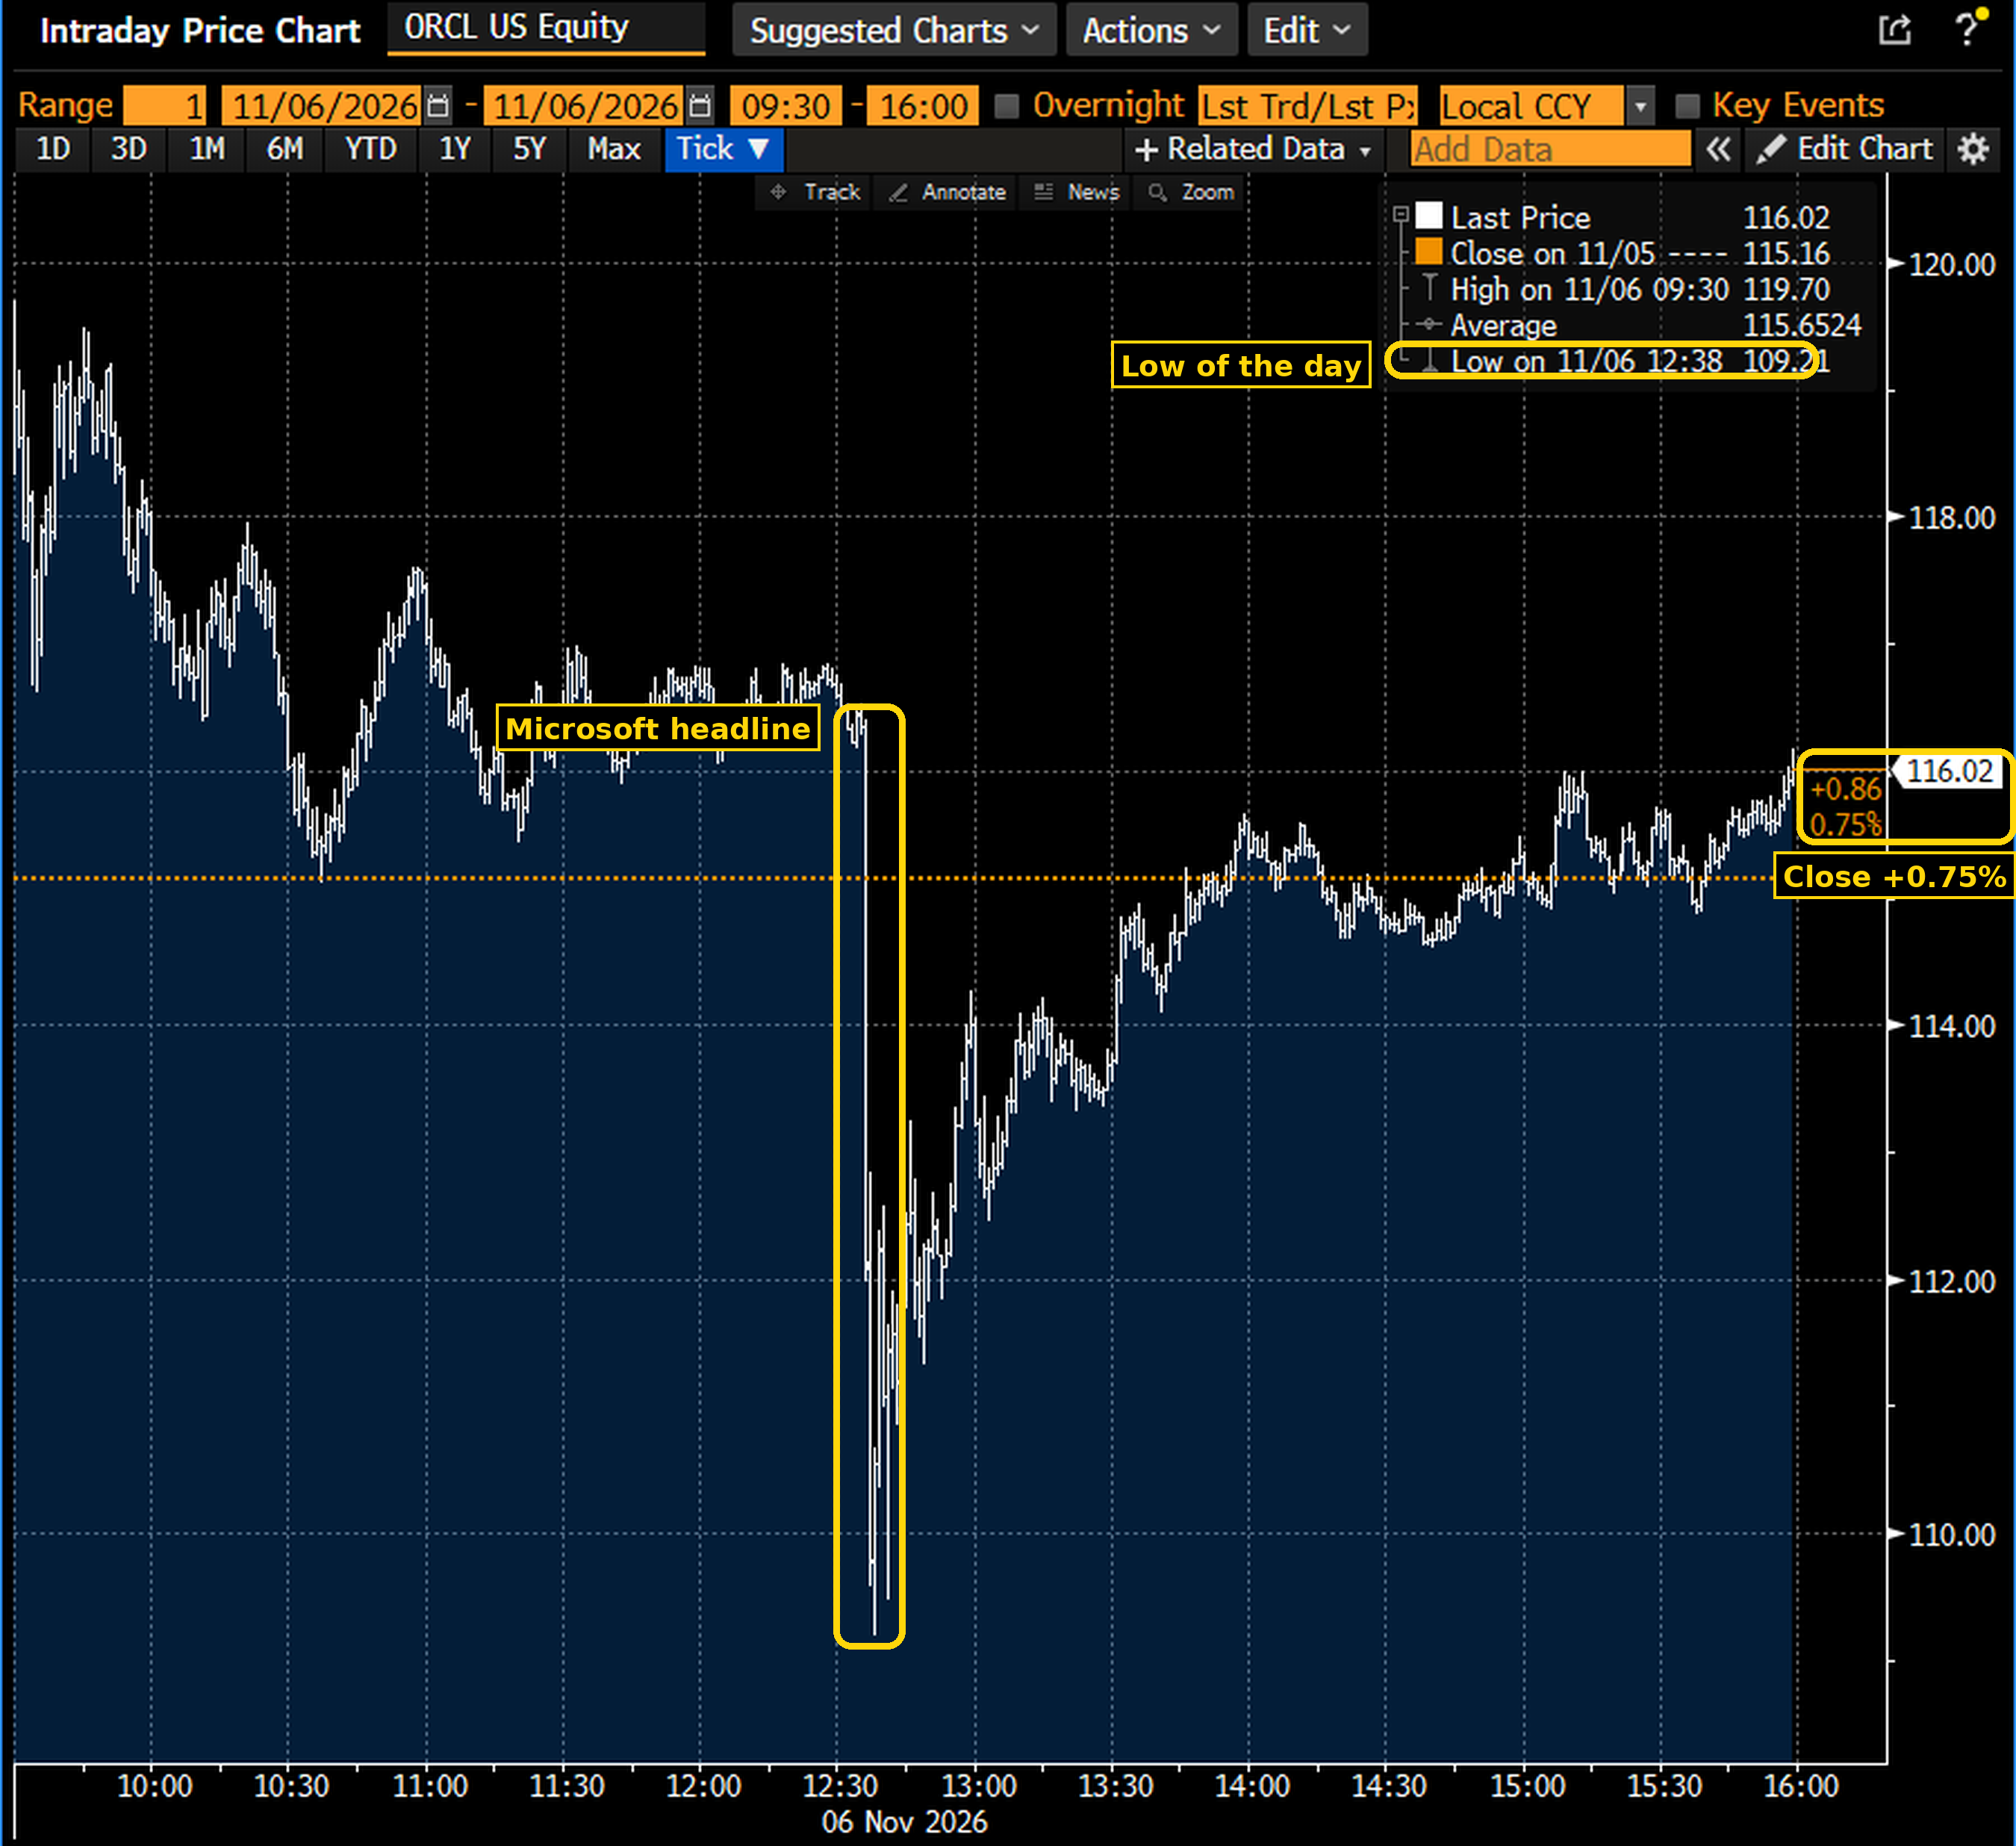
The market reacted at once, then hesitated. Oracle fell to $109.21 at 12:38 pm, 5.2% below Thursday's close of $115.16. By the close it was back near $116, up about 0.8% on the day and still down 11.2% on the week. Microsoft closed down 1.0%. Options now price a move of about 10.6% for Oracle and 5.0% for Microsoft by November 20, the expiry that follows Nvidia's report.
The risk sits with whoever owns the chip when the contract ends. In The AI Depreciation Bomb I wrote that hardware "loses its value in steps, every time a new generation arrives." I also quoted Microsoft's chief financial officer, who said in January that a lot of the GPUs Microsoft buys are already contracted for most of their useful life. That protects Microsoft and moves the risk to its tenants. Friday showed the mirror image. When Microsoft is the tenant and has the choice, the owner of the hardware keeps the obsolescence. On September 25, after Oracle's force majeure notice on its New Mexico campus, I called it in The Crash Fuse Is Lit "the first real test of what an AI lease is worth." Friday was the second test, from the other side of the lease.
Old chips do find users, but not the most demanding ones. Oracle's answer, that demand stays strong even for earlier-generation GPUs, is Steve Eisman's point, which I cited on Thursday: older chips keep finding users. But as we argued on October 4 in AI inference has a floor, and it is priced in watts, the marginal cost of a token is dominated by electricity. An older chip needs more power for each token, which is why it loses value even while it still works.
For the Nasdaq, the question now is not Oracle alone. It is which other leases of older chips come up for renewal next, and at what price, and the next two weeks of reports are where the answer starts. On October 25 I recalled my verdict of October 13: the next phase would come "through credit. The indices will see it last." This week, the indices saw it.
Will the stock market crash again next week?
The sequence I watch is simple: a break below 26,600, Thursday's low, then below 26,000, where dealers are shortest gamma. Besides the reports above, three moments can start it, in New York time:
The weekend. The Middle East, where talks between Iran and the United States resumed through Qatar while tanker fires were reported near the Strait of Hormuz. Then Asia on Monday morning: Japan's Nikkei and Taiwan's benchmark entered bear markets on Friday, joining Korea.
Tuesday, November 10. October CPI at 8:30 am, the 10-year Treasury auction at 1 pm, CoreWeave after the close. Brent spent most of October above $100 a barrel, before this week's drop. A hot print would support a Fed hike on December 9, and equity weakness would then bring no rate relief. This is the most credible trigger of a black week.
Friday, November 13. Weekly options expire, with a straddle of about 3.8% on the Nasdaq 100.
Wednesday is Veterans Day: the bond market is closed, stocks are open. And every day, watch Oracle and CoreWeave credit default swaps, the price of insurance against their default.
Levels to watch on the Nasdaq 100
28,340 to 28,590: dealer gamma turns positive. Above it, the bounce becomes credible.
27,250 to 27,270: the call wall of short-dated options.
26,990 to 27,050: Friday's close and pivot.
26,725: QQQ 650, the largest put strike.
26,606 to 26,630: Thursday's low and close.
26,000 to 26,300: dealers at their shortest gamma.
25,850: the acceleration zone on our terminal.
24,670: QQQ 600, the next large put strike.
The rest of the market in five lines
Rates: the US 10-year yield fell from 4.93% to 4.86% on the week. On Thursday it fell about 6 basis points while stocks crashed. On October 18 I wrote that "AI specific sessions behave differently: on those days, yields fall with stocks." Thursday was one of them, and Friday's strong jobs report barely moved yields.
Oil: Brent lost 13.3% on the week, to about $98, and WTI 12.8%, to about $91.
Gold: up 4.5%, to about $4,075 an ounce on the December future.
Dollar: the dollar index rose 0.4% to 102.3, the euro slipped 0.3% to 1.116 and the yen traded near 158.5 per dollar.
Asia: Japan and Taiwan in bear markets, Korea already there. The selling started in US AI stocks and spread to the Asian supply chain.
What would prove me wrong
A close above 27,270, then above 28,340 to 28,590. Dealers would stop amplifying moves and start damping them.
Reassuring reports. If CoreWeave, Nebius and Nvidia reassure on renewals and orders, volatility falls further and the dealer support that lifted Friday keeps working for the bulls.
A soft CPI on Tuesday. It would take the December hike off the table and remove the most credible trigger.
The volatility sellers. On Thursday, put sellers dominated the flow in 62,022 QQQ November 20 puts at the 650 strike and 27,156 December puts at the 630 strike. If they are right, front-end volatility collapses and the bounce extends.
History. Three months after a bounce like Friday's, the median return was plus 13.8%, and the index was higher in 18 of the 25 cases since 1985.
Bottom line
Friday's bounce has the features of a dead cat bounce: narrow, faded, mechanical, unconfirmed by dealers, and used by option buyers to add protection. I put the odds of a retest of 26,600 by next Friday at 60% to 65%.
The bigger risk is what happens next. Between Tuesday and November 20, the AI rental chain reports link by link: CoreWeave, Nebius, Cisco and Applied Materials, then Nvidia three days before the monthly expiry, just after Microsoft let rented Oracle capacity go. The market walks into it with dealers short gamma, leveraged ETFs that sell every down day, trend followers already short on two horizons, hedge funds caught long, and no Fed in sight. A black week remains the tail rather than the central case: options give it about one chance in seven, history about one in four after a bounce like Friday's, and only in crises already underway. But this time the tail has a date.
For an options trader, the structure of prices is clear. One to two-week volatility is the cheap part of the surface, below what the index is actually delivering. The crash wing is the expensive part. A put spread, buying a put near 25 delta and selling one near 10 delta, buys the cheap part and sells the expensive one. That is a description of option prices, not a recommendation.
The Microsoft and Oracle story tells us something larger than one session. The real risk of the AI cycle, how long the chips keep their value, has started to show in contracts. In the next two weeks it will show in earnings, then in credit, before it shows in the indices.
FAQ
What happens after a stock market crash? Since 1985, when a one-day fall of 5% or more in the Nasdaq 100 was followed by a bounce of at least 1%, a new closing low came within a week in 40% of cases. Three months later the index was higher in 18 of 25 cases, with a median gain of 13.8%, and the black weeks all came inside crises already underway.
Why did the Nasdaq crash on November 5, 2026? The Nasdaq 100 fell 6.36%, its worst day since March 2020. The market read the Democratic sweep of the midterms as a threat to the data center build-out, through local moratoriums, and crowded hedge fund positions in AI stocks were forced out. Semiconductors fell 12.3%.
Is Friday's rebound a dead cat bounce? On this week's evidence, probably: it was narrow, it faded, it came from dealer hedges unwinding as volatility fell, and option buyers used it to buy protection. The test is simple: a close back below Thursday's 26,630.
Will the stock market crash again next week? Nobody knows. Options price about a 14% chance that the Nasdaq 100 falls 5% or more by next Friday, and history about one in four after a bounce like Friday's. The most credible triggers are the October CPI and CoreWeave's results on Tuesday, then Nvidia on November 17.
Why did Oracle stock fall on November 6, 2026? Bloomberg reported that Microsoft is winding down an arrangement to rent AI computing capacity from Oracle. Oracle fell as much as 5.2%, to $109.21, then recovered to close up about 0.8%, and says demand for its AI infrastructure remains strong.
This article is for educational purposes only. It is not investment advice and not a recommendation to buy or sell anything. Past moves do not predict future ones. Options and futures carry a high risk of loss, and leveraged products can lose more than the amount invested.
How to cite: Djellal Djouad, CrossVol Research, "Stock Market Crash: What Happens Next, From a Dead Cat Bounce to the AI Bomb", 6 November 2026. https://newsletter.crossvolresearch.com/p/stock-market-crash-what-happens-next-nasdaq
On the landlords' side, two filings worth having open before the prints. Oracle capped new capital through FY30 at $20B at its October 28 Investor Day ($10B equity, $10B gross debt, refinancing excluded), and its November 4 8-K shows it used all of it within a week: 86.2M shares at about $116 and $10B of notes at 7.000% to 8.650%. Nebius's 2025 20-F shows one unnamed customer at 83% of year-end receivables and its largest customer at 25% of revenue, so one tenant's decision moves a lot there.
For Thursday, our model has Nebius Q3 revenue at $934.5M against a $904.8M consensus: https://equibles.com/research/nebius-group-nbis-q3-2026-earnings-preview-and-forecast
One number that sharpens the landlord risk: Oracle's latest 10-Q (quarter ended Aug 31) shows $28.5B of capex against $23.1B of operating cash flow, roughly $5.4B of negative free cash flow, with about $125B of senior notes and $664B of remaining performance obligations. That backlog is what the market is now questioning, which is why one tenant walking away from capacity hits so hard.