


By Djellal Djouad
A risk reversal skew is the difference between the implied volatility of a 25-delta call and the implied volatility of a 25-delta put on the same underlying and tenor. When that number is negative, the put is richer than the call, and the market is paying up for downside protection relative to upside.
This piece is about the risk reversal as a skew gauge, not the risk reversal as an option strategy. Traders use the same two words for two different things. The strategy is a position, typically long an out-of-the-money call financed by a short out-of-the-money put. The metric is a single number that summarizes the shape of the volatility smile. Here we own the metric: what it measures, how to read its sign and its term structure, and what a real set of numbers tells you about fear and greed.
What Is a Risk Reversal (as a skew measure)
As a skew measure, the risk reversal is defined cleanly:
RR = (25-delta call IV) minus (25-delta put IV)
Both legs are quoted at the same expiry and expressed in volatility points. The 25-delta convention picks strikes that sit a comparable distance out of the money on each side, so the two implied vols are directly comparable. Subtract one from the other and you get a scalar that captures the asymmetry of the smile.
The sign is the whole story at first glance. A negative risk reversal means the put IV is above the call IV. That is put-rich, and it describes downside skew: the market charges more, in vol terms, to insure against a fall than to chase a rally. A positive risk reversal means the call IV sits above the put IV. That is call-rich, or upside skew, and it is far less common in single-name equity and in most indices, though it shows up in commodities, certain growth names, and takeover situations.
Because it is a difference of two vols, the risk reversal strips out the overall level of implied volatility. A name can have a 45 vol and a name can have a 20 vol, and both can print the same minus 3 risk reversal. That is what makes the metric useful for comparison across underlyings: it isolates shape from level.
How to Read It: Sign, Size, and Term Structure
Three things matter: sign, size, and how the number behaves across tenors.
Sign tells you which side is bid. Negative equals put-rich, positive equals call-rich. Almost every equity index carries a negative risk reversal because crashes happen faster than melt-ups, and everyone who is long stock is a natural buyer of downside protection.
Size tells you how steep the skew is. A risk reversal of minus 0.7 is shallow. A risk reversal of minus 6 is steep and reflects real demand for tail protection or a supply imbalance from structured product hedging. Relate the risk reversal back to the put skew itself, which is the 25-delta put IV minus the ATM IV. The put skew measures how far the downside wing lifts above the belly of the smile. The risk reversal then compares that lifted put wing against the call wing. A steep put skew with a lifeless call wing produces a deeply negative risk reversal.
Term structure is where most readers stop too early. Compute the risk reversal at 30 days, 90 days, and 180 days and you get a skew curve through time. Front-end skew reacts to near-dated event risk and to gamma demand, so it can be shallow when nothing is scheduled. Back-end skew tends to be steeper because longer-dated puts carry more of the priced-in tail and more of the hedging flow from long-horizon protection buyers. A risk reversal that grows more negative as tenor extends is steepening into the back end. One that flattens toward zero at longer tenors is telling you the fear is short-dated and event-driven.
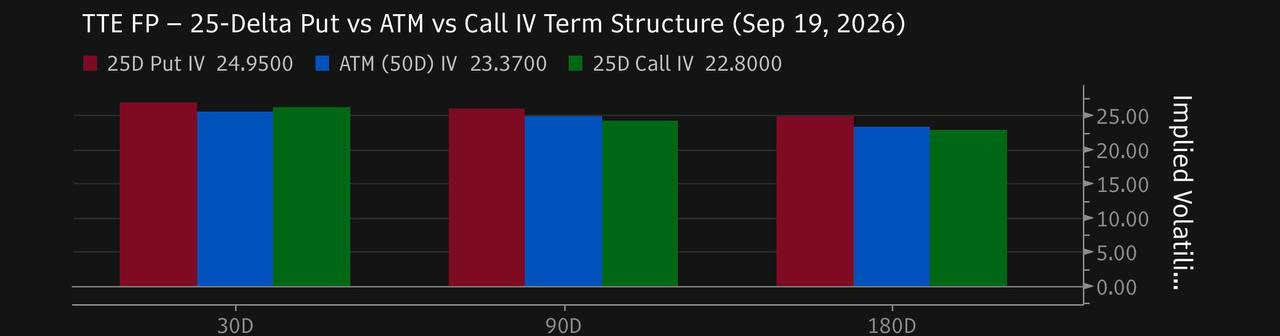
A Worked Example
Take an oil major single name. Read its 25-delta risk reversal across the curve:
30-day risk reversal: minus 0.71
90-day risk reversal: minus 1.90
180-day risk reversal: minus 2.15
The front end is barely skewed. A minus 0.71 at 30 days says the near-dated put wing is only marginally richer than the call wing. There is no scheduled shock the market is pricing hard in the next month, so the short-dated smile is close to symmetric. That is a shallow front-end put skew.
Move out to 90 days and the risk reversal nearly triples in magnitude to minus 1.90. By 180 days it reaches minus 2.15. The skew steepens into the back end. Longer-dated puts are being bid up relative to longer-dated calls, which is the market saying its asymmetry concern is structural and horizon-driven rather than a single event next week. For an oil name, that back-end downside bid often reflects the fat left tail of the commodity and the hedging of long-dated income and structured exposure.
Now contrast with a call-rich name whose 25-delta risk reversal prints positive at plus 5.26. Here the call IV sits more than five vol points above the put IV. The smile leans the other way. Buyers are paying up for upside, not downside. That is a greed signature: a squeeze candidate, a takeover rumor, a commodity in backwardation, or a crowd chasing convex upside. The put wing is comparatively cheap because few holders feel the need to insure a name they expect to keep grinding higher.
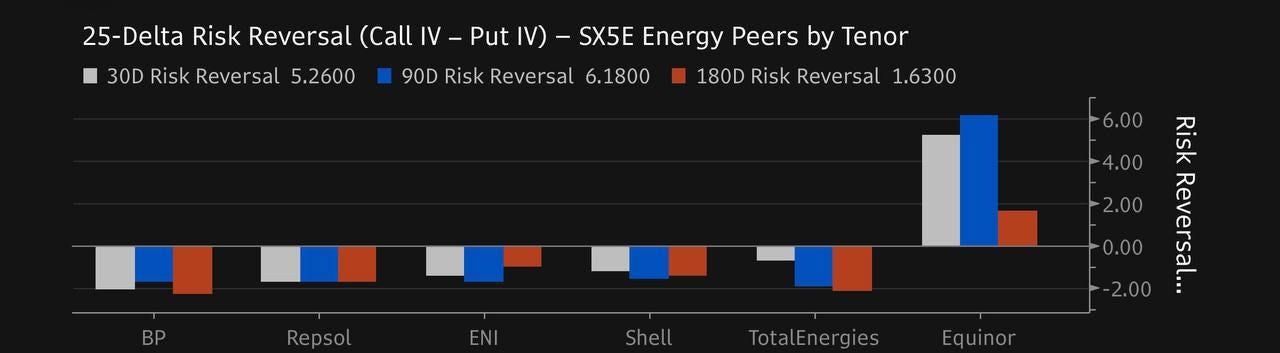
Side by side, the two profiles say opposite things. The oil major with a steepening negative risk reversal is a market pricing patient, growing downside asymmetry. The plus 5.26 name is a market pricing upside asymmetry, where the fear is missing the rally rather than eating the drop.
Why It Matters
The risk reversal is priced asymmetry made into a single number, and that has practical uses.
First, it is a fear and greed gauge that is harder to fake than sentiment surveys. It is real money committed in the options market, expressed in vol terms and cleaned of the overall vol level. When a name's risk reversal grows more negative, protection is getting expensive relative to upside, which is information whether you are hedging or fading.
Second, it flags normalization risk. Skew, like vol, mean-reverts. A risk reversal stretched to an extreme can snap back, and that move alone changes the mark on any skew-sensitive position even if spot does nothing. If you are short downside puts to harvest that rich skew, a normalization can help you, while a further steepening can hurt before spot ever moves.
Third, it prices hedging cost directly. A steep negative risk reversal means collars and put spreads are expensive to put on because the puts you buy are rich and the calls you sell to finance them are cheap. Reading the term structure tells you whether to hedge short-dated, where skew is shallow, or long-dated, where it is steep.
Fourth, it drives relative value across names. Because the metric isolates shape from level, you can rank a peer group by risk reversal and spot the one name that is mispriced against its sector. The call-rich outlier in an otherwise put-rich group is exactly the kind of dislocation that shows up on a screen sorted by 25-delta risk reversal.
Related CrossVol Research
For a full walk through skew on an oil major, read Energy Vol: TotalEnergies Skew and the Back-End Put Bid, which applies this exact framework to a live name.
To see how dealer positioning interacts with skew and spot, explore the CrossVol gamma exposure (GEX) research, where priced asymmetry and hedging flow meet on the tape.
FAQ
What is a risk reversal in options?
The term has two meanings. As a strategy, a risk reversal is a position that is long an out-of-the-money call and short an out-of-the-money put, or the reverse. As a metric, it is the 25-delta call implied vol minus the 25-delta put implied vol, a single number summarizing skew.
Is a risk reversal the same as skew?
Not exactly. Skew is the general shape of the implied volatility smile across strikes. The risk reversal is one specific summary of that skew: the difference between the 25-delta call IV and the 25-delta put IV. It captures the wing-versus-wing asymmetry in one clean, level-independent number.
What does a negative risk reversal mean?
A negative risk reversal means the 25-delta put implied vol is higher than the 25-delta call implied vol. The market is paying more, in volatility terms, for downside protection than for upside exposure. This is put-rich, downside-skewed, and normal for equity indices and most single names.
How do you read a 25 delta risk reversal?
Check the sign first: negative is put-rich, positive is call-rich. Then check the size for steepness, comparing it to the put skew above ATM. Finally read it across 30, 90, and 180 days to see whether the skew steepens into the back end or flattens toward the front.
Djellal Djouad
Further reading