


The VIX closed the week at 15.31. On its own that number says nothing is wrong. Equity vol is low, range bound, and as calm as it has been all autumn. If the VIX were the only instrument on the desk you would conclude the market is comfortable with multi decade high yields, a fresh war front in the Middle East, and 119bn dollars of Treasury supply landing in five sessions. It is not comfortable. It is just looking in the wrong place.
The signal this week is not in equity vol. It is everywhere else. The MOVE index sits at 107, up almost 47 percent in a single month, and VXTLT confirms it with a 49 percent jump of its own, so this is not a MOVE anomaly, it is the whole long end repricing. VSTOXX and VDAX are both up around 20 to 23 percent, spiking to 20.7 and 20.1 on the first of October. One month euro and sterling implied vol surged from the 22nd of September, 28 percent on EURUSD and 18 percent on GBPUSD. Only one major vol surface on the board did not move, and it is the one everyone quotes. Volatility is starting to talk. Most people are listening to the single index that has nothing to say.
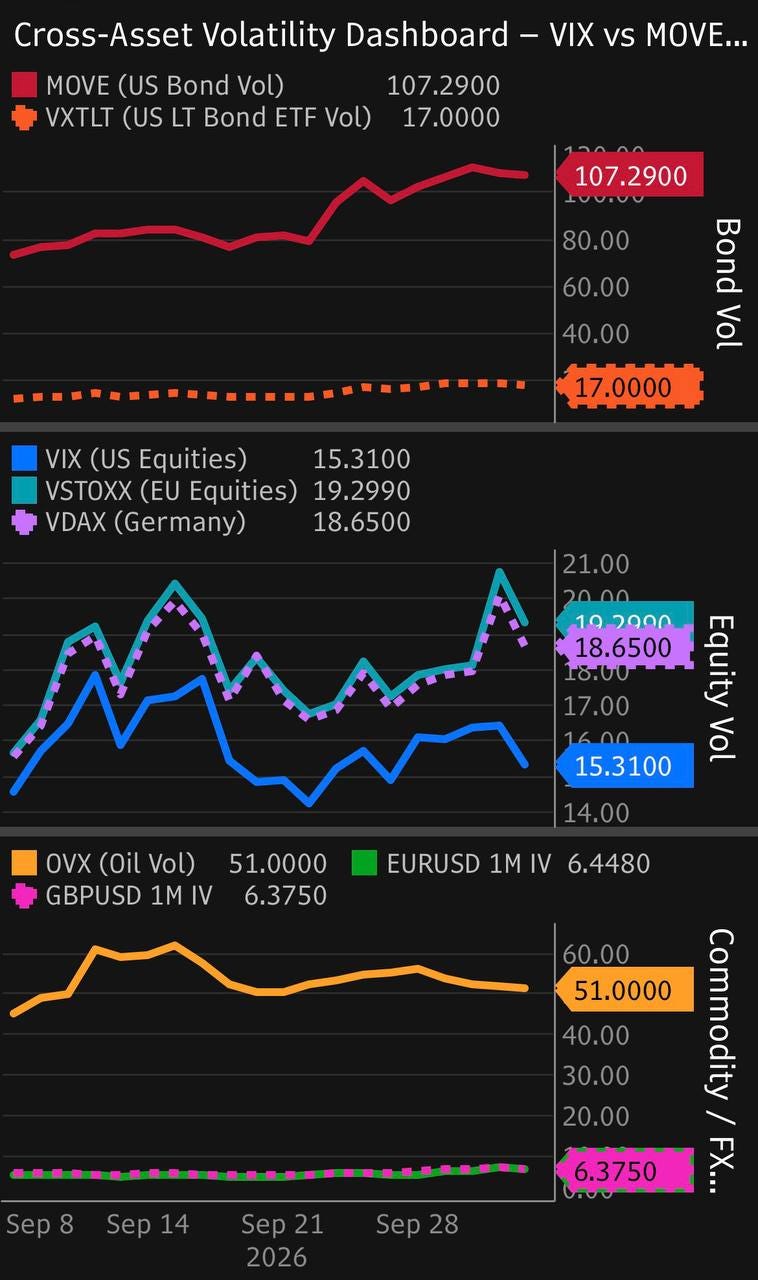
The ratio flags it, the composite confirms it
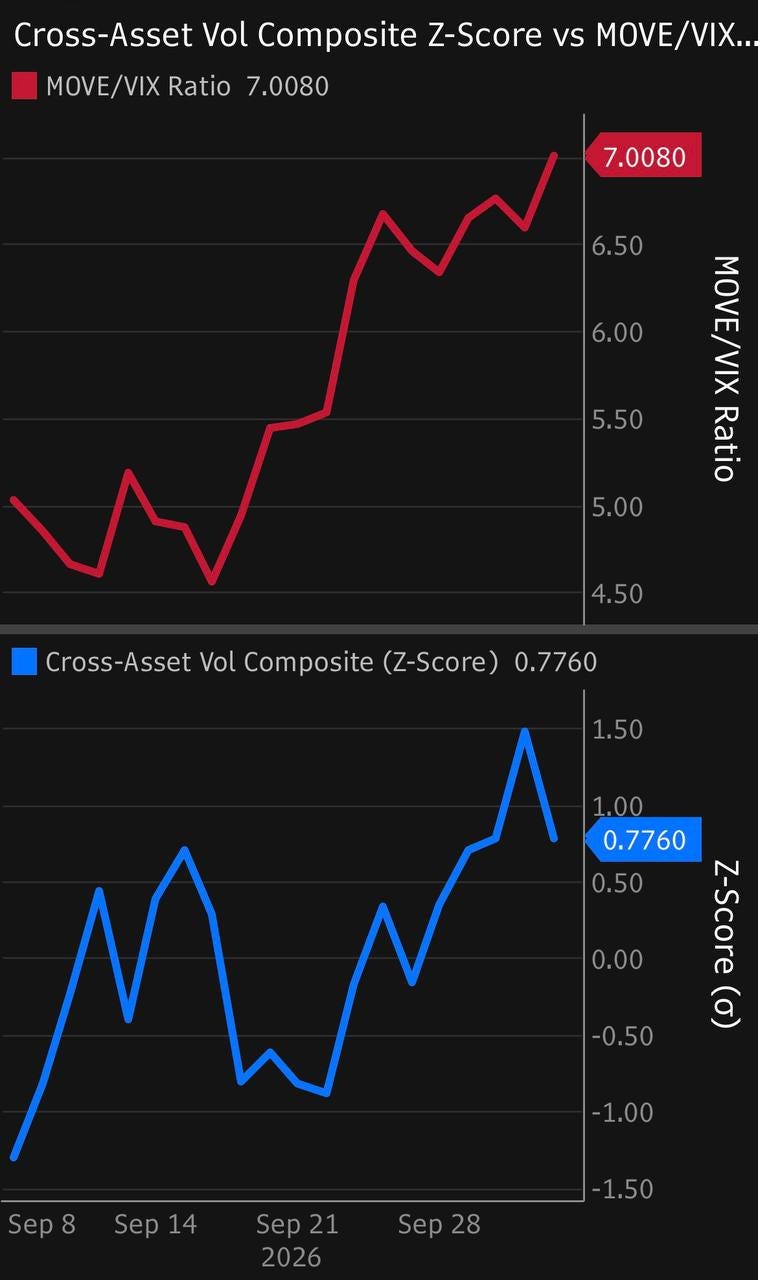
The quick way to see the divergence is the MOVE over VIX ratio. It went from 5.0 to 7.0 in a month, a 39 percent widening, and 7.0 is a cycle high. That tells you bonds are stressed relative to stocks. It is a real signal, but it is a bilateral one. It cannot tell you whether this is a rates only event or something broader, because it only looks at two surfaces.
So we track a cross asset vol composite instead. It is an equal weighted average of the z scores of eight vol series, VIX, MOVE, VSTOXX, VDAX, VXTLT, OVX, and one month EURUSD and GBPUSD implied vol, each normalized to its own trailing mean and standard deviation. A reading of zero means everything sits at its own average. Positive means broad based stress.
The path through September is the whole story. The composite started the month at minus 1.30 on the 4th, every vol suppressed at once, the false calm. It poked positive to plus 0.70 on the 15th when oil and European equity vol jumped on the energy shock. Then it fell back to minus 0.88 on the 22nd as equity and FX vol briefly compressed. That is the important moment. The MOVE over VIX ratio alone would have kept flashing stress through that dip, and it would have been wrong, because the stress was not yet broad. The composite got it right by staying negative.
From the 23rd it turned. By the 1st of October the composite hit plus 1.48, the high of the month, as MOVE, VXTLT, VSTOXX, and euro and sterling vol all spiked together. That simultaneity is the signal the ratio cannot give you. It is the kind of co movement that historically shows up before forced de risking and liquidity events, not just a rates repricing. The slight pullback to plus 0.78 on the 2nd is partial mean reversion in FX and equity vol, not an all clear. We enter the week with the composite still well above average and the ratio at a cycle high. That is a fragile base, not a calm one.
Why rates vol is screaming
The driver is not a mystery. Ten year yields are at 5.30 percent and the thirty year is at 5.65 percent, the highest since 2007. Into that you drop the supply gauntlet. The Treasury brings 58bn in threes on Tuesday, 39bn in tens on Wednesday, and 22bn in thirties on Thursday. 119bn in a single week, at the cheapest levels in nearly two decades, with sentiment on government bonds already fragile and swap spreads at risk of widening.
This is where last week ties into this one. The soft September payroll let the market price out the urgency of follow up hikes, and that was supposed to be the relief. It was not, because the back end does not trade on the next labor print. It trades on supply and term premium, and both are pushing the wrong way. We argued through the week that the durable buyer of this duration is the liability matcher, the pension running LDI that buys because yields are high rather than in spite of it, with the Milliman 100 funded ratio north of 114 percent. This week is the live test of that thesis. The 119bn of supply either gets absorbed by real money into the auctions, which caps the move, or it does not, which lets term premium win and keeps the bid for protection alive. Watch the ten year and thirty year auction tails on Wednesday and Thursday. They matter more than the minutes.
Europe is pricing it louder
VSTOXX and VDAX up 20 plus percent with spikes near 21 is not a US story imported. Europe has its own compounding risk and it is pricing it honestly, because the backdrop is genuinely stagflationary. Growth is running near 0.9 percent this year, down from 1.4, with inflation still around 3 and the region a whisker from a technical recession in the second quarter. Energy inflation at 9 percent year on year is the tax underneath all of it, with Brent above 100 and the oil to equity correlation deeply negative since the US Iran conflict began, so higher crude is a direct headwind for European equities rather than a rotation. Into that the ECB hiked again in September and is shrinking its balance sheet, adding sovereign supply to a market that has to absorb it without the old spread compression tailwind. October odds have been trimmed to around 20 percent, but a December hike is still live.
The credit tape makes the stress concrete, and the timing is the tell. The iTraxx Main widened 26 percent in a month and Crossover 16 percent, and both peaked on the first of October, the exact day the cross asset composite hit its plus 1.48 high. That synchronicity is the point. Credit did not wobble on its own idiosyncratic story, it moved in lockstep with the whole vol complex. Euro AT1 spreads widened 12 basis points last week with yields at 6.25 percent, the highest since March. The FX channel is live too, with EURUSD down 3.1 percent on the month to its weakest since May 2025 and one month euro vol up 28 percent, peaking at 6.96 on the first, while EURCHF at 0.9326 edges toward the level where the SNB starts to matter.
France is the epicenter
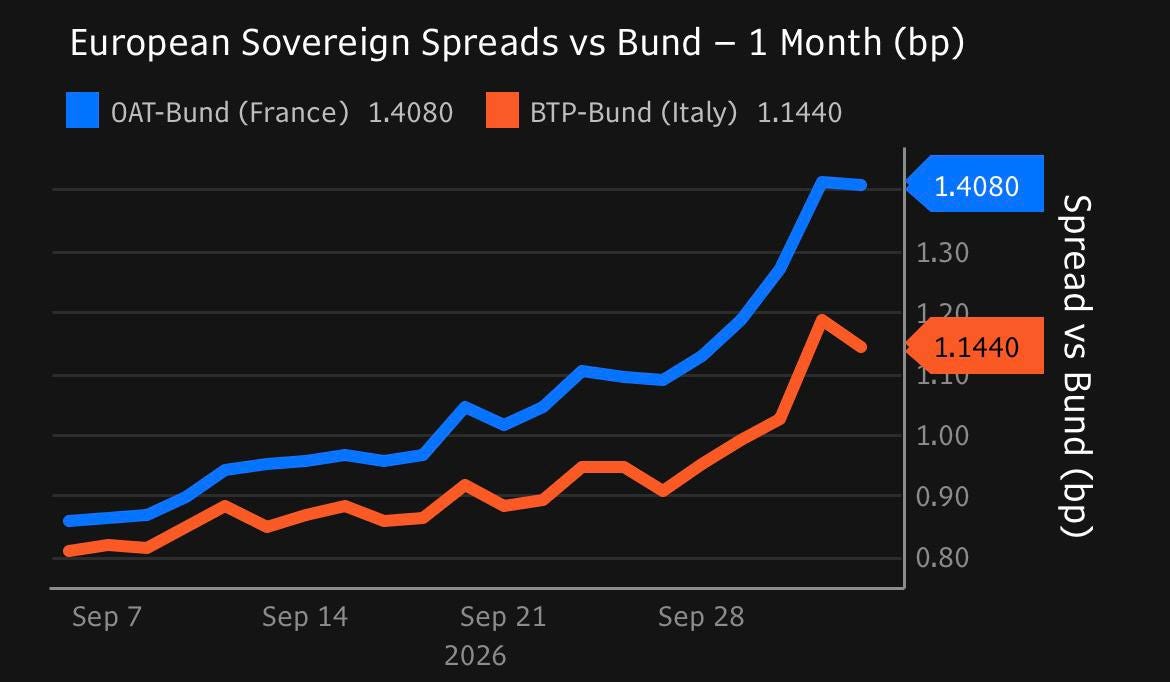
The single most acute idiosyncratic risk in Europe is French government debt. The OAT Bund spread has gone from 86 basis points on the fourth of September to 141 on the fourth of October, 65 basis points of widening in a month, back toward euro crisis peaks. It is not a rates move dressed up as a spread. The French ten year rose 67 basis points on the month against Germany's 12, so this is France specific. You can see it in the plumbing. French banks and large corporates are now issuing below their own sovereign, which is what acute stress looks like, the CDS redenomination spread is back at 2017 levels, and liquidity has thinned. The ratings are already AA3 and A plus with a negative Moody's outlook, the 2027 budget and election are the overhang, and QT has left France leaning more on foreign buyers, which makes the yield more sentiment driven, not less. The hierarchy has even inverted, with the Italian BTP Bund spread at 114 now sitting inside the French 141, something that would have read as a typo a year ago.
Underneath, the banks are the forward worry rather than the current one. The average euro area NPL ratio is still a benign 1.8 percent, but the guidance is unanimously deteriorating, French NPLs are rising on soft consumption and construction refinancing, and lending standards are tightening at a historically aggressive pace. Put the five fronts together, stagflation, France, credit repricing, a banking book that is turning on a lag, and a weakening euro that enlarges the energy bill and narrows the ECB's room to pause, and the one hedge that works across all of them is European energy, the only sector where this scenario is a tailwind.
The crack in credit
The number that deserves more attention than it is getting sits at the bottom of the quality stack. The CCC segment of US high yield is trading at distressed levels for the first time since the 2023 banking crisis. Distress at the junkiest end does not stay contained by itself. It is where the next credit hammer tends to fall first, and it is doing this while equity vol prices nothing. A VIX at 15 and CCC at distressed is not a stable pair.
Positioning is the accelerant
The dangerous part is not the catalysts. It is who is holding what into them. Discretionary investors are at the bottom of their long run sentiment range, already defensive. Systematic strategies are doing the opposite, adding equity exposure precisely because realized vol has been low. That bifurcation is the fragility. Low vol pulls the systematic community long, and a vol spike forces that same community to sell into a market the discretionary side has already stepped back from. The fuel and the match are in the same room.
Underneath, momentum has posted three straight weeks of gains and S and P dispersion is grinding lower. In rates, SOFR options price two live paths, one more hike then a long hold, or a drift back toward 5.125 with little easing after, and an October hike is now more likely than not, with the September CPI on the 14th the input that settles it. In FX the defensive posture is already on, long dollar, deeper short euro and sterling, the yen flipping hard from short to long on normalization and intervention risk, and EM carry longs starting to moderate as higher for longer raises the cost. In commodities, WTI open interest is around 276 thousand contracts, gold cannot hold gains even after softer core PCE because the strong dollar and high real yields pin it, and metals are the only major group at a new high this year, doing it straight into a ten year above 5 percent, with copper carrying the same pump then dump risk that already played out in gold, silver, platinum and iron ore.
Where the spike lands
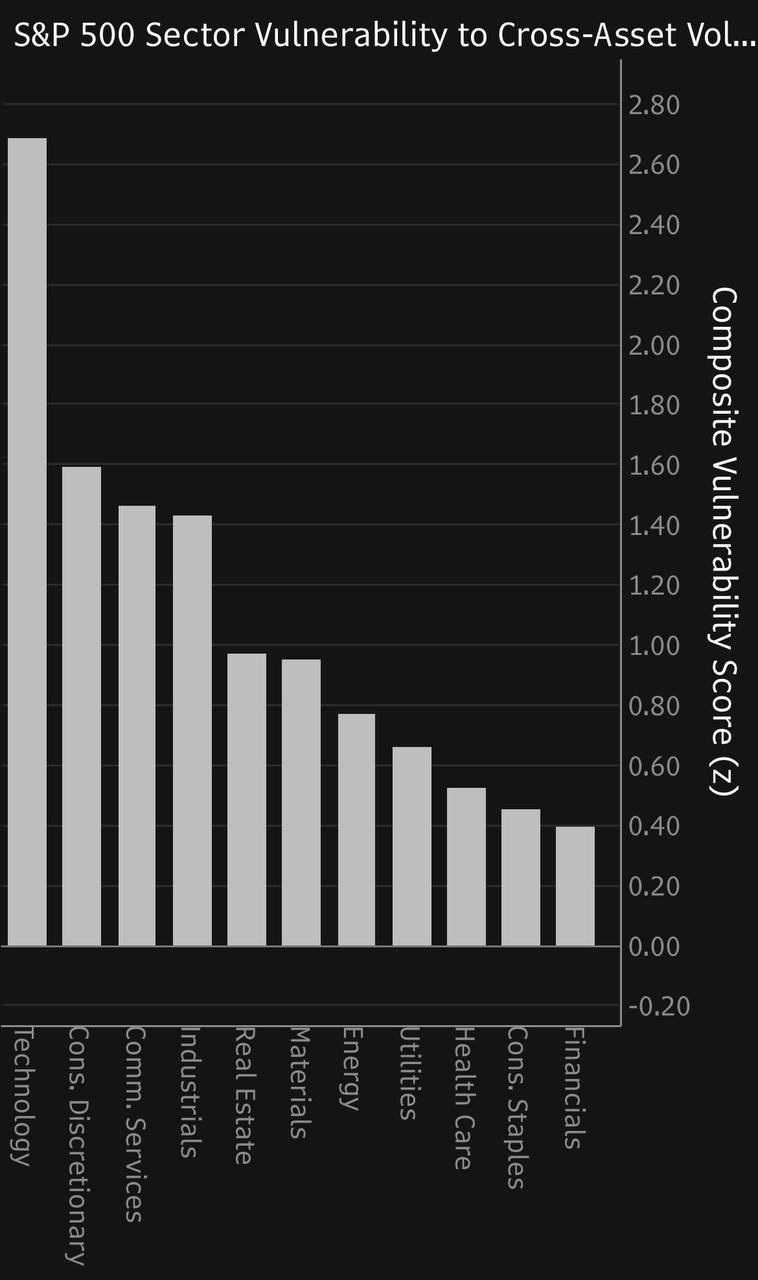
If the composite pushes back toward plus 1.5, the damage is not evenly spread, and the sort is almost entirely about duration and beta. Rank the S and P sectors by exposure to a further composite spike and Technology sits at the top by a wide margin, with the highest beta at 1.50, the second longest equity duration at 22.5 years, and a dividend yield of 0.42 percent, a 488 basis point deficit to the ten year. That is the long duration growth trap in one line. Every leg higher in real yields compresses the present value of its cash flows more than anything else in the index, which is why semis led the drawdown on a vol adjusted basis the last time the ten year pressed 5 percent in 2023. Consumer Discretionary is next, high beta at 1.21 and directly in the path of the oil to consumer squeeze with Brent above 100. Communication Services follows, carrying the widest credit spreads in the index, up 25 basis points this year, so the bond market is already writing stress into its capital structure. Industrials round out the high exposure group on duration and energy pass through.
The sleeper is Real Estate. It has the longest duration in the index at 23.7 years and is already down 7 percent in the third quarter with spreads widening, so it does not need much to extend the move. The other side of the ledger is Energy, and it is the one place a composite spike is a tailwind rather than a threat. Its beta to the S and P is negative at minus 0.36, so a composite driven by rates and geopolitics tends to push oil and the energy sector higher while it drags everything else down. The defensives behave as you would expect, Staples near zero beta, Health Care the cleanest hedge on growth weakness, and Financials shielded by the lowest implied vol and the shortest duration in the index, with net interest margin offsetting part of the rate drag.
What matters this week
Three catalysts sit above the rest. The 119bn of Treasury supply is the most mechanical, and the auctions will tell you whether the duration bid is real. The Fed and ECB minutes on Wednesday and Thursday are the second, parsed for any hawkish residue now that hike urgency has faded. The fresh Middle East escalation is the third, with Yemen launching a full operation against Houthi areas on the 4th and OPEC plus holding November output unchanged, keeping supply tight into the risk. Around those, ISM Services on Monday, China back from Golden Week on Thursday with USD CNH as the pressure valve, and the University of Michigan five year inflation expectation on Friday.
Put it together and the composite does the summarizing for us. It enters the week at plus 0.78 with the MOVE over VIX ratio at a cycle high of 7.0, which is a market already stretched before a single catalyst lands. An auction tail, a hawkish line in the minutes, or another leg in the Middle East pushes the composite back toward plus 1.5 and beyond, and that is the zone where stress stops being a rates story and becomes a cross asset one. The VIX will be the last to admit it. When it finally does speak, it will not be adding new information. It will be catching up to what the rest of the vol complex has been saying all month.
This article is for educational purposes only. It is not investment advice, a solicitation, or an offer to buy or sell any security or derivative. Options, futures and leveraged products carry a high risk of loss.
$TLT $XLK $XLY $XLRE $XLE $SPY
Data: Bloomberg.
Which one cracks first, Djellal — the spread or the index?
You're right the VIX hears it last: rates, credit and the euro repriced weeks ago while it napped at 15. Vol never warns early — it closed at 9 in November 2017, then 37 by early February.
The tape that matters already knows.