


By Djellal Djouad
Data as of Friday, September 25, 2026.
I smell smoke.
On Thursday, September 24, Oracle sent a force majeure notice to the developer of Project Jupiter, the AI data center campus it is leasing in New Mexico. Oracle is not walking away. It is protecting its right to defer rent if the campus misses its planned 2028 opening. By Friday, Oracle's five year credit default swap was at 237 basis points, 51 more than two weeks earlier. The roughly $18 billion of loans on the campus had already been quoted at 89 to 91 cents on the dollar on September 18, six days before the notice. ARM, the collateral behind SoftBank's $25 billion margin loan, had lost 6.7% in two sessions. Japan's Financial Services Agency said it was stepping up scrutiny of how the country's biggest banks and life insurers finance AI data centers, with a focus on US projects. And the US Treasury Secretary spent the same Friday telling the world that the yen should be stronger.
Each of those facts has a story of its own. Put them next to each other and you get a fuse. Japan is the largest foreign holder of US Treasuries, a lender to US data centers through private credit, and SoftBank's home market. Japanese and Taiwanese insurers hedge only 41% of their foreign currency exposure. Washington wants the yen higher. Oracle wants more time. The quarter ends on Wednesday.
I have been following this fuse since the spring. In May, the CrossVol Research book I co-authored called Oracle "the acute case, and the one to watch as a leading indicator". In June, my paper on private credit mapped a convergence window that "opens in Q3 2026". In August I wrote here that "this time the fuse runs through AI capex financed by debt". The receipts, with dates and links, are further down.
This note started as a simple trade on the Treasury curve. Every time I asked what could go wrong, the answer led to the same place. I am publishing the whole chain, with the numbers I pulled from Bloomberg this week and corrected where my first pass was wrong, because the people who most need to read it are marking their books this weekend.
Two warnings up front. To risk managers: the party is already over, your marks just have not heard it yet. To investors: the last chart in this note shows the S&P 500 earning 1.39 points less than a 10 year Treasury. The party is over there too.
It Started With a Belly Trade
A tweet this week made the case for the belly of the Treasury curve. Real yields near 2.7% on the 5 and 7 year. A position that makes 10% if yields fall 1% and loses nothing if they rise 1%. Payoff ratios of 1 to 7.5 on the 10 year and 1 to 3 on the 20 year. I answered it with the math, starting with the inputs.
The inputs were close in the belly and wrong at the front. Against Bloomberg's curve for September 24, the curve I first worked from understated the 2 year by 35 basis points and the 1 year by 13, which matters for any carry or roll analysis anchored at the front end. From 3 years to 30 years, it was within 7 basis points.
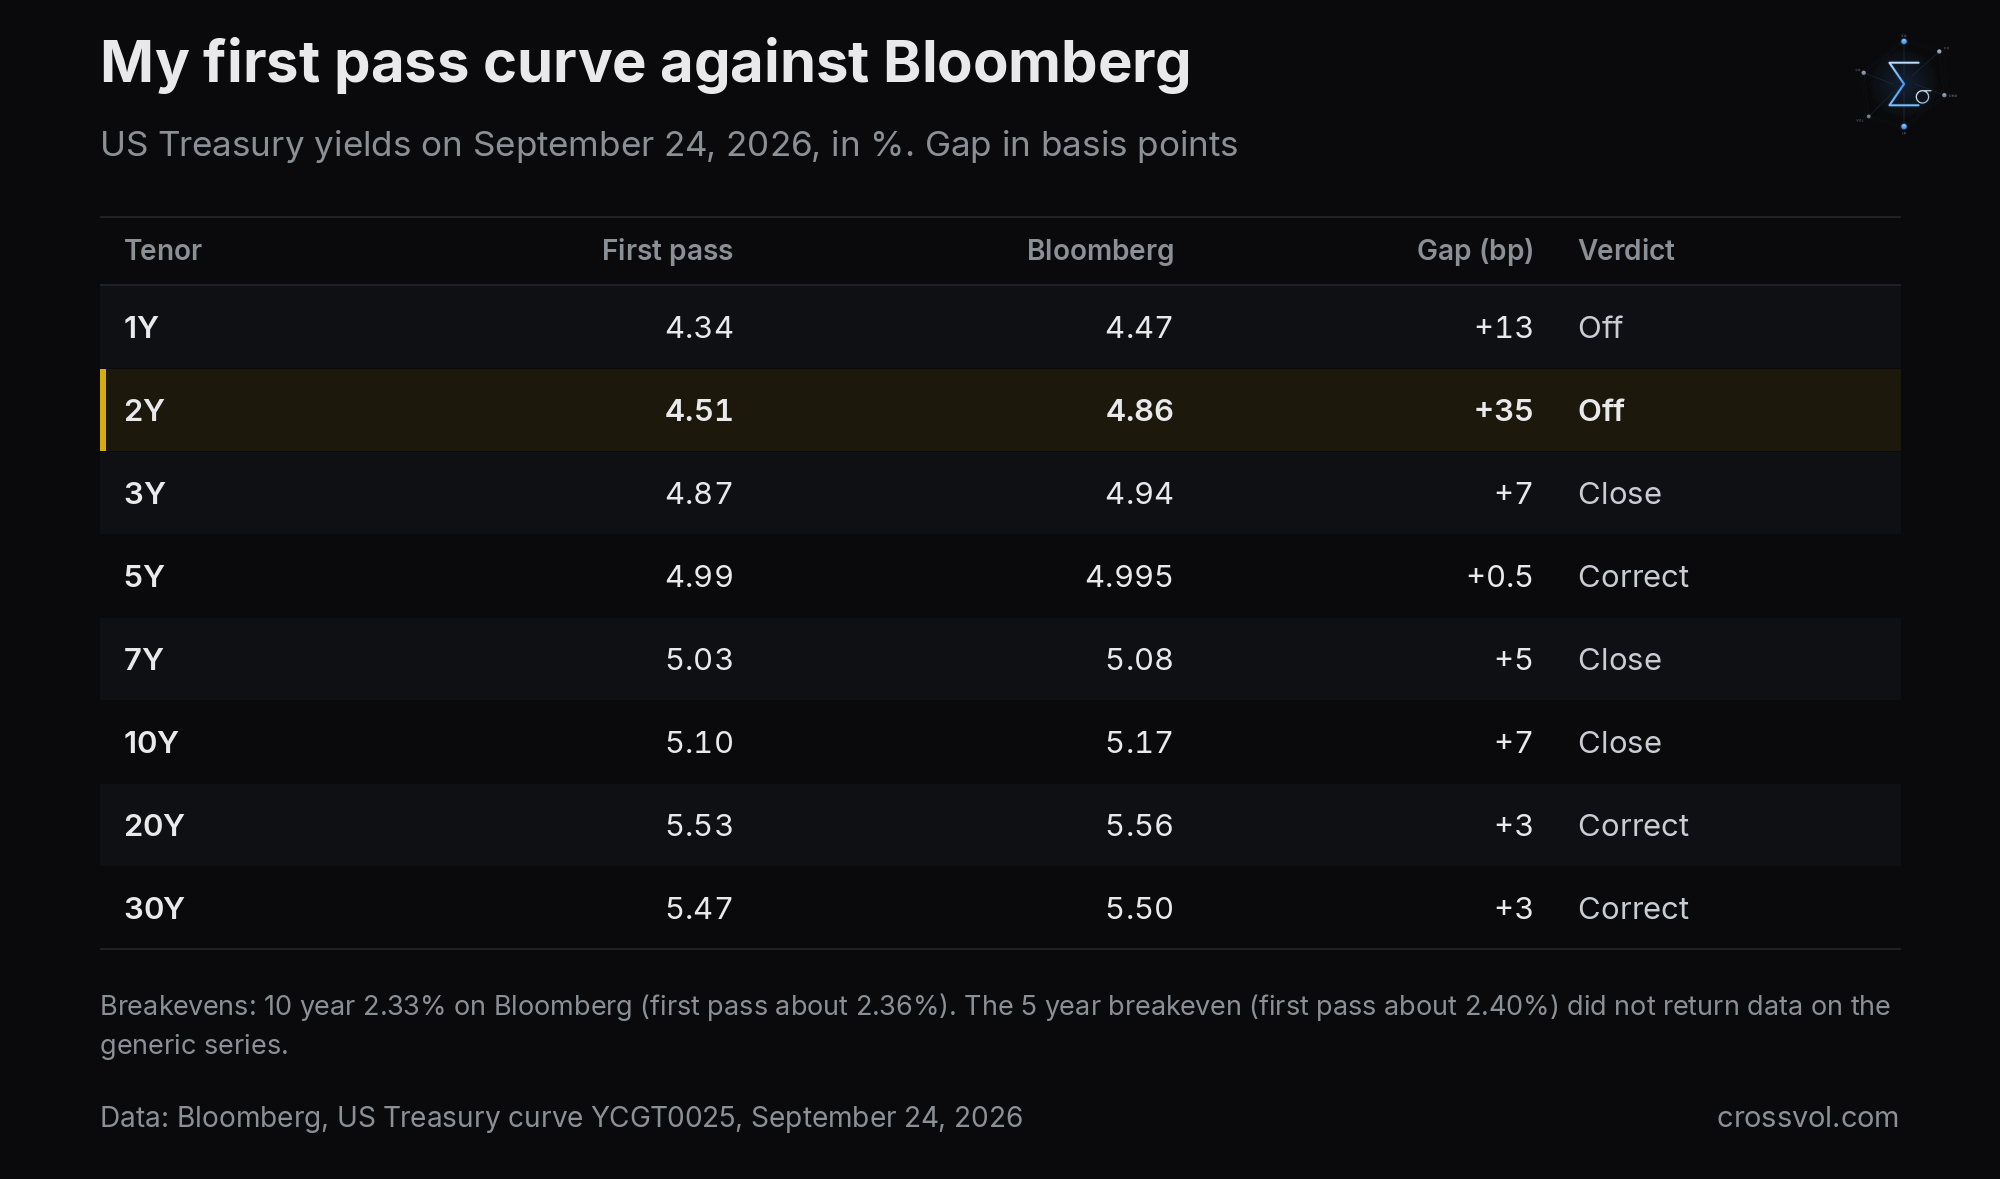
The real yield holds. With the 7 year at 5.08% and a 7 year breakeven of about 2.36% to 2.37%, interpolated between the 5 year (about 2.40%, which Bloomberg's generic series could not confirm on the day) and the 10 year (2.33%), the real 7 year yield is about 2.71% to 2.72%. The real 5 year is about 2.60%. On my first pass I had 2.66% and 2.59%. Either way, 2.7% real in the belly is right, and you can check it against TIPS.
The payoff mostly holds too. On my first pass curve, a 7 year bought at 5.03% has a modified duration of about 5.8. Carry plus about 3 basis points of rolldown gives 5.06% a year. If yields rise 100 basis points over the year, the P&L is 5.06 plus 0.2 of convexity minus 5.79, about -0.5%. If they fall 100 basis points, it is about +11.1%. So "make 10 / lose nothing" is structurally fair, as long as you read "lose nothing" as "lose 0.5%". With those inputs, the one year breakeven on the 7 year is about 90 basis points, which is the "±1%" of the pitch.
The 20 year ratio is right. The 10 year ratio is too generous. The 10 year has a duration of 7.7 and carries 5.12%. Up 100 basis points, it loses 2.2%. Down 100, it makes 13.2%. That is 1 to 5.9 on unrounded numbers, not 1 to 7.5. To get to 7.5 you would need a duration of 7.2 or a carry of about 5.5%, so the pitch was about 25% too optimistic. The 20 year has a duration of 12.5 and carries 5.55%, and its convexity is worth about a full point. Up 100, it loses 5.9%. Down 100, it makes 19.0%. That is 1 to 3.2, so 1 to 3 is fair.
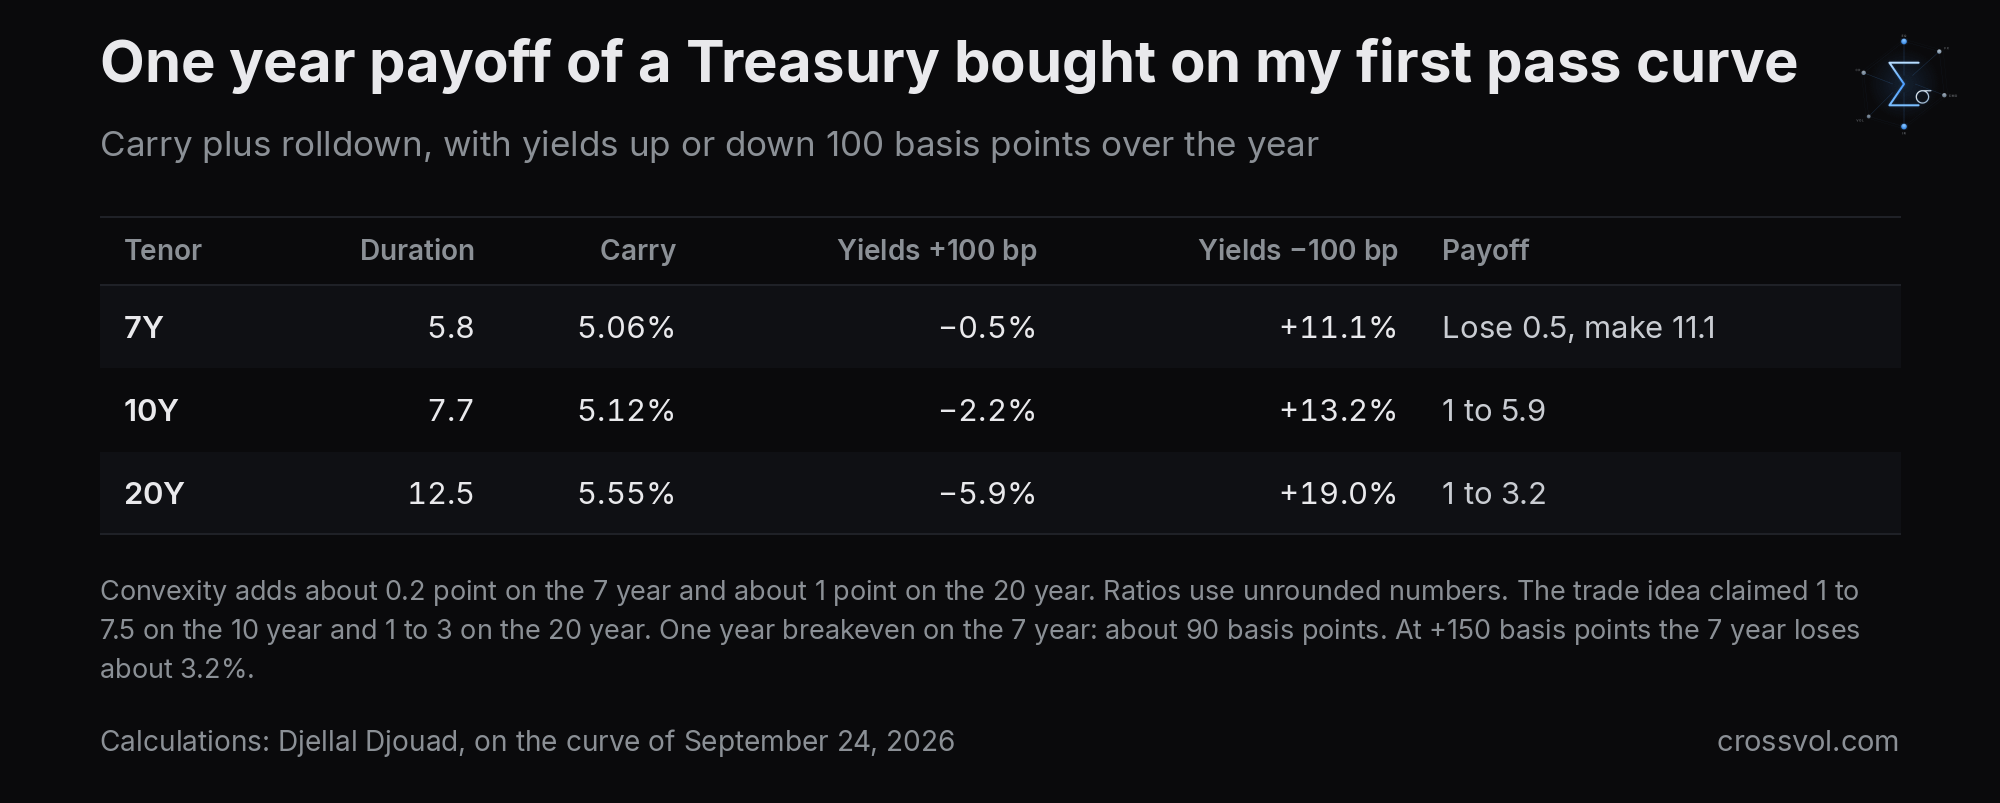
Then comes the part the pitch leaves out. Plus or minus 1% is not an extreme scenario. It is one standard deviation. Annual volatility on the 7 year is about 80 to 100 basis points, so the pitch describes the payoff at one sigma and sells it as insurance.
In this regime, a 150 basis point rise is believable. The 10 year has already added 37 basis points since September 1, from 4.80% to 5.17%, after touching 5.20% on September 24. The Fed hiked on September 16 and leaned hawkish. A 37 basis point move in less than four weeks is not 150, so the tail case needs its own justification. The rest of this note is that justification. At +150 basis points on the 7 year, the same arithmetic gives about -3.2%. "Lose nothing" dies past about 90 basis points. It is a window, not a floor.
So I asked the obvious question. What could go wrong?
The Bid That Is Supposed to Save Bonds
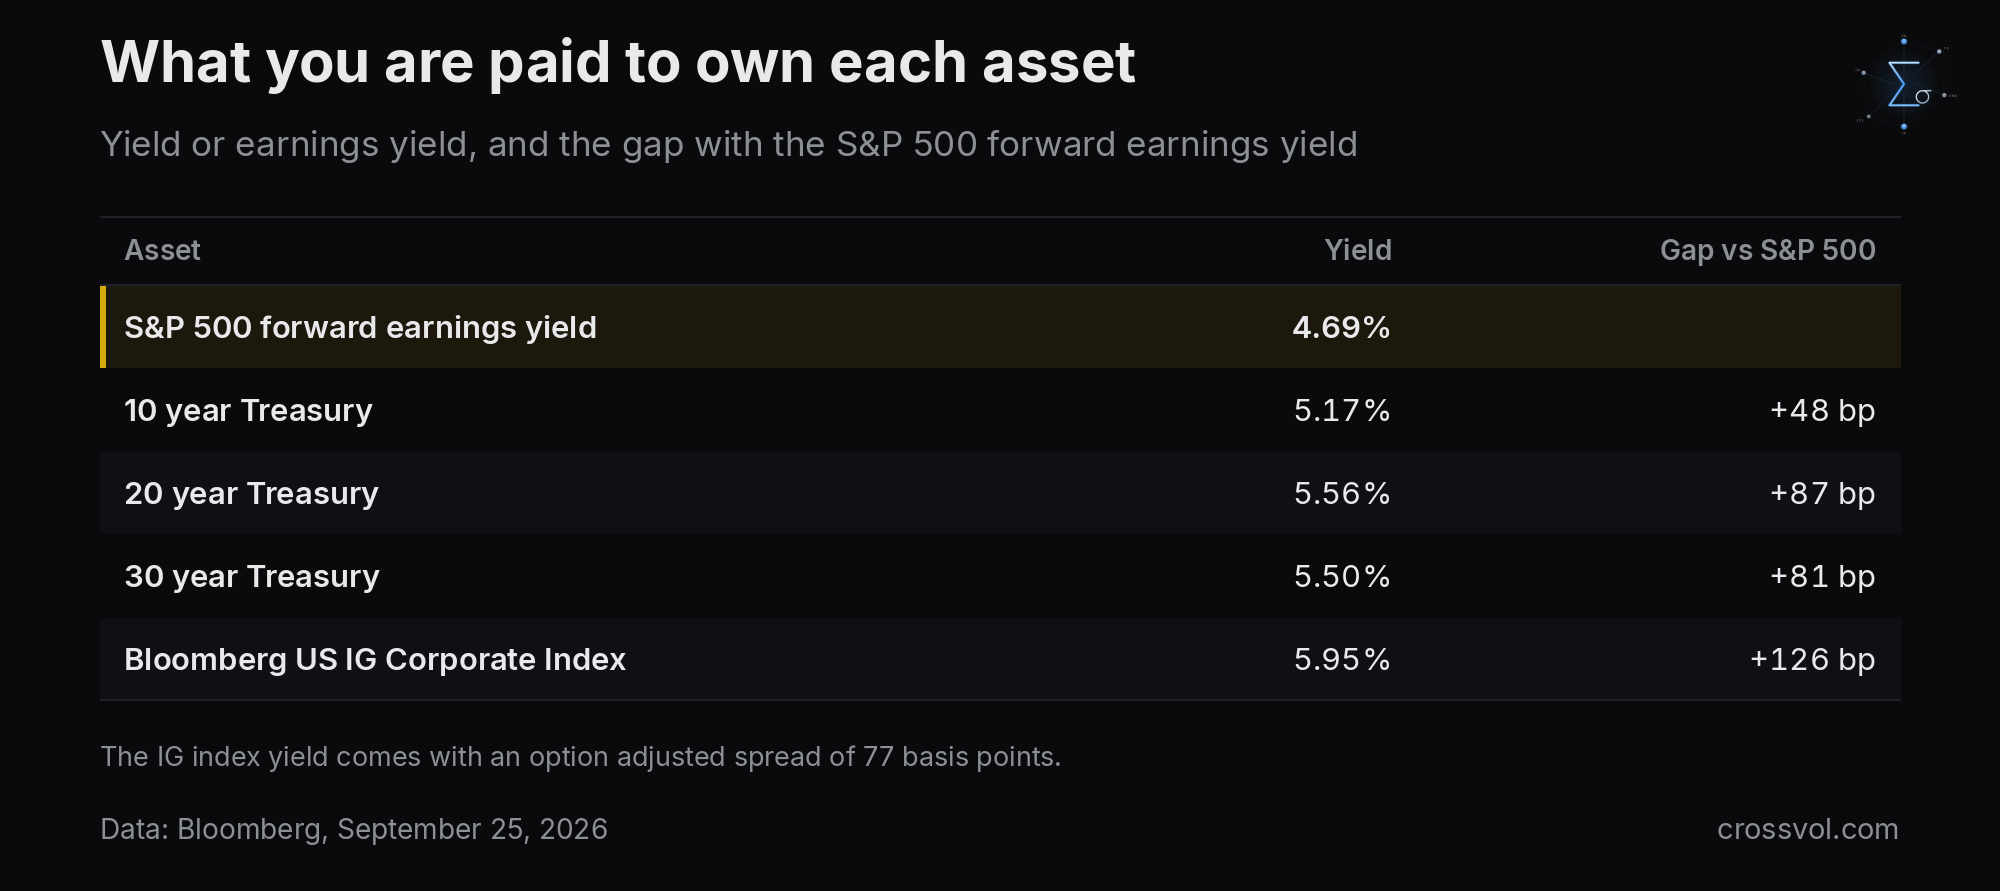
The standard answer is that someone big will buy duration at these yields, and pensions and insurers are the usual candidates. The relative value case for them is real. The 10 year Treasury yields 48 basis points more than the S&P 500's forward earnings, the 20 year 87 more, and investment grade corporates 126 more.
Pensions first. US corporate pension funding ratios are near 25 year highs, with the rolling z score above +2 sigma. At or above full funding, the rational liability driven investment (LDI) response is to derisk: sell equities and buy long duration bonds that match the liabilities. That is the mechanical output of every major pension's glide path policy, and the incentive has rarely been stronger.
It is not that simple. The Dutch pension system is working through a €1.6 trillion structural reallocation, a reminder that large pension rotations can create volatility instead of a stabilizing bid, depending on sequencing and market depth. And some US state pensions have been adding to private credit, treating the volatility there as a buying opportunity. The rotation is not monolithic. It depends on funded status, liability duration and governance constraints. Keep the private credit detail in mind when we get to Oracle.
Insurers second. Life insurers and annuity writers are natural buyers at these levels, but they buy investment grade corporates, not Treasuries. The Bloomberg US IG Corporate Index yields 5.95% at an option adjusted spread of 77 basis points. That is the instrument that matters for insurer asset liability management, not the on the run 10 year. At 5.95% with investment grade quality, new annuity business is very profitable and insurers are writing it. The demand is real, but it lands in 5 to 15 year corporates, not in long Treasuries.
The institutional bid has four limits.
Funded status is rate sensitive. When yields rise, liabilities shrink, and so does the duration a plan needs to buy to hedge them. The bid fades exactly when the market needs it.
Glide paths are slow. Pension derisking happens over quarters, not days. It is a structural tailwind, not a tactical floor.
Supply overwhelms the bid. Even if every overfunded US pension rotated fully into long bonds tomorrow, annual Treasury net issuance would be a multiple of that flow. The bid is necessary but not sufficient to cap yields.
Insurers are duration matched, not duration extending. They buy to match liabilities, not to bet on rates. Once they are matched, the marginal bid stops.
The rotation into bonds is real. The equity risk premium is negative, funding ratios are near records and investment grade yields are at 5.95%. But the bid is slow, partial and supply constrained. It may put a floor under duration at the margin, as a Bloomberg analysis argued on September 22, but it does not cap yields in a regime where fiscal supply is structural and the Fed is still hawkish. The "pension bid saves the trade" argument is a tailwind, not a backstop.
The Liability Side in One Index
To see why US pensions are in derisking mode, look at their liabilities. I02786, the Bloomberg US Pension Liability Index, tracks the present value of US corporate pension liabilities. When yields rise, the index falls, liabilities shrink and funded ratios improve mechanically. The 2022 and 2023 rate shock was the largest liability compression in decades, and it drove the biggest improvement in funded ratios since the early 2000s.
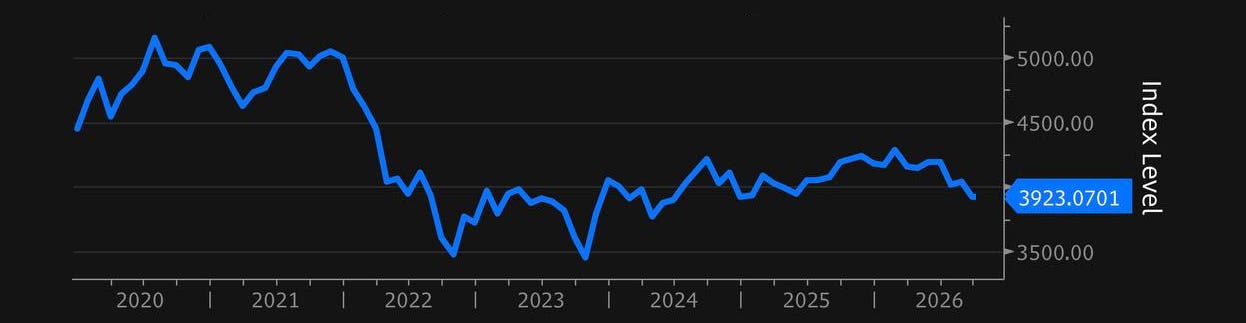
Three levels matter. The peak was 5,147 in July 2020, with rates near zero and liabilities at their maximum. The trough was 3,459 in October 2023, after the hiking cycle had compressed liabilities by about 33%. In September 2026 the index stands at 3,923, about 13% above that trough and still about 24% below the 2020 peak. Funded status is a two sided equation, and this index only shows the liability side. The asset side is the one a crash would hit.
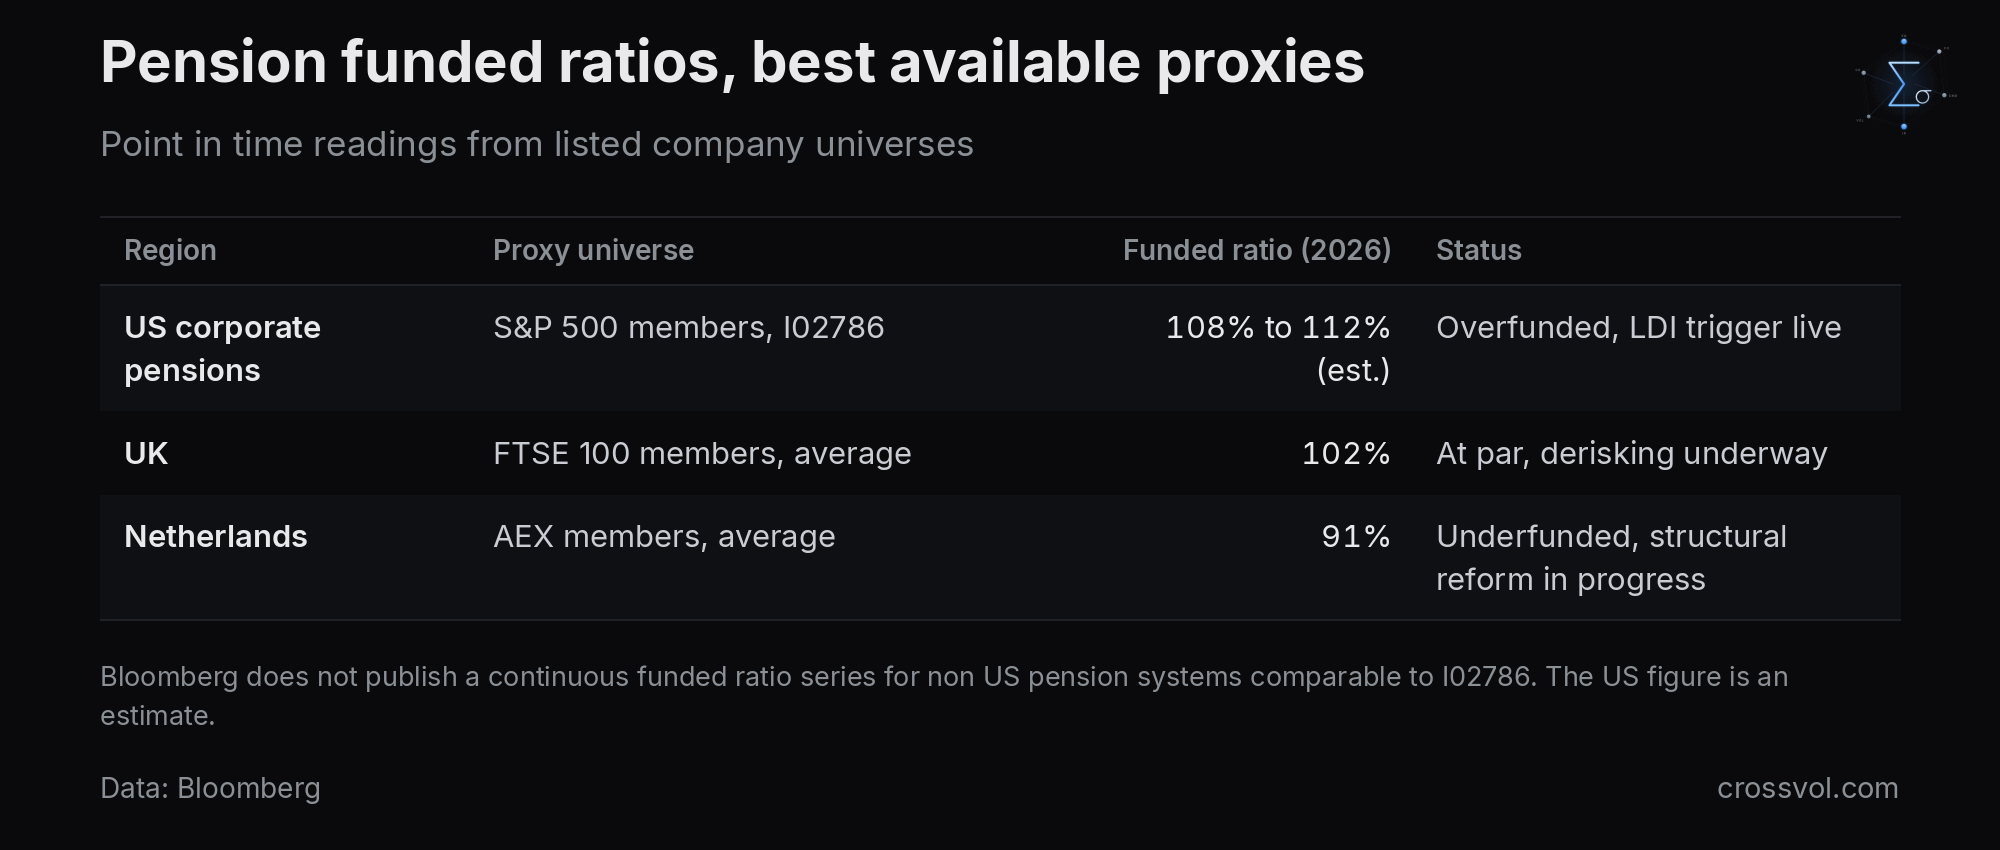
Bloomberg does not publish a continuous funded ratio series for non US pension systems comparable to I02786. The best available proxies are listed company universes, and they are point in time.
Europe and Asia Are Not on the Same Clock
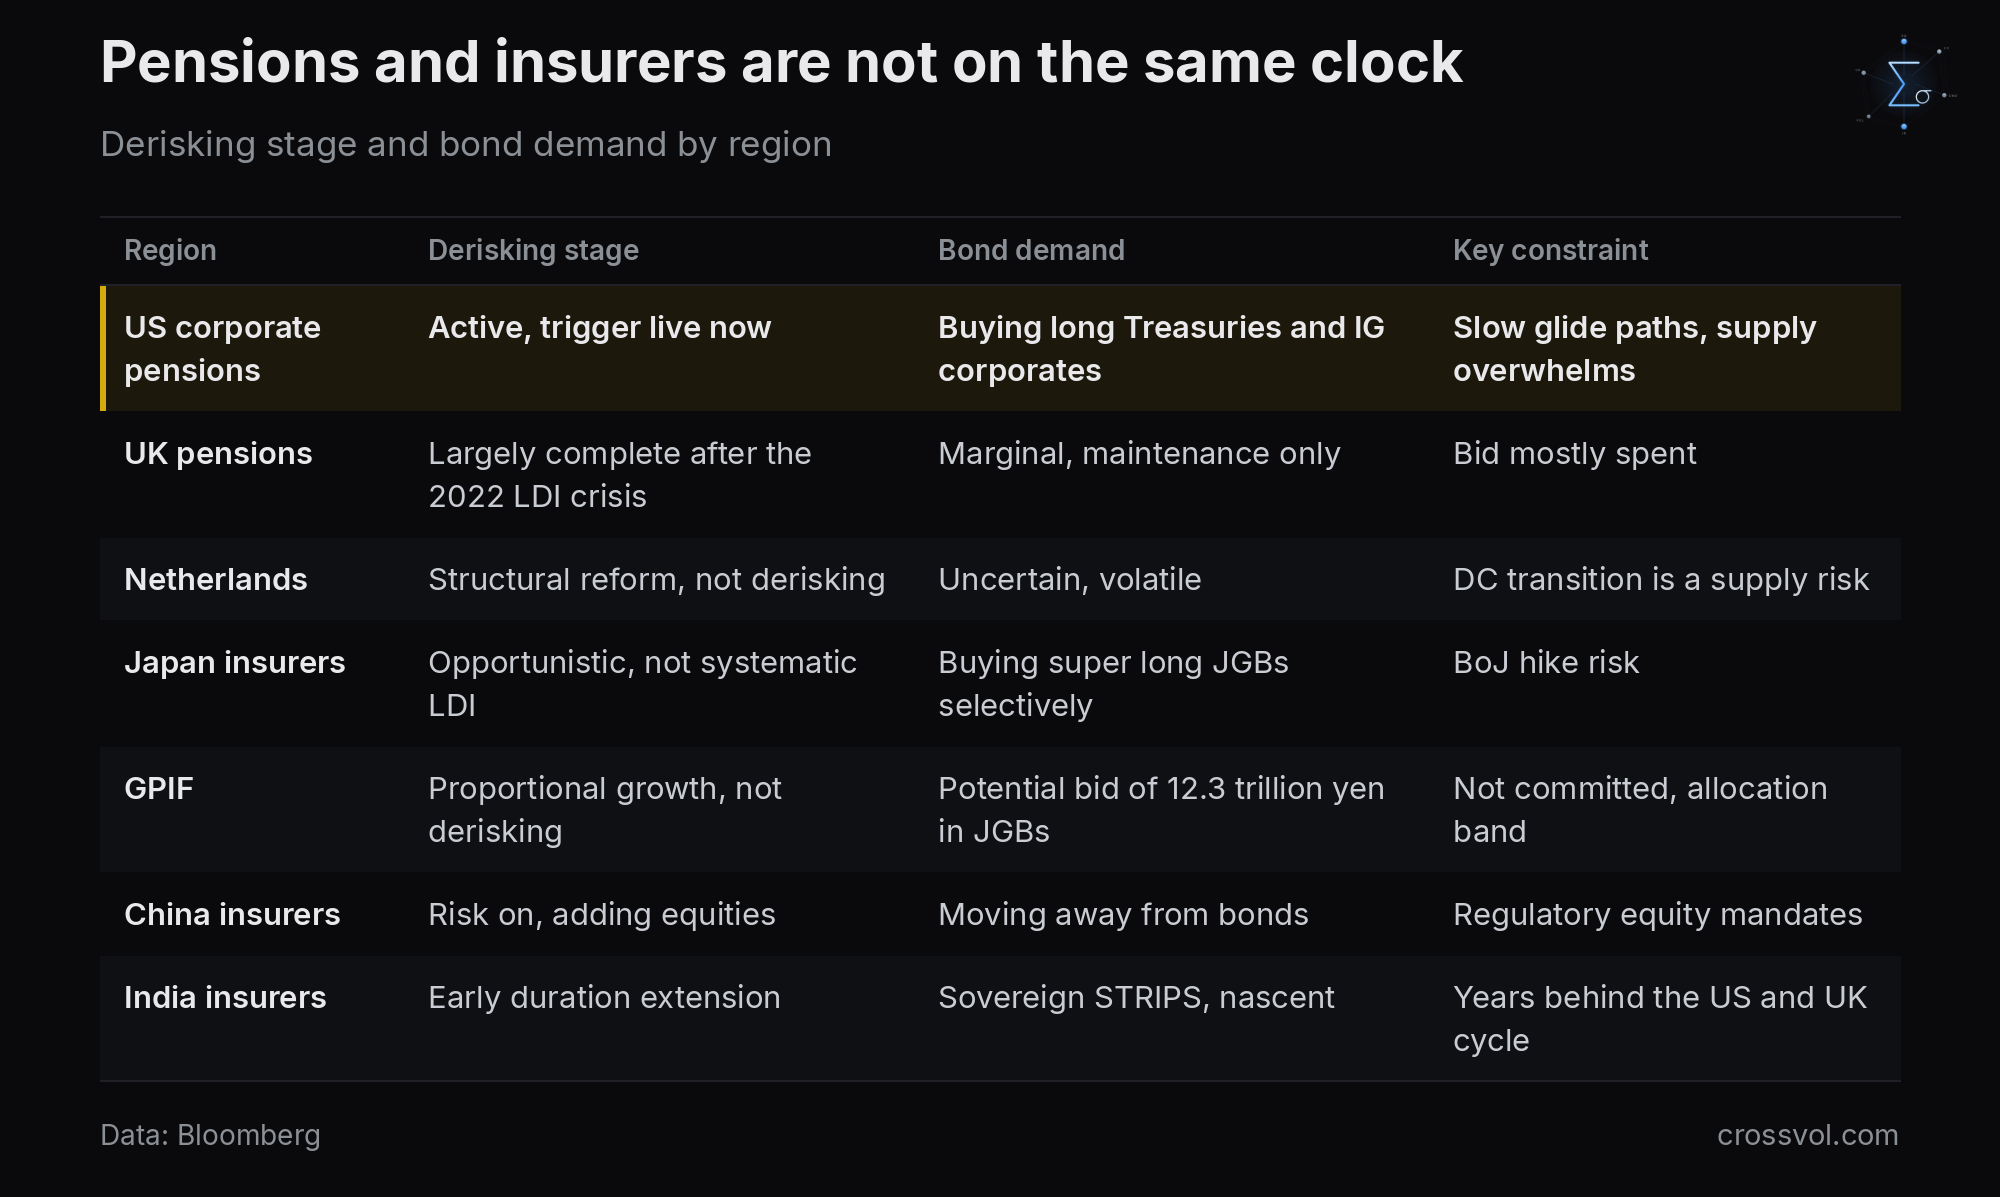
Are pensions and insurers in Europe and Asia on the same derisking horizon? No, and the divergence matters. Each region sits at a different point in the cycle, with its own rate regime, regulation and liability structure.
Europe is ahead of the US, and structurally disrupted.
UK. The 2022 LDI crisis forced an accelerated derisking that the US is only now approaching. UK corporate pensions are about 102% funded, and many have already locked in duration matches or are in runoff. The marginal LDI bid from UK pensions is largely spent.
Netherlands. The €1.6 trillion Dutch system is in the middle of its move from defined benefit to defined contribution under the Wet Toekomst Pensioenen reform. At 91% funded on the AEX proxy, it is not in derisking mode. It is in structural reallocation mode, which can create volatility instead of a stabilizing bond bid. The sequencing of that transition is a source of duration supply risk, not demand.
European insurers. Under Solvency II they are already duration matched by regulation. Their marginal bid is limited to new premium inflows.
Japan is the divergence that matters most.
Japanese life insurers hold 388 trillion yen of combined assets, about $2.5 trillion at 157 yen to the dollar, and they are the largest institutional bond buyers outside the Fed and the BoJ. Their behavior is the key variable for global duration.
The picture is split. Meiji Yasuda doubled its plan for super long JGB purchases in the fiscal year to March 2027 to more than 2 trillion yen, calling 30 year yields of 3.7% to 3.9% "an excellent buying opportunity". Japanese insurers as a group bought the most super long JGBs in three years in June 2026, a net 630.5 billion yen.
But in their April 2026 plans, 5 of 10 large insurers expected the 10 year JGB yield to climb another 50 basis points to 3%, which kept them on the sidelines. They were right: the 10 year JGB is at 3.07%. Fukoku Mutual explicitly avoided 30 and 40 year bonds.
GPIF, the world's largest pension fund, has grown its fixed income holdings from 71 trillion yen to 129 trillion yen since fiscal 2019. That was proportional growth, not a derisking rotation. Societe Generale estimates GPIF could buy up to 12.3 trillion yen more JGBs without changing its allocation mix. That is a potential bid, not a committed one.
The critical constraint: Japanese and Taiwanese insurers hedged only 41% of their foreign currency exposure as of June 30, 2026, the lowest since at least 2015. Dollar weakness accelerates the repatriation of foreign bonds into JGBs, and it also crystallizes losses on unhedged Treasury positions. For the US long end, that cuts both ways.
China and India are moving the other way.
Chinese insurers are adding equities, not derisking into bonds. Their equity holdings rose by 640 billion yuan in the first half of 2025 to 3.1 trillion yuan, the highest since 2022. At the same time, Beijing is recapitalizing its largest insurers with 200 billion yuan of special government bonds, about $29 billion. That is a solvency backstop, not an LDI signal.
LIC, India's largest insurer, is preparing to buy zero coupon sovereign STRIPS for the first time. That is early stage duration extension, years behind the US and UK cycle.
The JGB curve has become a global duration signal in its own right. The spread between the 2 year and the 10 year was about 105 basis points when a Bloomberg Macro View flagged it on September 7, and it is 114 now, from 1.93% to 3.07%. Treasury and gilt curves are biased toward the same steepening, as fiscal and duration risks outweigh short rate expectations. The loop runs both ways. If Japanese insurers extend duration at home, they take pressure off Treasuries. If they stay short and repatriate dollar assets, they add to it.
The US is the only major market where the LDI derisking trigger is live and mechanically compelling right now. Europe's bid is largely behind us. Asia's bid is opportunistic, rate conditional and complicated by currency. None of it is a structural floor under US duration.
What It Costs a Japanese Insurer to Own a Treasury
The next question decides the Japanese bid. What does it cost a Japanese insurer to buy Treasuries with the currency hedged, and does the trade beat JGBs?
Bloomberg's FXHCUSJP index, the standard 3 month rolling FX hedge cost for a yen based investor in dollar assets, stood at 2.93% on September 25, 2026. That is the all in annualized cost of selling dollars forward against yen, rolled every 3 months.
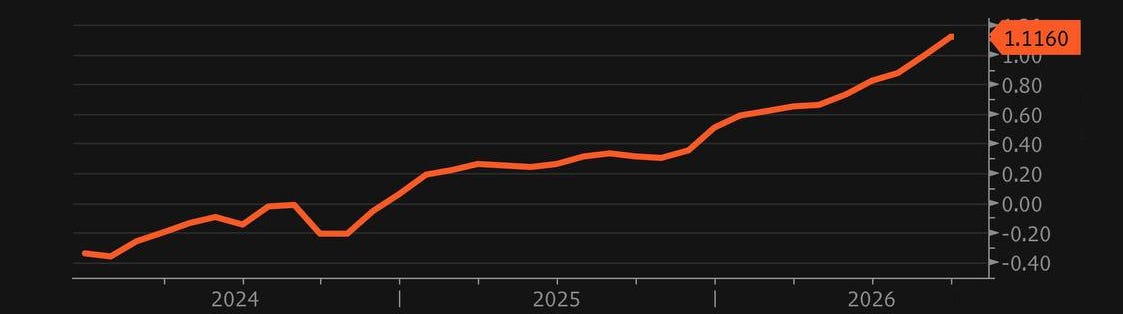
It has come down a long way, from 5.58% in January 2024, a decline of 265 basis points. About 147 basis points of that came from the yen side: as the BoJ hiked, the JPY 3 month implied yield rose from -0.35% to +1.12%. The rest came from the dollar side, where short rates are lower than in January 2024.
Three year swap rates tell the same story further out. The 3 year USD SOFR swap is at 4.74% against 2.16% for the 3 year JPY OIS, a gap of 258 basis points. The cross currency basis (DBXSJP3M) is at -17.3, compressed from -54 at its October 2024 extreme. A negative basis is an extra cost for a yen investor who funds dollars through FX swaps, and at -17.3 it adds about 17 basis points a year.
The compression of the basis is a signal in itself. When Japanese demand for dollar assets was intense, from 2022 to 2024, the basis was deeply negative and yen investors paid a large premium to access dollars. At -17, the market is already pricing less Japanese buying.
Now put the hedged Treasury next to the JGB.
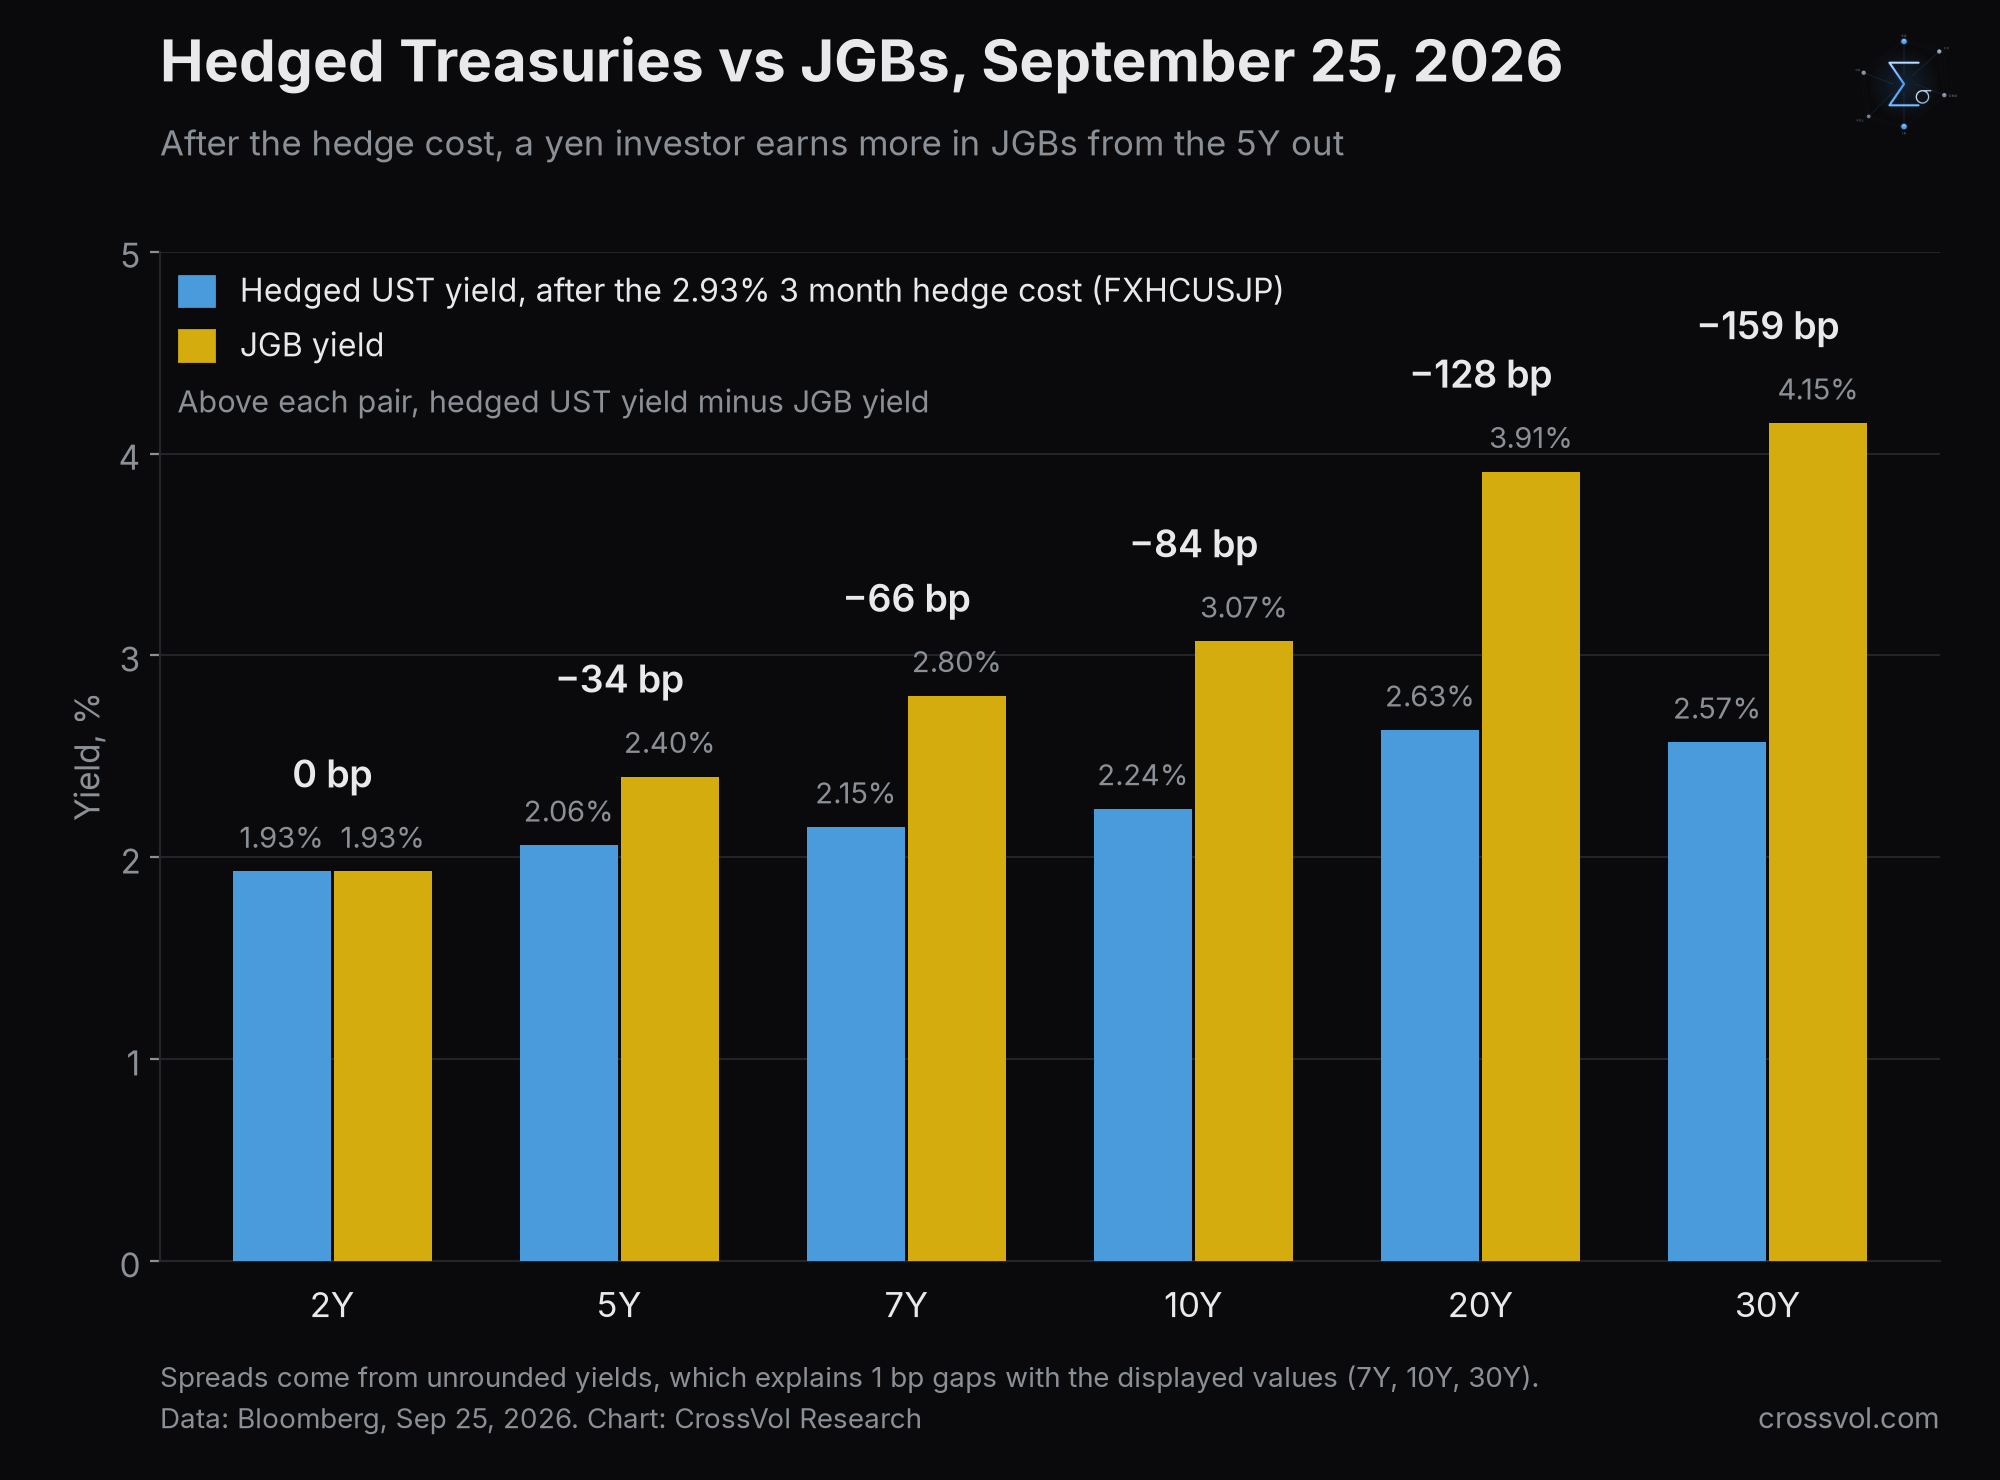
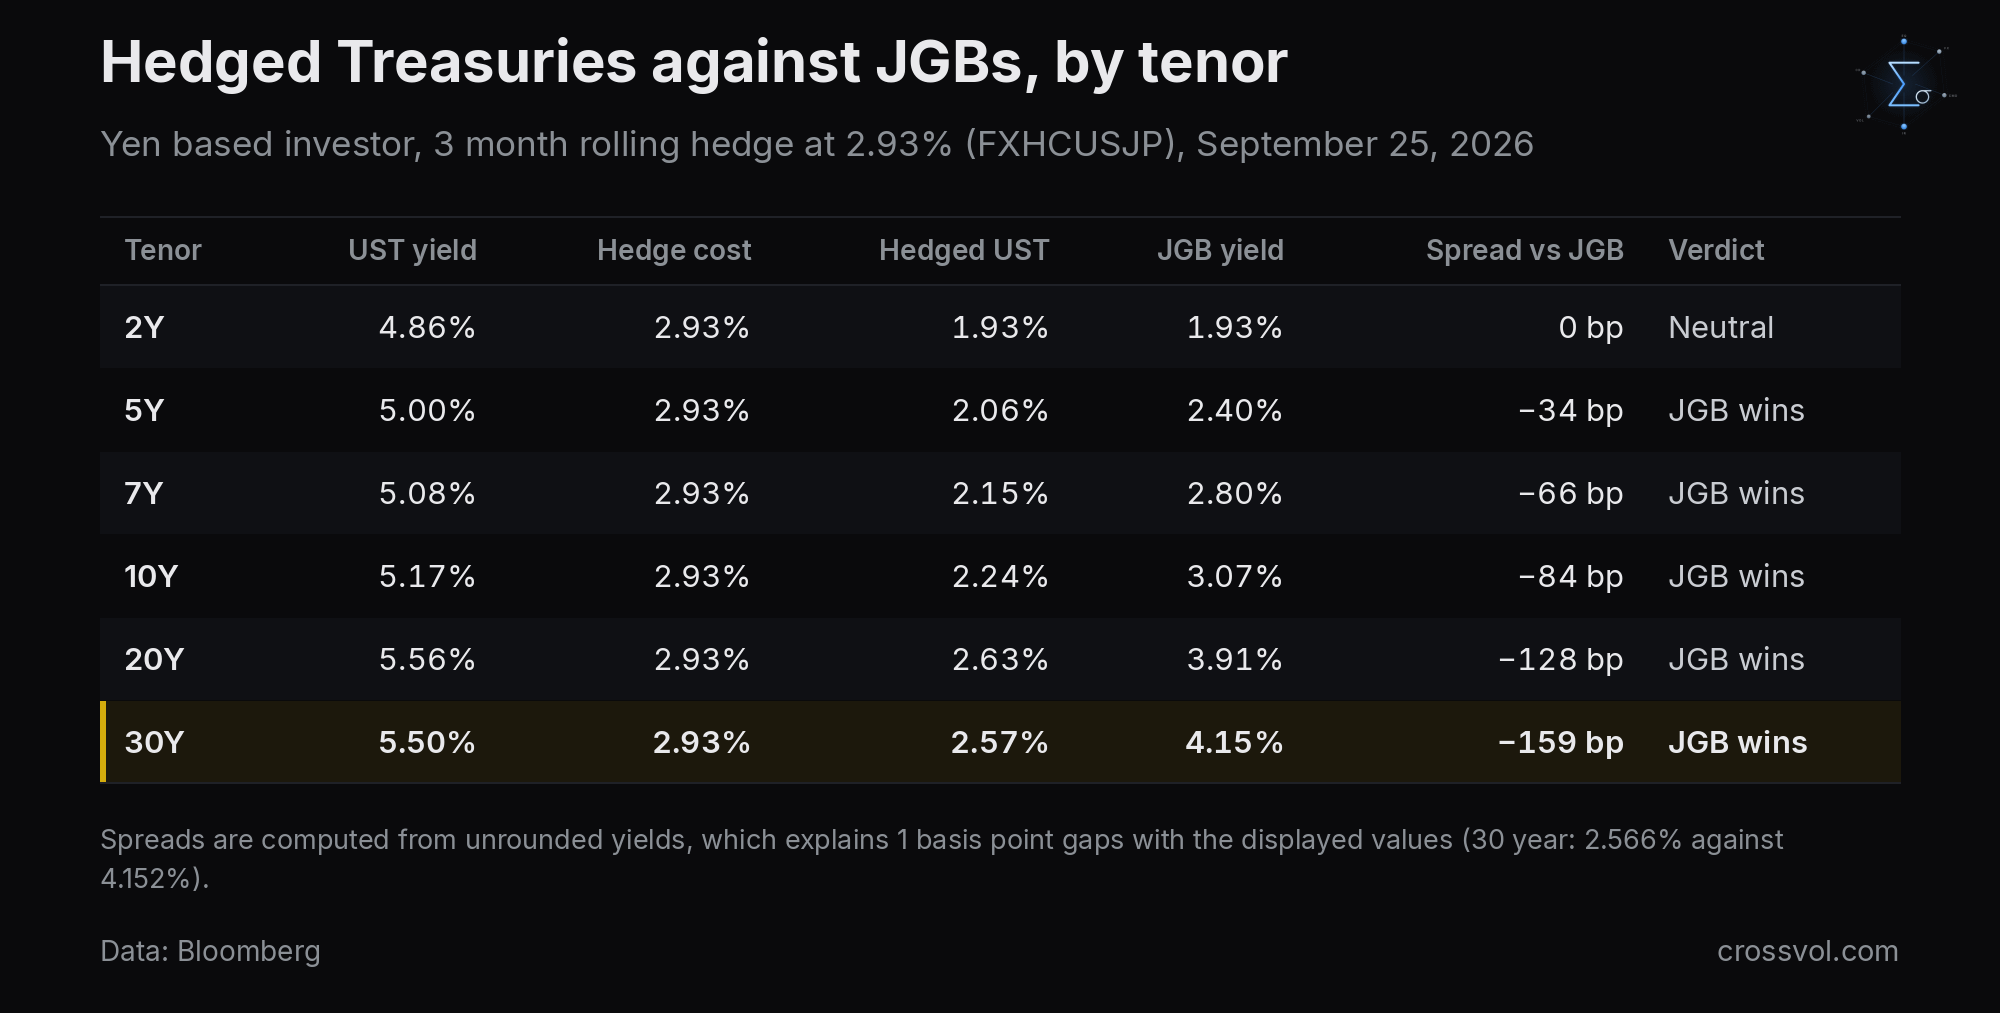
Beyond 2 years, hedged Treasuries yield less than JGBs at every tenor, and at 2 years it is a wash. The gap widens dramatically at the long end. A Japanese insurer buying 30 year Treasuries fully hedged earns 2.57%, 159 basis points less than it gets on a 30 year JGB at 4.15%. That is the structural reason Japanese life insurers have been rotating into super long JGBs at home instead of extending into US duration.
Three caveats.
Rolling hedge against a matched hedge. The 2.93% is the rolling 3 month cost. A life insurer matching 20 to 30 year liabilities would use a long dated cross currency swap, not a rolling 3 month forward. The 1 year forward points of -471 work out to about 3.0% a year (4.71 yen on a 157.3 spot), a touch above the 3 month cost, so hedging longer does not close the gap. The 1 year basis index (DBXSJP1Y) did not return data, so the longer end is an approximation.
Unhedged and partially hedged books. At a 41% hedge ratio, some insurers are deliberately running FX risk and betting on a weak yen. Unhedged, the 30 year Treasury at 5.50% beats the 30 year JGB at 4.15% by 135 basis points. That is a currency bet, not an asset liability trade.
The direction of the basis. If the BoJ keeps hiking and the basis compresses toward zero, the hedge cost falls further and hedged Treasuries become more competitive. But the JGB curve is steepening at the same time, as BoJ hikes push short rates up and fiscal supply weighs on the long end. To reach parity, the hedge cost would have to fall another 84 basis points at 10 years and 159 at 30 years.
At a 2.93% hedge cost, hedged Treasuries do not beat JGBs at any tenor. That is the quantitative reason Japanese buying of Treasuries is opportunistic and unhedged, not a structural asset liability bid. Hedged Treasuries only become attractive if further BoJ hikes compress the differential while JGB yields fall, two forces that partly contradict each other. On a hedged basis, the Japanese institutional bid for US duration is effectively closed at current levels.
Japan Is Already Going Home
Which leads to the risk that is growing: Japan reducing its Treasury holdings, and doing it faster if the yen appreciates.
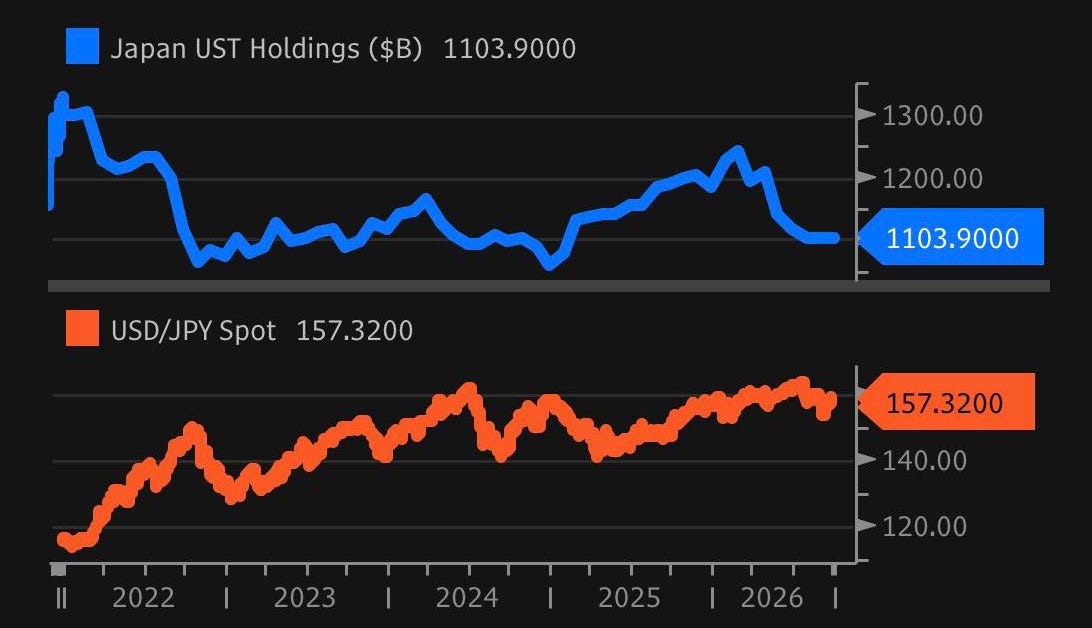
The chart shows the core dynamic. Japanese Treasury holdings and USDJPY tend to move in the same direction. When the yen weakens, the unhedged dollar book gains in yen terms and the carry feels free. When the yen strengthens, the same book loses in yen terms and the incentive to repatriate accelerates.
Japan's holdings (US Treasury TIC data, HOLDJN on Bloomberg) peaked at $1,325 billion in November 2021, troughed at $1,062 billion in December 2024, and are falling again: from $1,239 billion in February 2026 to $1,104 billion in July 2026, a drop of $135 billion in five months. That is already the second largest five month drawdown on record, behind only the 2022 rate shock.
USDJPY stood at 157.30 on Friday, after peaking at 163.86 in July 2026. The yen has gained 1.2% over the past month and 2.8% over three months, so the trend is already in motion. One month implied volatility is 8.89%, which prices a one standard deviation move of about 4 yen over the next month and about 14 yen over a year. A return to 140 to 145, where USDJPY traded in 2023, is a 0.9 to 1.2 sigma move on a one year view. Getting there within a month would take a 3.0 to 4.3 sigma move.
The repatriation runs through three channels.
Stealth repatriation, already underway. TIC data show Japanese investors unwinding through Treasury bill maturities rather than outright sales of long bonds. It is quiet but cumulative: every maturing bill that is not rolled is a permanent reduction in the Japanese bid for US duration. Bloomberg analysis links a $100 billion reduction in Japanese holdings to sustained upward pressure on Treasury yields.
The unhedged exposure. Japanese and Taiwanese insurers hedged only 41% of their foreign currency exposure as of June 30, 2026. At 157, the unhedged dollar book sits on large unrealized FX gains accumulated since 2022. A move to 140, an 11.0% drop in USDJPY or a 12.4% rise in the yen, would erase a large part of those gains and turn positions bought above 140 into losses. The rational response is to close the position: sell Treasuries, repatriate, buy JGBs. The trigger is not a policy decision. It is a mark to market threshold.
FX intervention. Japan's Ministry of Finance spent an estimated $34.5 billion on intervention in May 2026. Intervention draws on FX reserves, which are held largely in Treasuries, so each episode is both a direct cut in Japanese Treasury demand and a signal that Tokyo wants a stronger yen. The two channels reinforce each other.
GPIF, with $1.8 trillion of assets, is the wild card and the most consequential single actor. Speculation is growing that it could raise its JGB allocation target, which would come with a lower foreign bond allocation. Tokyo is pushing pension funds and households to invest more at home, although analysts broadly see that as a long term shift, not a near term catalyst. Goldman Sachs expects life insurers to "probably lower USD exposure after raising it in recent years", while calling significant near term repatriation unlikely. The key words are near term. The structural direction is not in doubt.
How big could it get? The table below is illustrative. It applies the yen move to the whole $1.1 trillion of Japanese holdings, which is an upper bound, since insurers hedge part of their books and official reserves do not mark to market the same way.
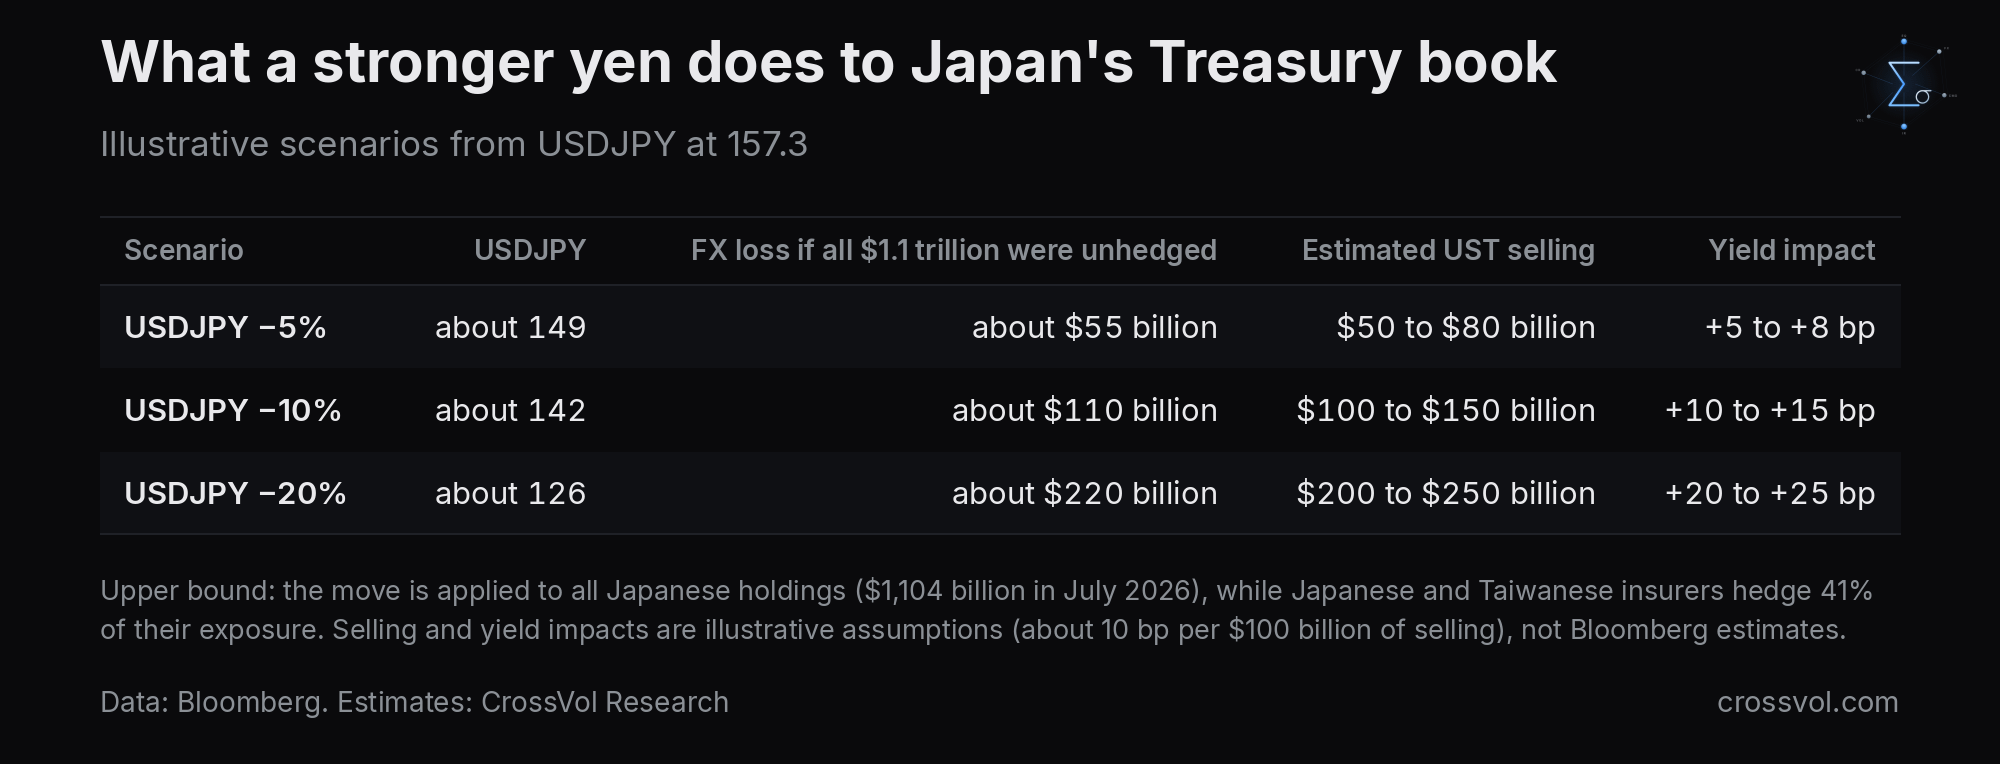
The selling and yield figures are my illustrative assumptions, about 10 basis points per $100 billion of selling. Bloomberg's analysis only says that a $100 billion drop in Japanese holdings goes with sustained upward pressure on yields, without a number. The effects would be structural, not transient: a permanent reduction in the marginal buyer base, not a one off shock that reverses.
Four reasons this is non linear.
The carry unwind amplifies the move. Yen appreciation triggers an unwind across the whole yen funded book, not just Treasuries. In August 2024, USDJPY moved 10 yen in days and forced deleveraging across global risk assets at the same time.
JGB yields near three decade highs make home genuinely attractive. Markets may be underpricing how fast the repatriation math can shift. The 30 year JGB at 4.15% against a hedged 30 year Treasury at 2.57% is a 159 basis point argument for staying home, and it widens with every BoJ hike.
The contagion is already visible in emerging markets. Malaysian bonds face Japanese outflows as their yield premium over JGBs has shrunk from 278 basis points, the five year average, to about 115. Treasuries are next in line, not first.
The short JGB trade is structurally over. Bloomberg Intelligence notes that a more credible BoJ and potentially large inflows would turn long end JGBs from laggards into outperformers. The consensus short that kept Japanese capital offshore is unwinding.
The repatriation risk is already in the data. Holdings are down $135 billion in five months. The mechanism is stealth, bill runoff rather than long bond sales, so it will not show up in prices until the flow is big enough to overwhelm the marginal buyer. The yen is the accelerant, with only 41% of the insurers' foreign exposure hedged. Add the 159 basis point hedged gap at 30 years and the direction of travel is clear. The question is pace, not direction. For the belly trade at the top of this note, this is the tail risk that makes the "lose nothing" window fragile. A yen episode does not just move yields. It removes the marginal buyer exactly when the supply calendar is heaviest.
Bessent, the House That Tells Its Best Customer to Cash Out
Which brings me to Scott Bessent, who has decided to help.
On Friday, September 25, the Treasury Secretary posted on X that he had discussed "the desirability of a strong yen that reflects Japan's strong economic fundamentals" with Finance Minister Katayama. Both sides reaffirmed that the undervaluation of the yen is "a matter of concern". Prime Minister Takaichi had told President Trump in a meeting earlier in the week that an undervalued currency is "problematic". The yen rose as much as 1.2% to 156.94 per dollar on Friday, its best day in nearly three weeks and the best performer in the G10.
It did not come out of nowhere.
June 22. Katayama and Bessent agreed to take "bold steps" on currencies if needed, and the two countries were described as increasingly "aligned" on FX policy, with USDJPY near 161.
July. USDJPY peaked at 163.86, the weakest yen in four decades.
Early August. The US and Japan carried out their first joint FX intervention in 15 years. Japan alone is estimated to have spent about $74 billion. Bessent let photographers catch his notepad, which showed a plan to buy $10 billion of yen.
September 8. At a Southern Methodist University event in Texas, Bessent told traders who they were up against: "I am the house now, so when we intervene with the Japanese yen, I have pretty good insight into what the Japanese, what the Bank of Japan is going to do, what Japanese policymakers are going to do."
September 9. The Treasury tripled its long dated buyback to $6 billion, from $2 billion. It did not stop the bond selloff.
September 25. Verbal intervention again, this time with explicit "strong yen" language from both sides.
That is casino language. Bessent is claiming the house edge through inside knowledge of coordinated US and Japanese policy, and the message to carry traders is that they are betting against a counterparty who knows the next move before they do. Casinos usually keep their edge quiet. This one announced it on stage, tripled its bet the next day, lost the hand anyway, and is now asking its biggest customer to cash out.
Because that is the problem. Bessent runs a Treasury issuance calendar of more than $2 trillion a year, and he is also a public advocate of a stronger yen. Those two jobs are at war.
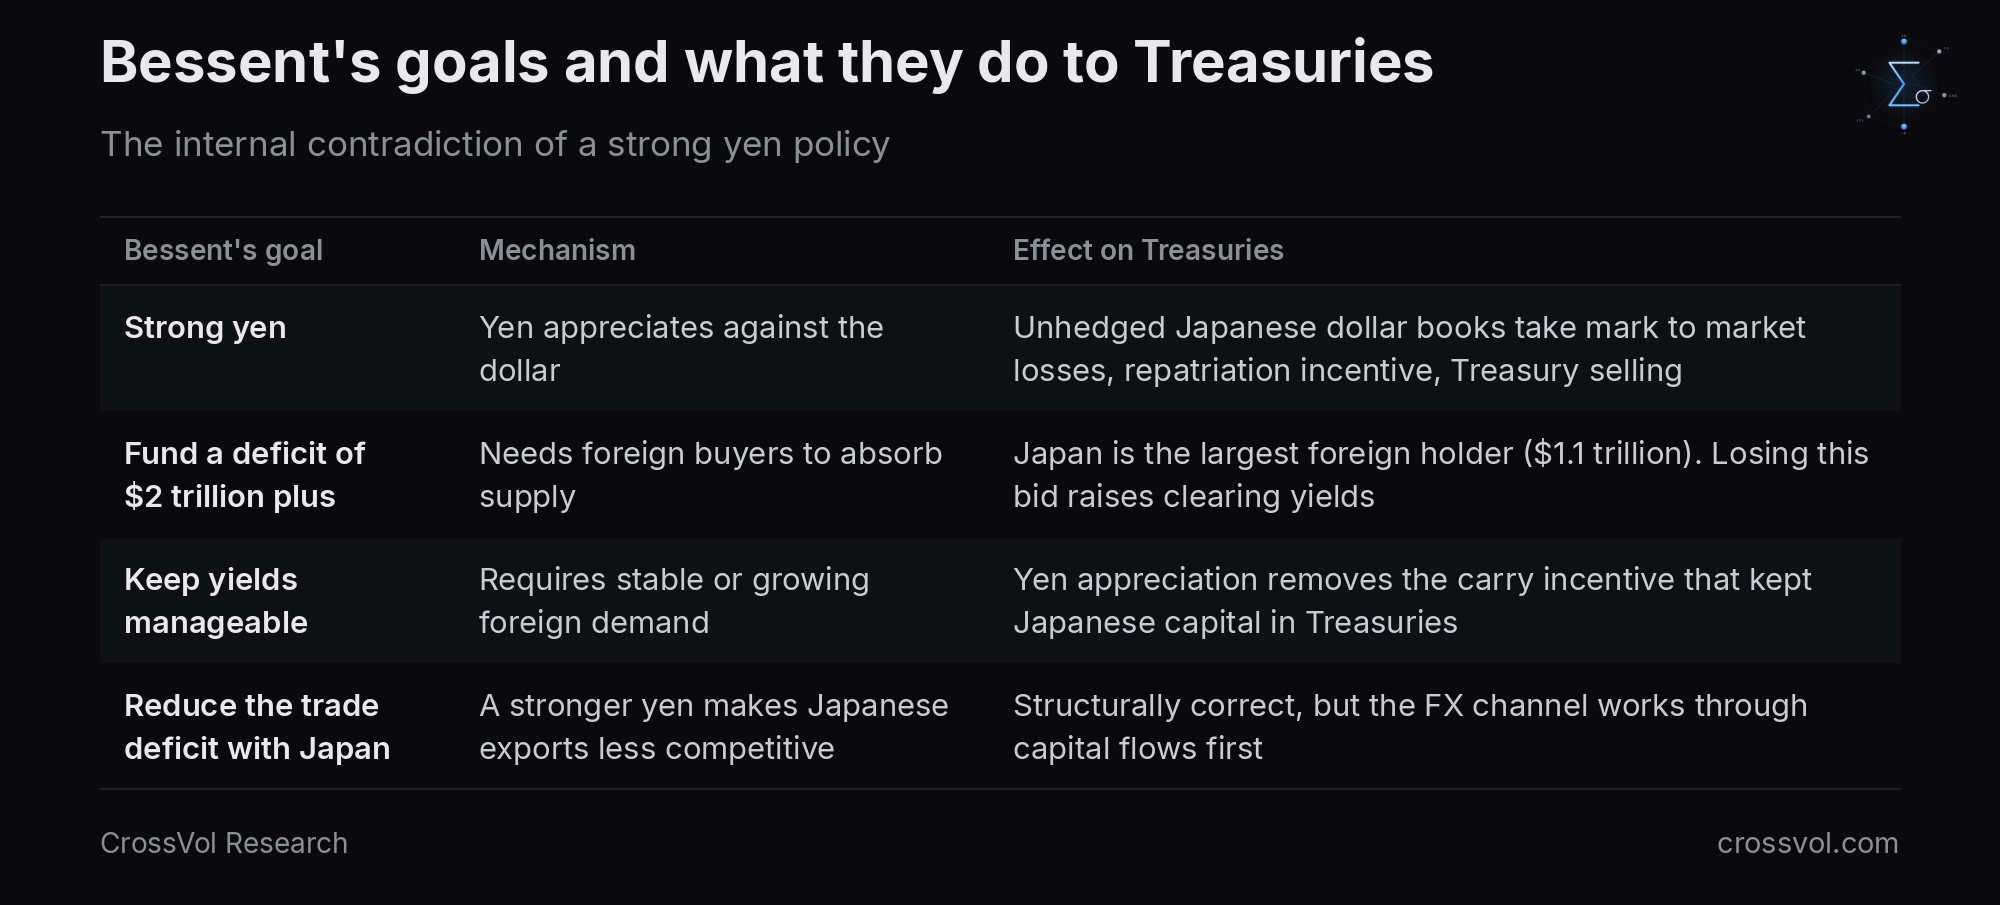
Japanese and Taiwanese insurers hedge only 41% of their foreign currency exposure. On the full $1.1 trillion of Japanese holdings, a 10% drop in USDJPY is up to $110 billion of FX losses. Bessent is, in effect, pulling the trigger on that scenario himself.
The real variable, and the real risk, is the BoJ. Fitch says further yen appreciation will likely require BoJ rate hikes, and that yen weakness "does not appear to be primarily due to relative stances of US and Japanese monetary policy". That is the crux. Verbal intervention, even joint intervention, is not enough without the BoJ. The BoJ raised its policy rate from 1.00% to 1.25% on September 18, the highest since 1995. SOFR was 3.88% on September 24. The gap of about 263 basis points is a structural anchor of the carry trade.
The BoJ has moved at a deliberately slow and well signaled pace to avoid a disorderly carry unwind. A BIS paper estimates that a 25 basis point policy surprise, when carry trade activity is elevated, can lead to almost 10% yen appreciation. That is the August 2024 playbook, when a modest BoJ surprise triggered a violent unwind. A Bloomberg Macro View on August 5, 2026 described the path to USDJPY 142 as likely to be "rapid and disorderly".
Wall Street is split. Wells Fargo argues the BoJ may struggle to deliver more hikes than markets already price. JPMorgan notes that a stronger yen could itself reduce the BoJ's incentive to hike, a self limiting dynamic. And on September 25, Morgan Stanley abandoned its long held call for dollar weakness in the second half of 2026, citing wider rate differentials and robust US growth, which runs straight into the strong yen narrative.
The fire Bessent is playing with, in order of probability:
Verbal intervention works too well (near term). USDJPY breaks 155, then 150. Japanese insurers sitting on unhedged dollar books start repatriating systematically. Bill runoff turns into outright long bond sales, and the $135 billion drawdown of the past five months becomes $200 billion or more.
The BoJ hikes in response to US pressure (medium term). A 25 to 50 basis point surprise, politically easier with US backing, triggers the carry unwind. USDJPY moves 10 yen or more in days, as in August 2024. Global risk assets reprice at the same time, and the 7 and 10 year Treasuries lose their marginal buyer at the worst possible moment, in peak supply season.
The trade deal becomes a currency clause (structural). The $550 billion US and Japan investment deal already embeds implicit FX expectations. If currency commitments become explicit, as has been rumored in the bilateral negotiations, Japan's capital allocation becomes a geopolitical variable instead of a market one. That would be a permanent shift in the Treasury buyer base.
Intervention reserves are finite. Japan spent an estimated $74 billion or more in the August joint intervention. If reserves are deployed at that pace, they last weeks, not months, and every intervention that fails to hold the level destroys credibility and invites carry traders to reload.
The paradox fits in one sentence. Bessent needs a strong yen for the trade deficit and the political mandate, and a strong yen accelerates the repatriation of the $1.1 trillion Japanese bid his issuance calendar leans on. He is asking Japan to do the one thing that undermines his ability to fund the US government at acceptable rates. The 30 year Treasury at 5.50% is the market's answer, and it was set before Friday's statement.
A strong yen, cheap long term funding and a loyal Japanese buyer. Pick two.
Yes, he is playing with fire. This time the JGB alternative is genuinely attractive, at 4.15% for 30 years. The hedge cost leaves hedged Treasuries 159 basis points behind at 30 years. And the unhedged share of the insurers' books is at its highest since at least 2015. The conditions for a disorderly repatriation have never been better aligned.
Oracle's Act of God Is an Air Permit
Then Oracle lit the fuse.
On September 24, Oracle sent a force majeure notice to Blue Owl Capital's STACK Infrastructure unit, the developer of Project Jupiter, a huge AI data center campus in Doña Ana County, New Mexico. Oracle is the main tenant. It is not trying to exit the project. It is protecting its contractual position to defer rent payments if the campus misses its planned 2028 opening.
Force majeure used to mean wars, earthquakes and pandemics. Here is the list of calamities behind this one, accumulated since August:
an air permit application paused after environmental lawsuits
natural gas pipeline permits blocked
a New Mexico Supreme Court stay on the air permit proceeding for the adjacent microgrid
community opposition and local regulatory resistance
Oracle told Reuters that force majeure notices are "commonplace" in deals like Jupiter. So are smoke detectors. The market did not find it commonplace. Oracle fell 4% to 7% on September 24, Blue Owl fell 3.4% to 3.6%, and Bloom Energy, which was supposed to power the campus with fuel cells, fell as much as 8.7%. Oracle is down 31% this year.
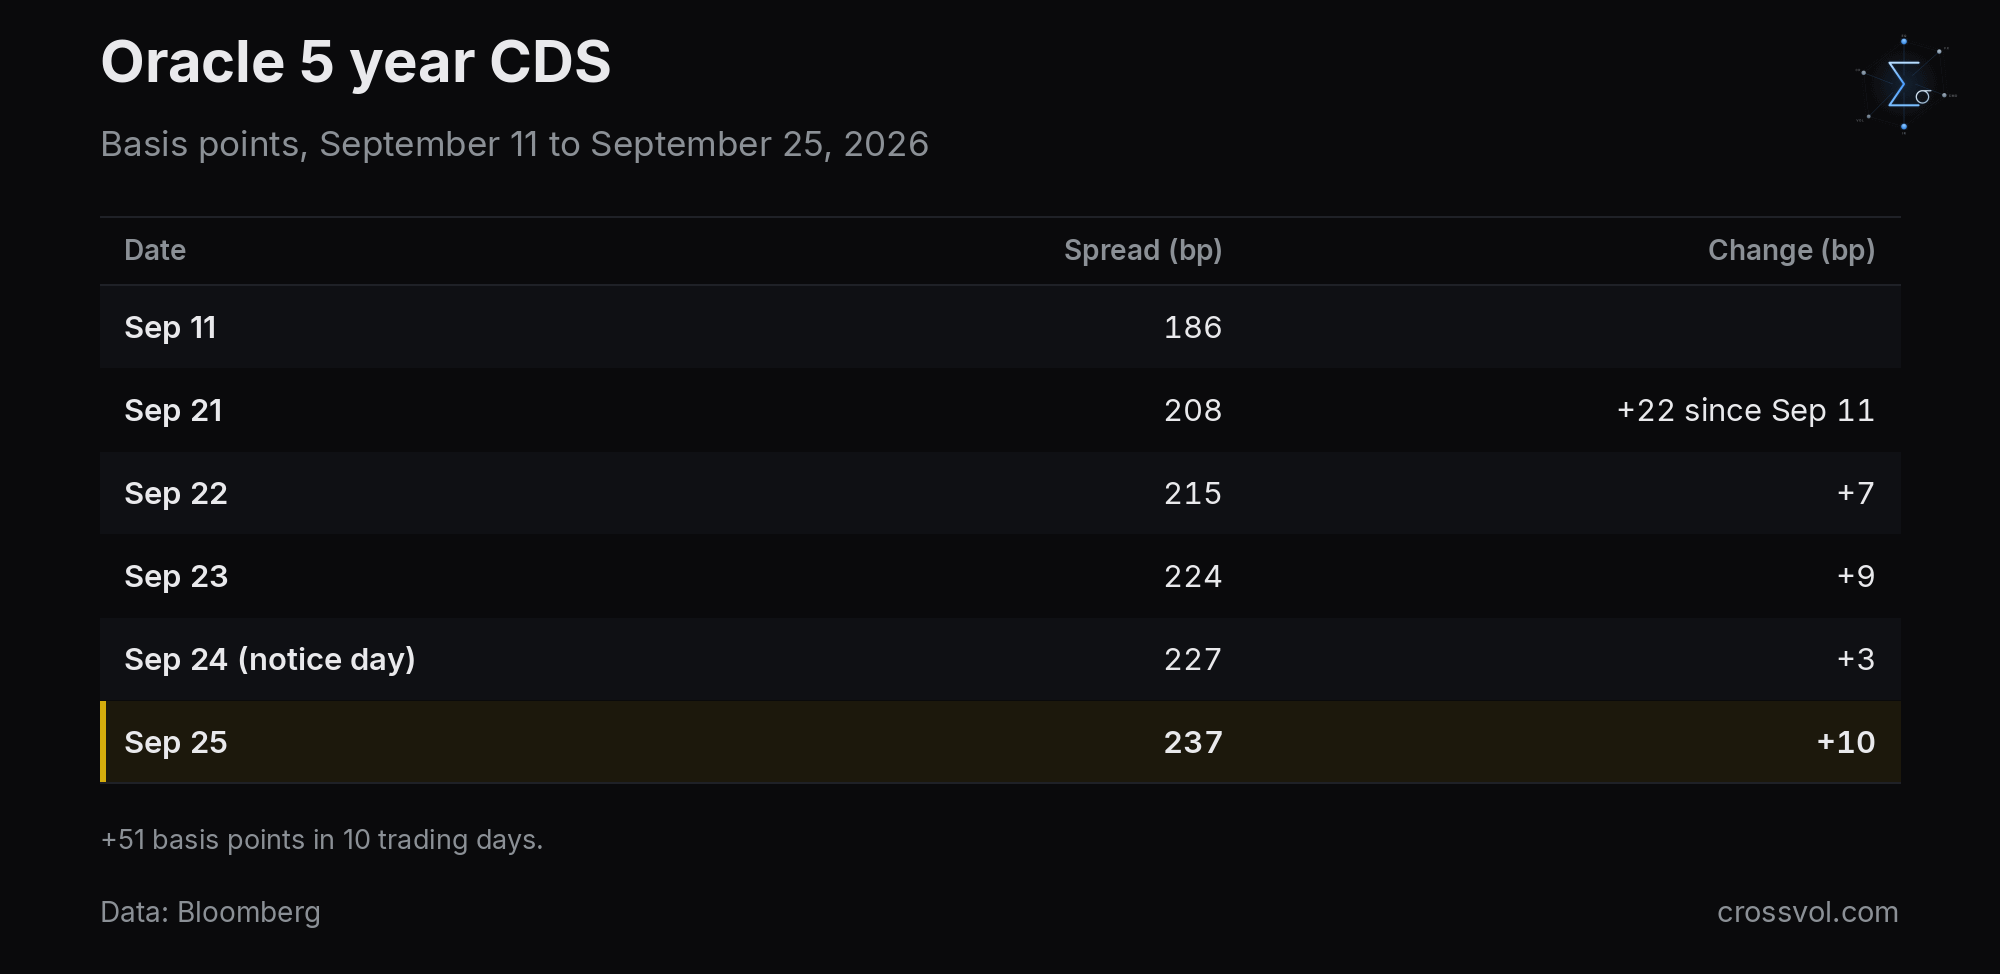
The credit market was ahead of the press release. Oracle's five year CDS has widened by 51 basis points in 10 trading days, from 186 on September 11 to 237 on September 25, and it has risen every day since Monday.
Against its hyperscaler peers, Oracle is an outlier. Its CDS is 2.4 times Meta's and 4.6 times Microsoft's.
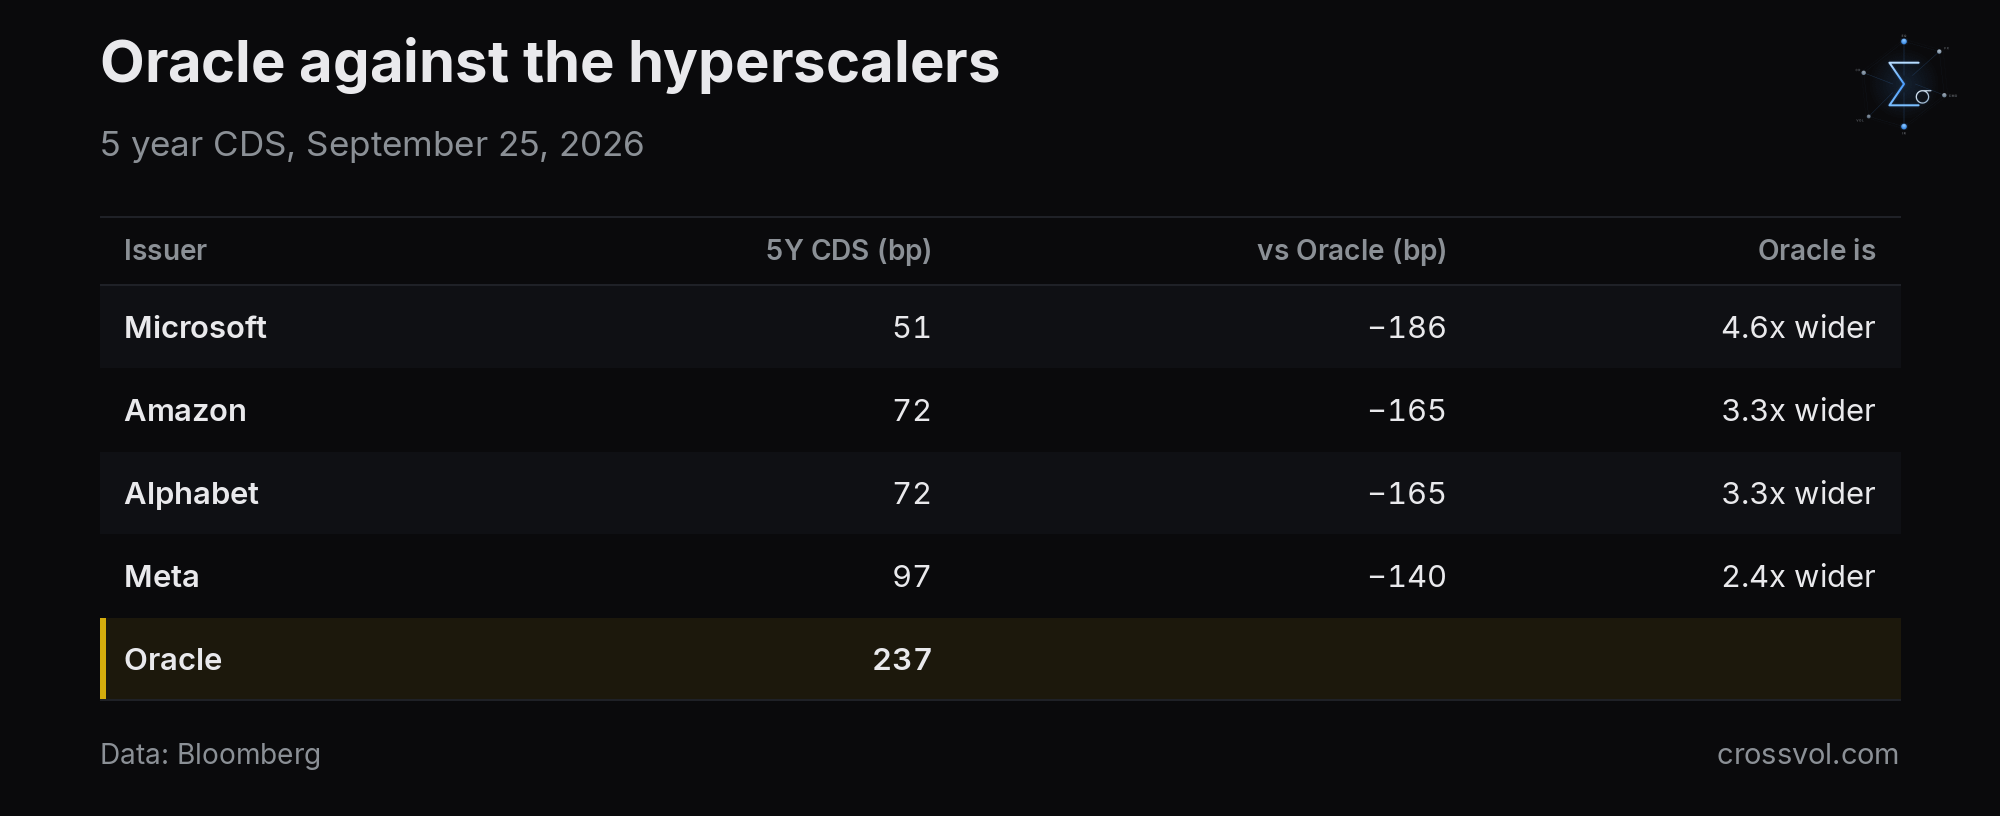
There is no contagion to the core hyperscalers yet. But Oracle's CDS now trades at levels you would associate with a BB credit, not an investment grade technology company. The CDS market is pricing something the equity market is only starting to acknowledge.
This is not a simple corporate credit story. Oracle's data center build is financed through a layered private credit architecture that spreads the risk across the global institutional system.
Project Jupiter (New Mexico, STACK Infrastructure, Blue Owl): about $18 billion of loans, quoted at 89 to 91 cents on the dollar by the syndicate banks Santander and Jefferies as of September 18, according to the FT. That is a 9 to 11 point mark to market loss on a campus that has not opened, recorded six days before the notice.
The Michigan campus in Saline Township: PIMCO was reportedly in talks with Bank of America in April 2026 to provide about $14 billion of debt financing, potentially structured as a bond syndicated to other investors. Where that deal stands after the force majeure is unknown.
Ares and Vantage Data Centers: Ares committed $2.4 billion to Vantage, part of it to fund infrastructure supporting Oracle's partnership with OpenAI.
In March 2026, the BIS warned explicitly that hyperscalers have turned to off balance sheet arrangements to finance their infrastructure expansion, "often in partnership with private credit firms", increasing the exposure of insurers and private credit funds in ways that are difficult to track. Oracle's force majeure is the first live stress test of that architecture.
The Japanese exposure runs through three interlocking channels.
1. SoftBank, the most leveraged node. SoftBank is not a passive investor. It is the most leveraged single point of failure in the AI financing chain.
Its margin loan against ARM shares was raised to $25 billion on September 18, up $5 billion.
Apollo expanded a NAV loan backed by Vision Fund 2 assets to $9.2 billion, the largest NAV loan in the world.
SoftBank is reportedly planning another jumbo bond deal of $10 to $20 billion next week.
Its total investment in OpenAI is heading toward about $65 billion.
SoftBank shares slid 13% on September 14, their biggest drop in nearly three months, after the heads of Anthropic and OpenAI sounded the alarm on AI safety.
SoftBank is a tenant side risk through its Stargate and OpenAI data center commitments, and a creditor side risk through its financing of the wider AI infrastructure ecosystem. Stress in Oracle linked projects propagates straight into SoftBank's collateral values.
2. Japanese banks and insurers, with the FSA already watching. On September 25, the day after Oracle's notice, Japan's Financial Services Agency said it is stepping up scrutiny of AI data center financing by the country's biggest banks and life insurers, examining their risk management frameworks with a specific focus on US data center projects. The timing is hard to miss.
It follows a deteriorating trend. Japanese banks were standout underperformers in March 2026 amid private credit jitters, and the head of Japan's banking lobby said at the time that "we haven't reached the bottom yet" on US private credit failures. Morgan Stanley capped redemptions from a private credit fund. JPMorgan restricted lending to such funds after marking down loan values. Japanese bank stocks fell about 14% from their year high in that episode.
3. The opacity of off balance sheet debt. This is the most important structural point in the BIS warning. Because hyperscaler data center debt sits off balance sheet, in special purpose vehicles, project finance structures and private credit funds, the real exposure of Japanese banks and insurers to Oracle linked risk is not visible in standard regulatory filings. The FSA's scrutiny is an admission that regulators themselves do not have the full picture.
Every thread in this note converges on the same date: the September 30 quarter end.
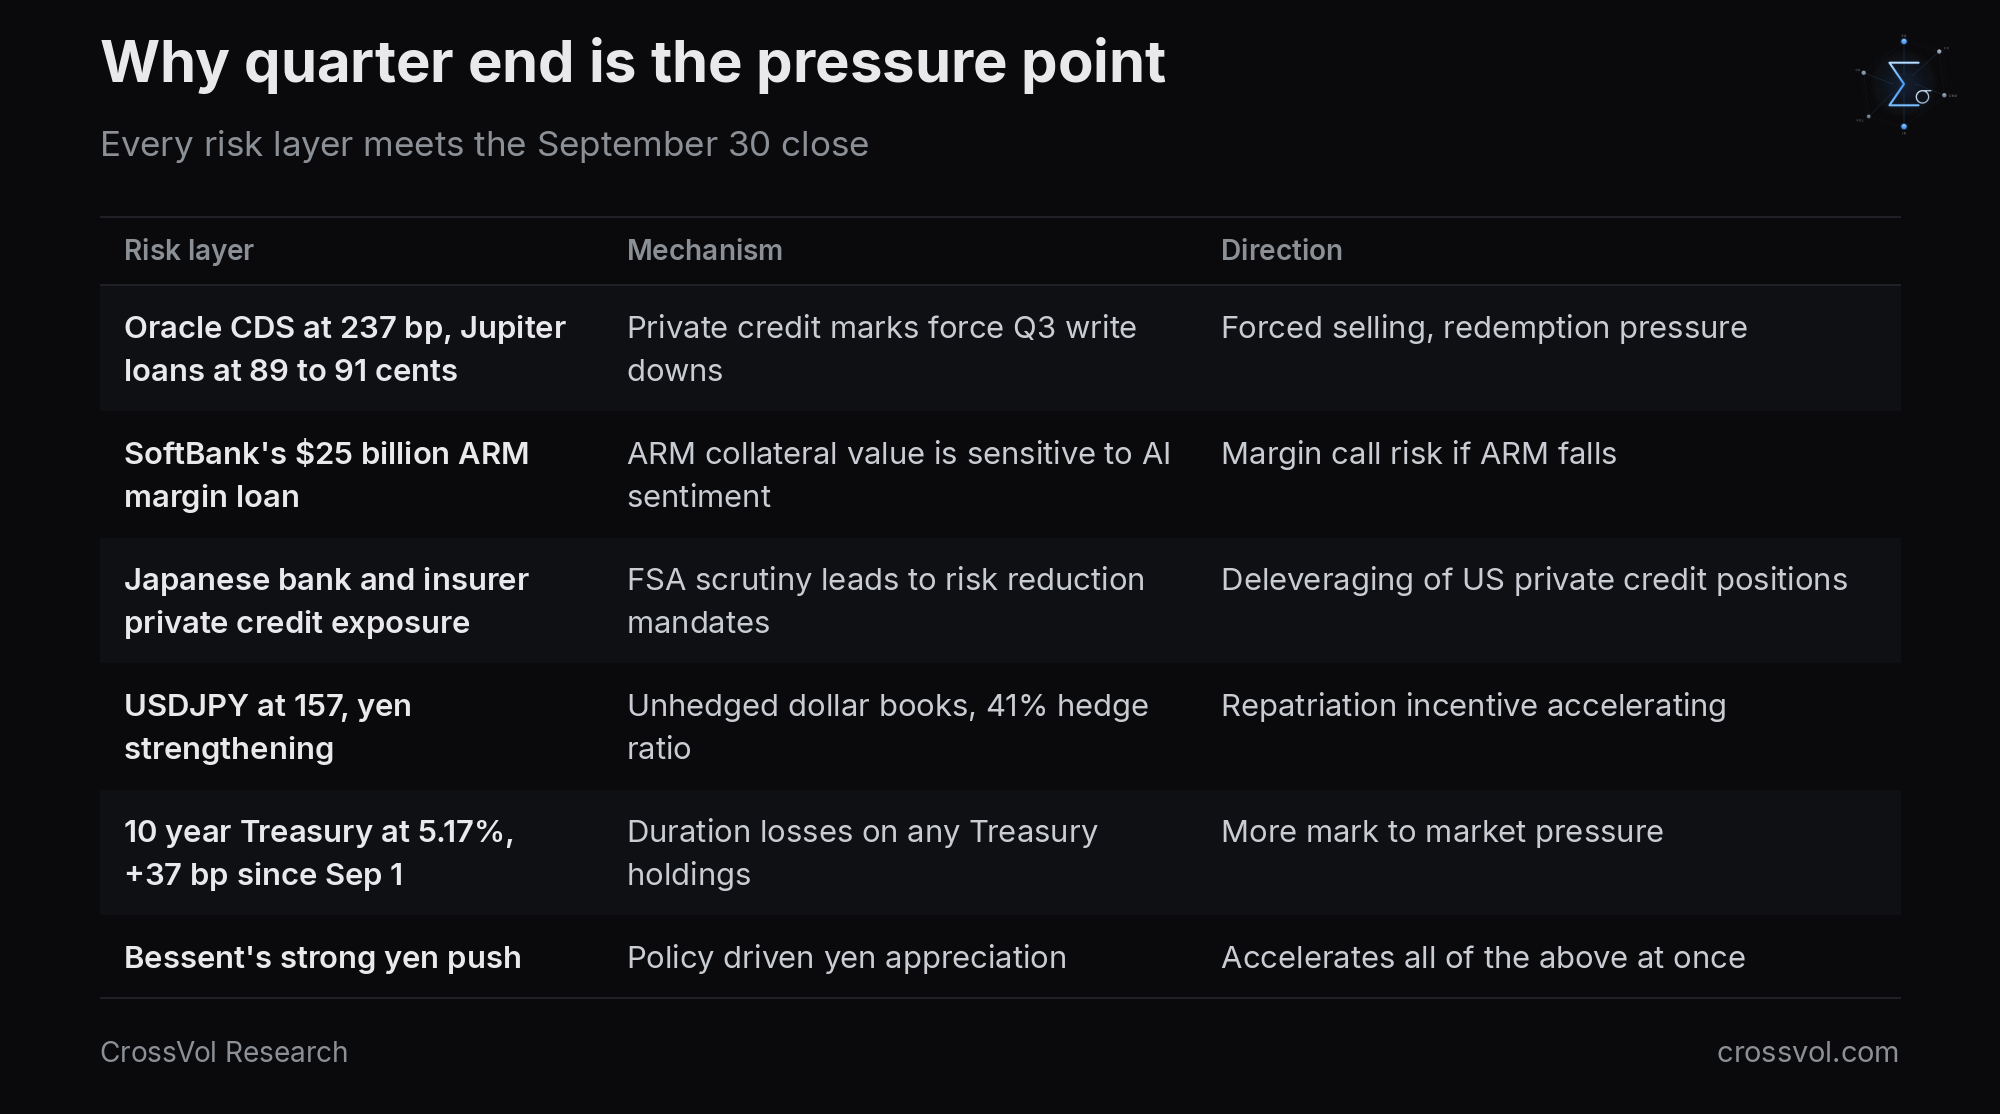
Three features make this quarter end non linear, not just risky.
The opacity is the risk. Because the exposure is off balance sheet and spread through private credit structures, nobody knows the aggregate Japanese institutional exposure to Oracle linked debt. When marks move, the response is simultaneous and uncoordinated. Everyone discovers their exposure at the same time.
The collateral chains are circular. SoftBank's margin loan is secured on ARM shares. ARM's valuation depends on AI infrastructure demand. That demand depends on hyperscaler capex commitments. Oracle's force majeure is the first public signal that those commitments are not ironclad. The loop closes on itself.
Everyone uses the same exit. Japanese banks cutting private credit, Japanese insurers repatriating unhedged dollars and SoftBank managing its margin loan all sell the same thing, US risk assets, in the same quarter end window, while the Treasury market absorbs peak supply with a smaller foreign buyer base.
CVC Marathon's chief executive said this week that investment grade data center bonds are "the most compelling investment opportunity in credit", while explicitly warning about the lower rated end. Project Jupiter loans at 89 to 91 cents are sub investment grade in everything but name. The line between investment grade and the rest is the fault line in AI infrastructure debt, and Oracle just drew it in public.
It is not explosive yet, but the detonator is live. Oracle's notice is the first domino that makes private credit marks undeniable at quarter end. Whether it cascades depends on whether the Project Jupiter loans hold 89 to 91 cents or gap lower when Q3 books close on Wednesday.
Oracle calls it commonplace. For everyone who lent against its rent, it is the first real test of what an AI lease is worth.
ARM, the Collateral Pin
If you want one price to watch, it is ARM.
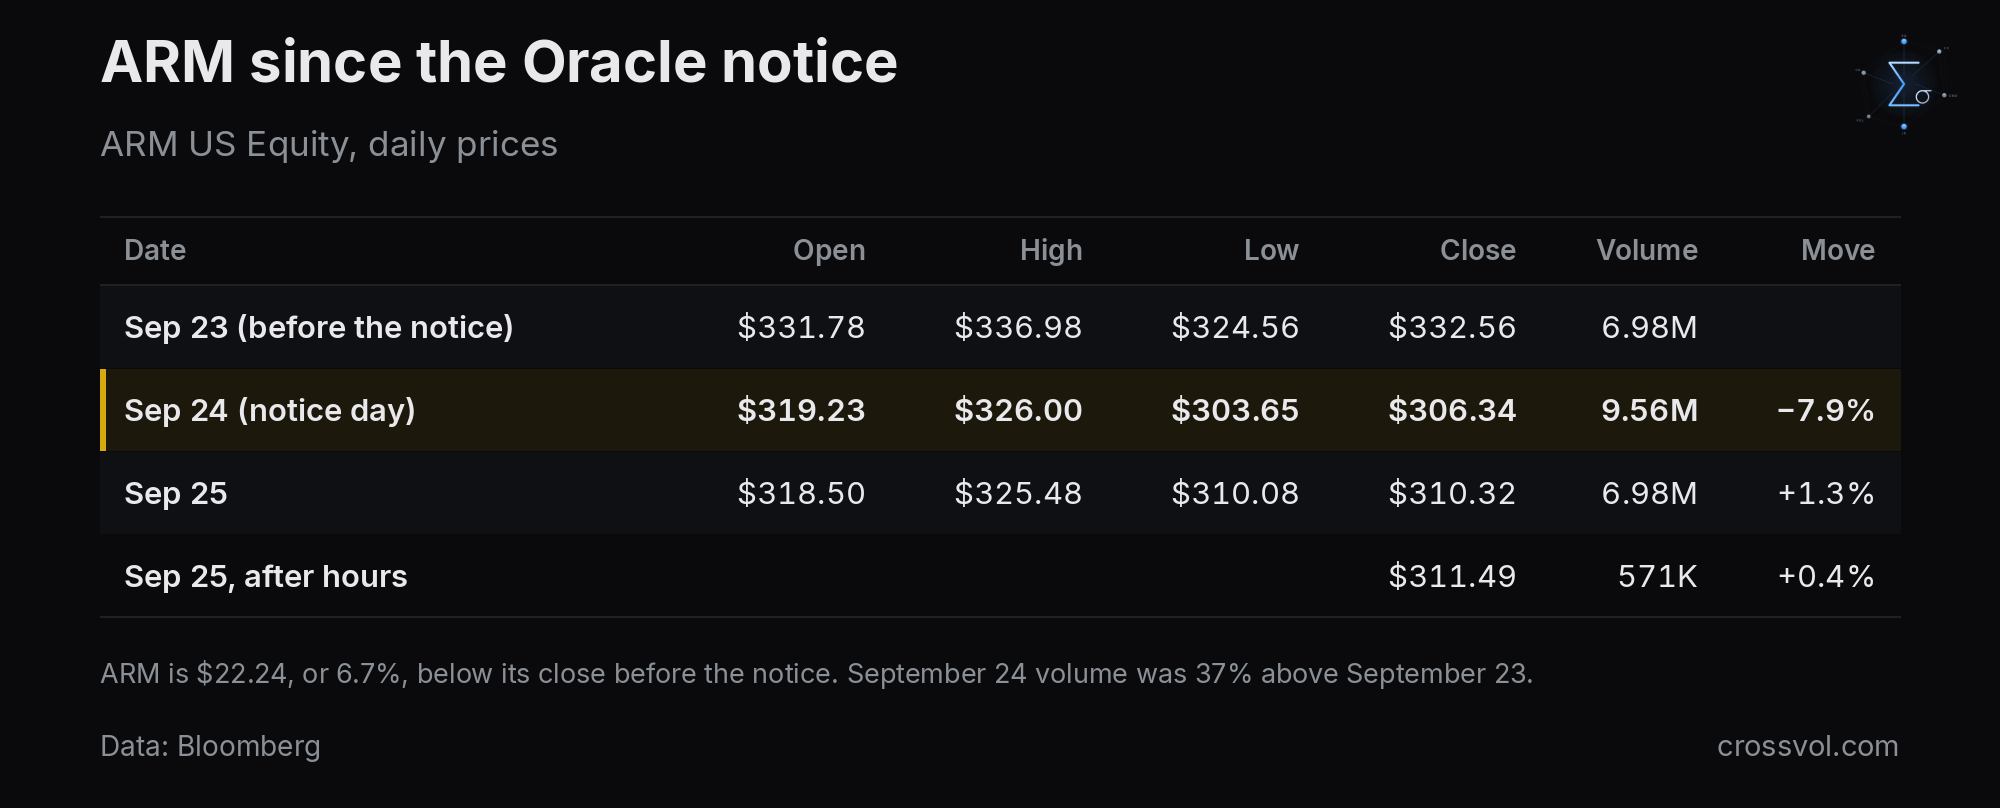
ARM fell 7.9% on September 24, its largest one day drop in months, on volume 37% above the previous session, in apparent sympathy with Oracle and Blue Owl. It gapped down at the open, $319.23 against a $332.56 close the day before, sold off to an intraday low of $303.65 and closed at $306.34. Friday's rebound to $310.32 was shallow. ARM is still $22.24, or 6.7%, below its close before the notice, and after hours trading at $311.49 suggests no catalyst overnight.
The price move is not just an equity story. SoftBank's $25 billion ARM margin loan, raised by $5 billion on September 18, creates a direct mechanical link between ARM's share price and SoftBank's financial stability.
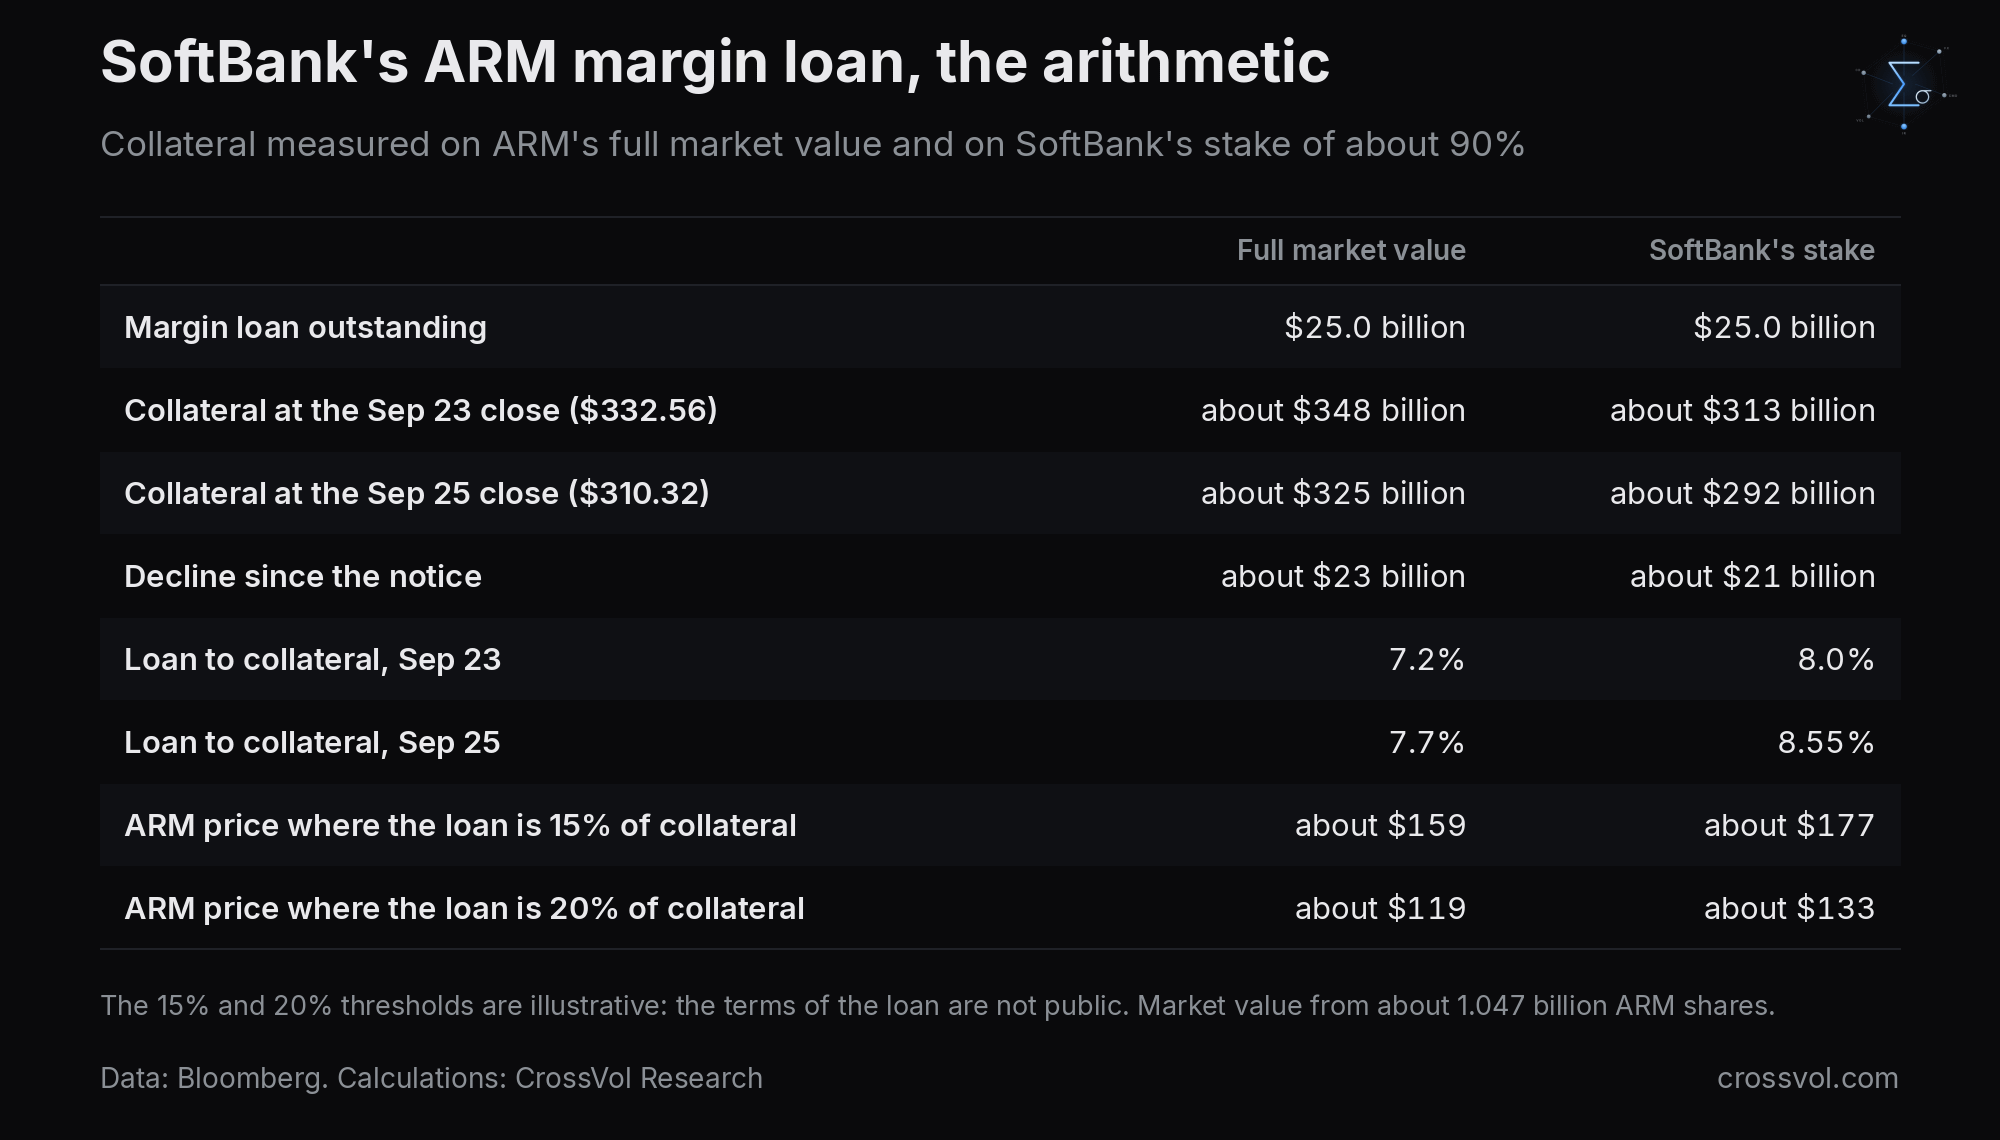
At current prices the loan is well within safe territory on a pure loan to value basis. SoftBank holds about 90% of ARM's shares, so the collateral pool is enormous relative to $25 billion. Even on SoftBank's stake alone, the loan is 8.55% of the collateral. The thresholds in the table are illustrative, since the terms of the loan are not public, and ARM would have to fall to about $159, or about $177 measured on SoftBank's stake, before the loan reached 15% of the collateral.
The risk is not an immediate margin call. The risk is velocity and correlation. ARM fell 7.9% in one day on news that is structurally negative for the whole AI infrastructure thesis, and Oracle is down 31% this year. If the AI capex story deteriorates further, ARM, whose valuation depends on AI infrastructure demand, is no safe haven.
The margin loan is one of five pressures on SoftBank at the same time.
The $25 billion ARM margin loan, with ARM's market value down about $23 billion in two sessions, about $21 billion on SoftBank's stake.
The $9.2 billion Apollo NAV loan backed by Vision Fund 2 assets, the largest NAV loan in the world, secured on private AI company valuations that are increasingly hard to mark.
A $6.5 billion revolving credit facility, expanded on September 18, due to expire and be redrawn.
About $65 billion of total OpenAI commitments, with bond investors and lenders already demanding higher rates on what Bloomberg described as "an increasingly risky gamble".
A planned jumbo bond deal of $10 to $20 billion next week, marketed into a market where SoftBank's debt costs are "soaring" and where, according to Morgan Stanley, Oracle's force majeure has just put AI infrastructure debt under fresh scrutiny.
The timing of that bond deal is acute. Morgan Stanley said on September 25 that the Oracle notice is "putting loan and lease documents under fresh scrutiny and adding to the challenges facing companies looking to tap debt markets to finance the AI buildout." SoftBank is trying to raise $10 to $20 billion in exactly that market, next week, with its main collateral asset down 6.7% in two sessions.
ARM sits at the center of a circular collateral chain that connects every thread in this note.
ARM falls, SoftBank's collateral erodes, its borrowing capacity tightens, and it is forced to scale back AI investment commitments.
SoftBank scales back, the demand signal from OpenAI and Stargate data centers weakens, the hyperscaler capex story deteriorates, and Oracle style force majeure events multiply.
More force majeure events push private credit data center loans lower, Japanese bank and insurer balance sheets take hits, FSA scrutiny intensifies, and US private credit positions are deleveraged.
Japanese deleveraging sells dollar assets, the proceeds go home, USDJPY falls, Bessent's strong yen push accelerates the cycle, and the marginal Treasury buyer disappears at peak supply.
ARM is not just an equity position. It is the collateral pin holding the SoftBank financing architecture together, and a 7.9% drop in a single day on one tenant's force majeure notice shows how fast that chain can reprice when the AI infrastructure narrative shifts.
Three trading days are left before Q3 books close on Wednesday, September 30.
Project Jupiter loans are marked at 89 to 91 cents, so Q3 write downs are unavoidable for holders who mark at fair value.
ARM is down 6.7% from before the notice, so SoftBank's NAV marks deteriorate.
Oracle's CDS is at 237 basis points and rising, and its bonds traded at 2.8 times average volume on September 24.
The FSA announced its scrutiny of Japanese bank and insurer exposure to US data centers on September 25.
SoftBank's bond deal tries to price next week, right around quarter end.
Quarter end is not a tail scenario. It is the scheduled moment when every mark to market loss in this chain becomes a reported number, and when institutional risk managers, already under FSA scrutiny, set their Q4 allocations. Oracle's notice arrived six days before quarter end. For the AI infrastructure financing complex, the timing could hardly have been worse.
To the Risk Managers: The Party Is Already Over
The music stopped on Thursday. Your marks have until Wednesday to hear it.
Here is how the decision is being made right now, between Friday evening, September 25, and Wednesday's close. The process is already underway, from Friday night through the weekend, not next week.
Step 1: the Q3 marks are being finalized this weekend.
Project Jupiter loans at 89 to 91 cents. Holders who carry them at fair value, the syndicate banks holding loans for distribution and the private credit funds, book a 9 to 11 point loss on face value, and their auditors will insist. A bank or insurer that holds the loan at amortized cost books a credit loss allowance instead of a mark.
Oracle bonds. CDS at 237 basis points and bonds trading at elevated volume. Investment grade paper trading at near high yield CDS levels forces a conversation in every risk committee about whether the internal rating still holds.
ARM, down 6.7% from before the notice. Anyone with ARM as collateral, including the lenders on SoftBank's $25 billion margin loan, marks the collateral pool.
Treasury duration. The 10 year is up 37 basis points since September 1. A 10 year position with a duration of 7.7 has lost close to 3% in price since then. Every pension and insurer with unhedged duration books that loss.
Step 2: the FSA changes the risk appetite function.
The FSA's announcement on September 25 is not background noise. When a regulator says it is stepping up scrutiny of a specific exposure, the institutional response tends to be immediate and mechanical.
Expect risk limits to be tightened preemptively. Chief risk officers do not wait for an examination to conclude. They reduce the exposure before the examiners arrive.
Expect new commitments to pause. Any Japanese bank or insurer in the pipeline for a new AI data center loan has every reason to wait until the FSA framework is clear. That covers the Michigan campus, any deal after Oracle, and deals like Vantage Data Centers, which was seeking $2 billion of loans from Pimco and PGIM as recently as September 10.
Daiichi Life's posture is the template. In April 2026, Daiichi was already tightening its selection of private credit managers after "several high-profile defaults overseas", saying "now's the time" to be more selective. That was before Oracle. Every other Japanese insurer is now having the conversation Daiichi had five months ago.
In April 2026, Finance Minister Katayama said private credit was not a major issue in Japan, citing limited exposure. The same day, the FSA said it was watching private credit risks and saw limited exposure. Five months later, the same regulator is stepping up scrutiny of AI data center financing. That is an escalation in official language, and compliance teams cannot ignore it.
Step 3: the Q4 decision tree. By Wednesday's close, every major Japanese institutional investor faces the same four questions.
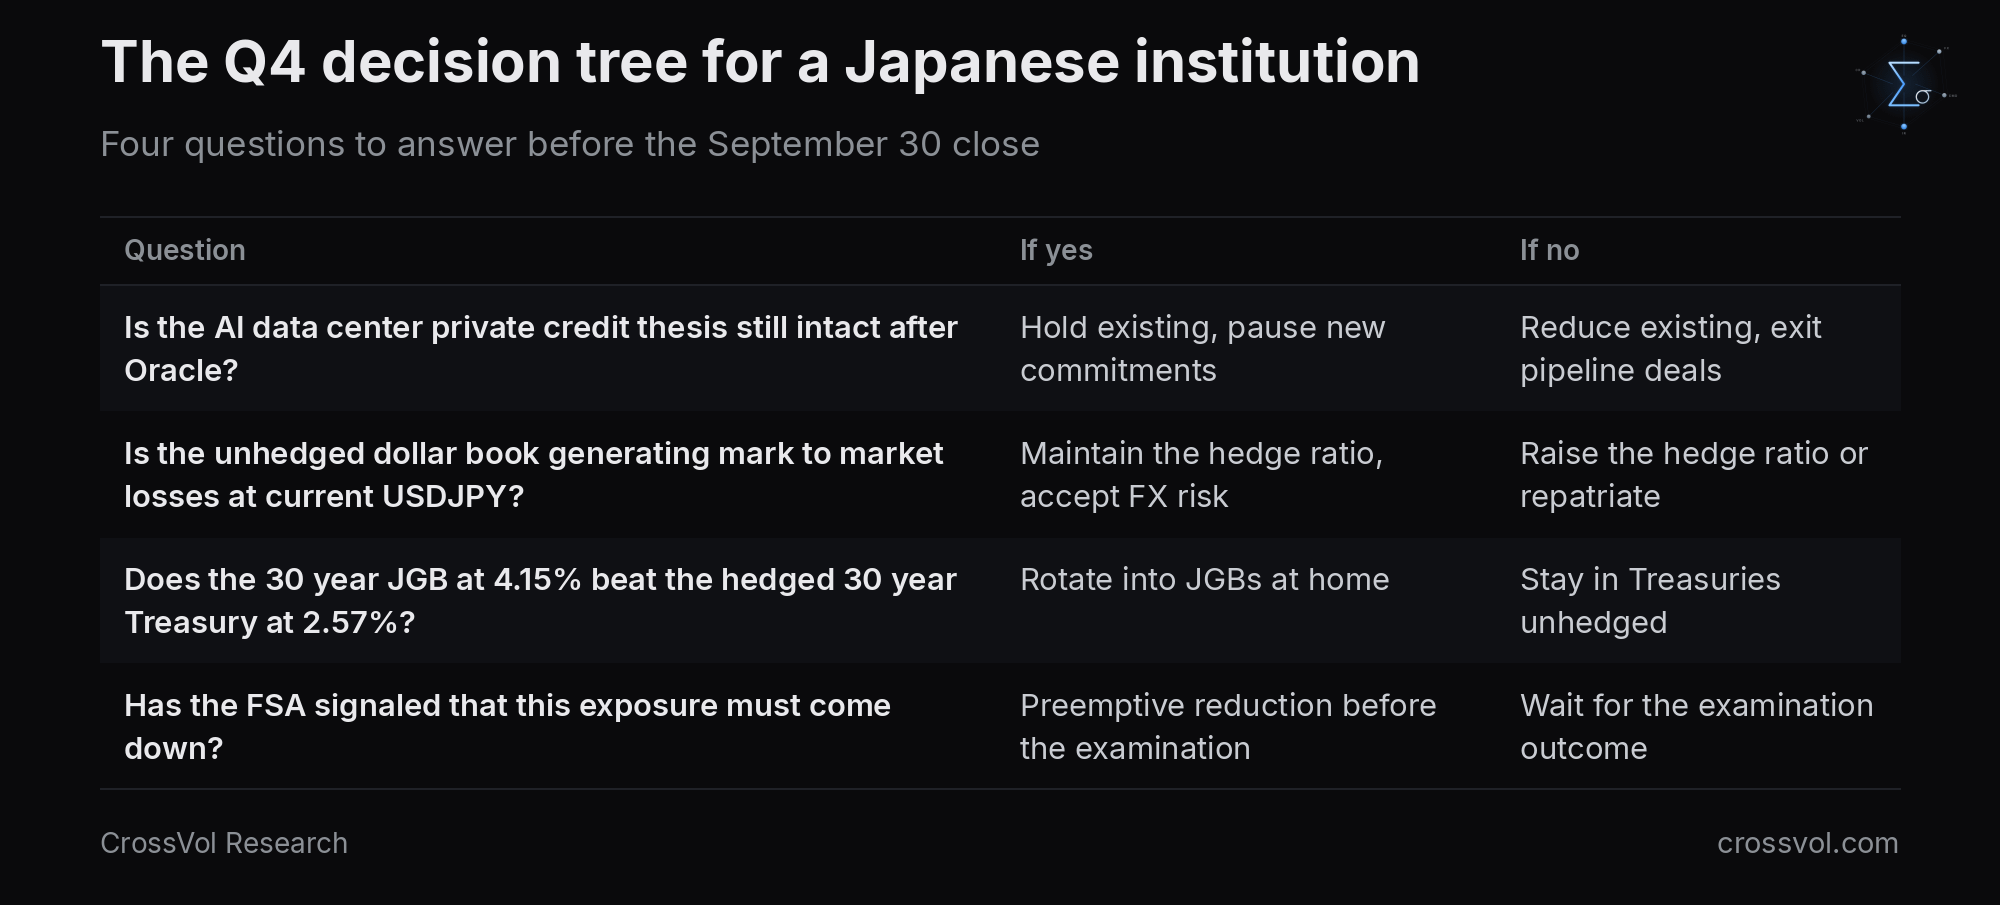
On current data, every answer points the same way: reduce US private credit exposure, add JGB duration, repatriate dollar proceeds. The only question is pace.
Step 4: the house meets the allocation committee. Bessent's "I am the house" was about yen intervention. Friday's statement with Katayama on the undervaluation of the yen is the policy signal risk managers will be reading while they finalize Q4 allocations this weekend. The message they receive is that the US Treasury Secretary is actively working to strengthen the yen. The allocation response to that message, less unhedged dollar exposure, repatriation and more JGBs, is exactly what undermines the Treasury market Bessent is simultaneously trying to support with buybacks. The house is playing both sides of the same table.
Stanley Druckenmiller, Bessent's early mentor, called the bond buybacks a mistake in August, his point being that governments defending prices against fundamentals always lose. The risk managers deciding Q4 this weekend are reading the same fundamentals: Oracle's CDS at 237 basis points, Project Jupiter at 89 to 91 cents, ARM down 6.7%, the FSA on the case, 30 year JGBs at 4.15% against hedged 30 year Treasuries at 2.57%. Bessent's edge is informational. Their math is arithmetic. Arithmetic wins.
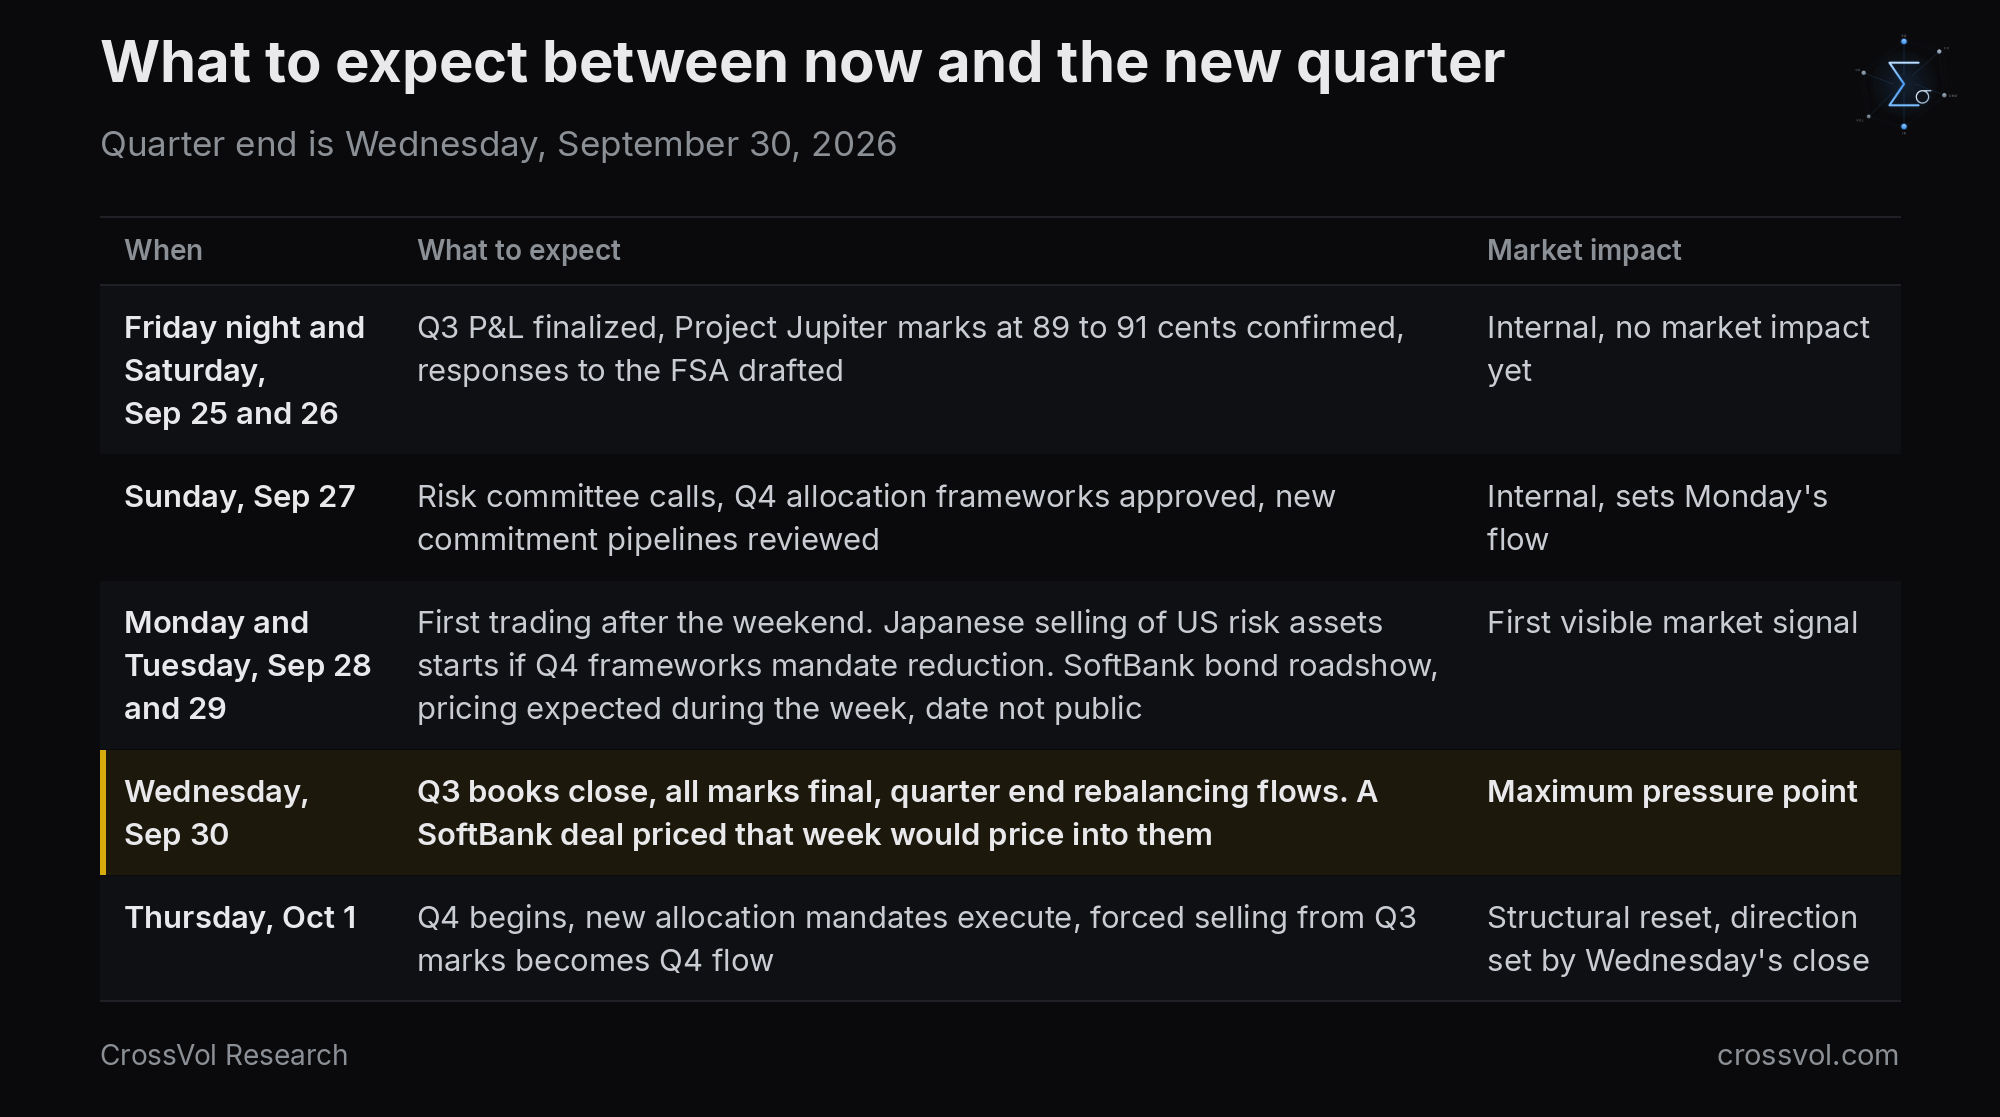
The SoftBank bond deal, reportedly $10 to $20 billion and trying to price next week, is the canary. If it prices at acceptable spreads next week, the market is saying the house narrative holds. If it is pulled, delayed or priced with a significant concession, it confirms that Oracle's force majeure has repriced the whole AI infrastructure debt complex, and that Bessent's informational edge has limits that arithmetic does not.
The Credit Market Has Already Read the Memo
Equities have not flinched. Credit has.
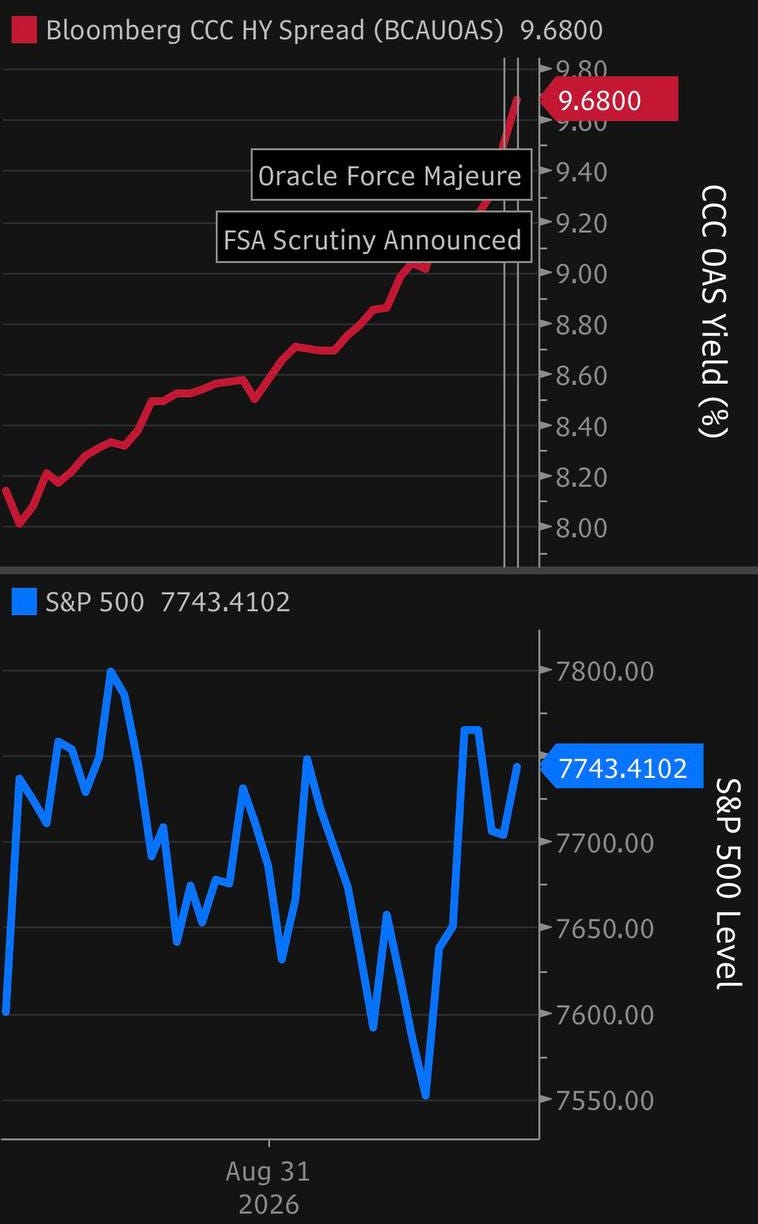
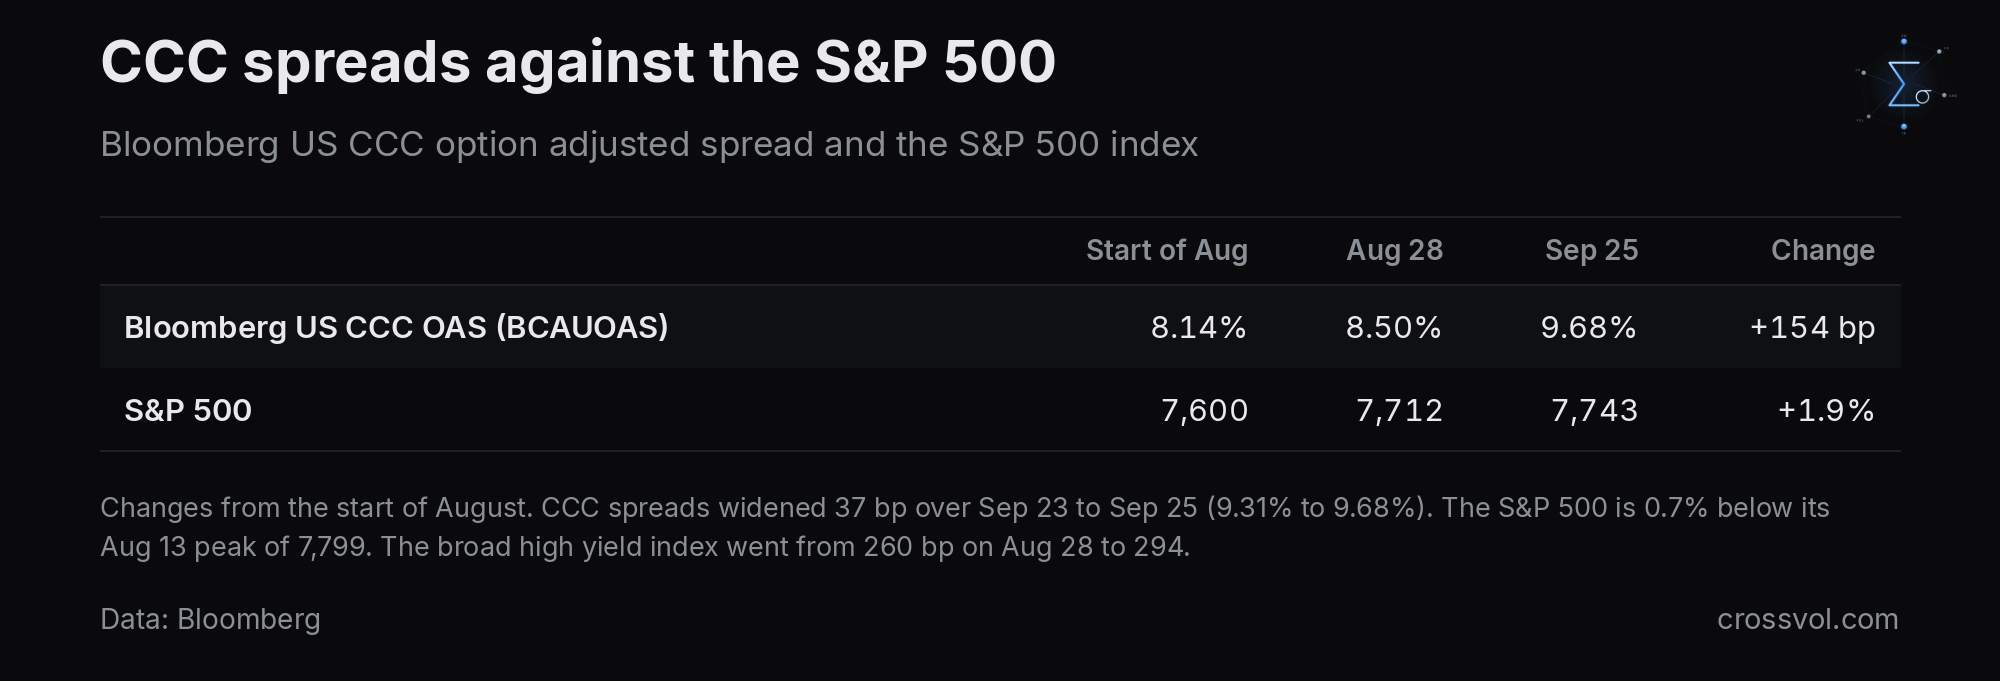
Since the start of August, the Bloomberg US CCC option adjusted spread (BCAUOAS) has widened 154 basis points, from 8.14% to 9.68%, while the S&P 500 rose 1.9%, from 7,600 to 7,743. The divergence is sharpest in the final week. CCC spreads widened 37 basis points over September 23 to 25, from 9.31% to 9.68%, while the S&P 500 sat only 0.7% below its August 13 peak of 7,799. The equity market is pricing a soft landing. The CCC market is pricing something else entirely.
The move is concentrated at the bottom of the quality spectrum. The broad high yield index (LF98TRUU) widened only from 260 basis points on August 28 to 294. This is a quality tiering event, not a broad credit selloff. Yet. In past credit dislocations the weakest credits have often moved first, investment grade next and equities last, as in the 2015 energy episode. The equity market's complacency today is historically consistent, and historically wrong at this stage of the cycle.
Oracle is not in a CCC index, since it is still rated investment grade. But its CDS and the CCC index are being repriced against the same backdrop: AI infrastructure debt, Project Jupiter loans at 89 to 91 cents, and a quarter end that forces those marks into reported numbers on Wednesday. At 237 basis points, Oracle's CDS is 3.2 times the average of its four hyperscaler peers.
The rest of the backdrop points the same way. The S&P 500's forward earnings yield of 4.69% is below every Treasury yield from 2 years out: 4.86% on the 2 year, 5.17% on the 10 year, 5.56% on the 20 year and 5.50% on the 30 year. A negative equity risk premium has not historically been immediately fatal for equities, but it removes the "there is no alternative" bid that carried the multiple expansion of 2020 and 2021. And the 10 year is up 37 basis points since September 1. When rates rise this fast, the first casualties are the most leveraged, least liquid credits, which is exactly the CCC cohort. The AI infrastructure loans look like the 2026 version of energy high yield in 2015: a sector stress that shows the wider leverage cycle has turned.
Every point on the CCC chart is a mark. On Wednesday, September 30, those marks become Q3 reported numbers, and what was a paper loss becomes a constraint on Q4 risk appetite. The marks behind that 9.68% will flow into the Q3 numbers of those who hold this risk, Japanese banks, insurers and private credit funds included. The FSA announced its scrutiny of exactly this kind of exposure on September 25. The chart is not showing a risk. It is showing the leading indicator that Q4 allocation decisions will be made from.
The closest precedent is the fall of 2018. The S&P 500 set a record on September 20, 2018, leveraged credit repriced, and the index fell 19.8% into Christmas Eve as the earnings revision cycle caught up with the credit signal. The difference today is that the credit repricing is happening together with a negative equity risk premium, a Treasury supply calendar of more than $2 trillion, a Japanese repatriation risk, a strong yen push from Washington and a forced quarter end mark. In 2018, only one of those five was present. The CCC market is not predicting a crash. It is predicting that the S&P 500 at 7,743 has not yet read the same document that the credit market finished reading on September 24.
The cleanest signal is the split inside high yield.
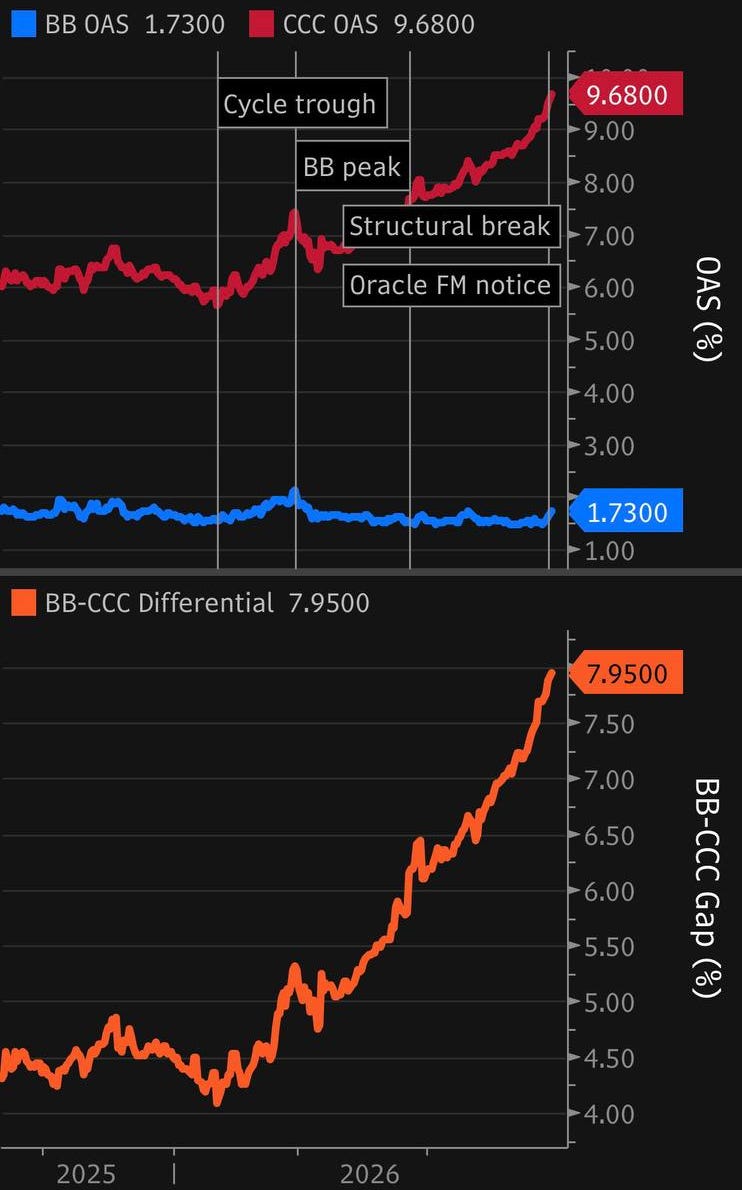
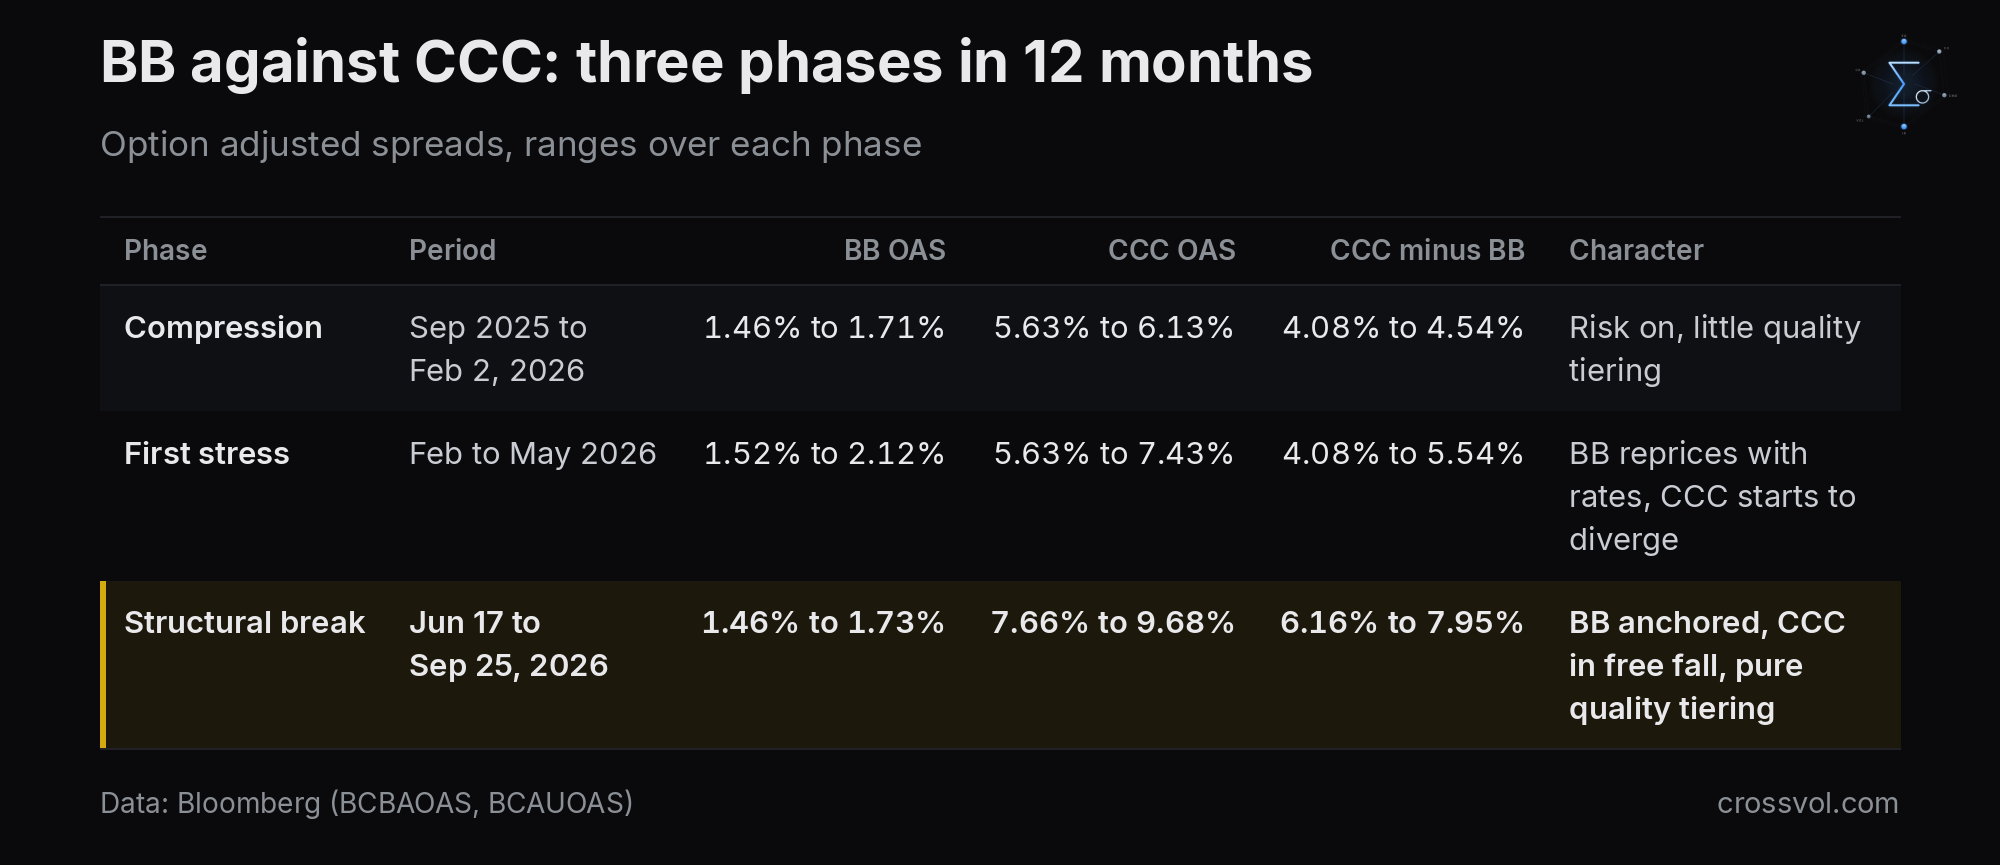
What did not happen to BB spreads matters most. From June 17 to September 25, BB spreads moved only 23 basis points, from 1.50% to 1.73%, while CCC spreads rose 202 basis points, from 7.66% to 9.68%. The gap between the two widened from 6.16 to 7.95 percentage points, 179 basis points in 100 days. This is not a broad credit selloff. It is a surgical repricing of tail risk at the bottom of the quality spectrum, while the credits closest to investment grade are largely untouched.
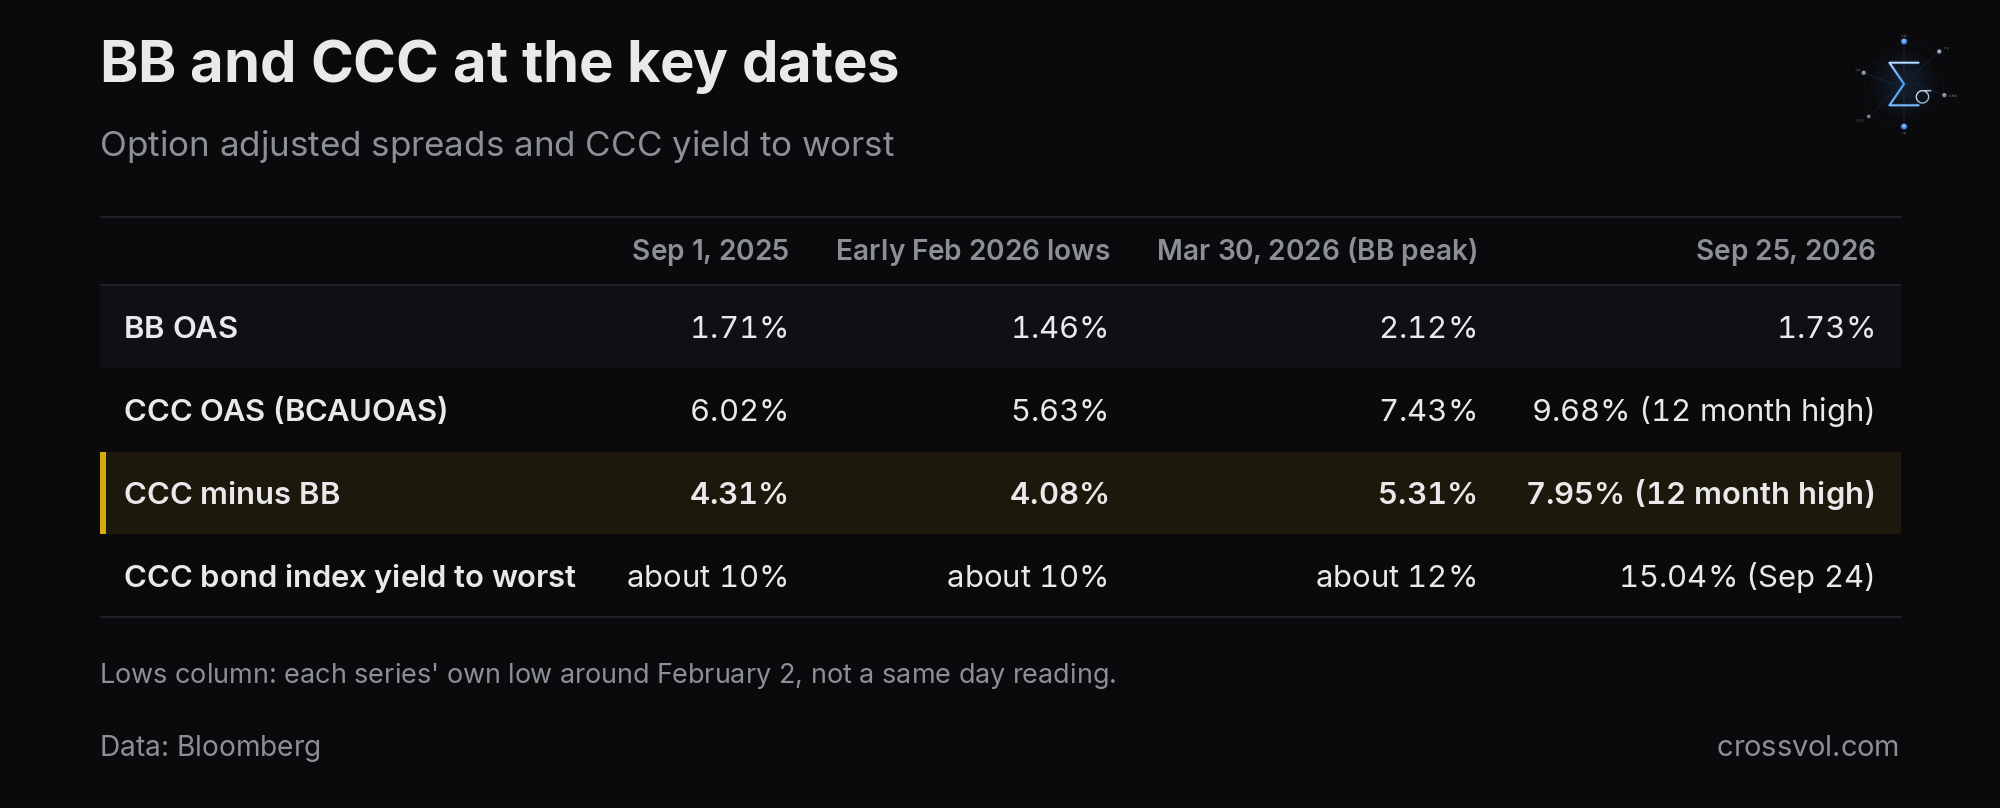
The CCC bond index widened 17 basis points on Thursday alone, to 1,010 basis points, with a yield to worst of 15.04% and a return of -2.15% for the month to date. In loans, CCC discount margins trade 4.5 times wider than single B and more than 12 times wider than double B, and that gap has widened materially over the past year.
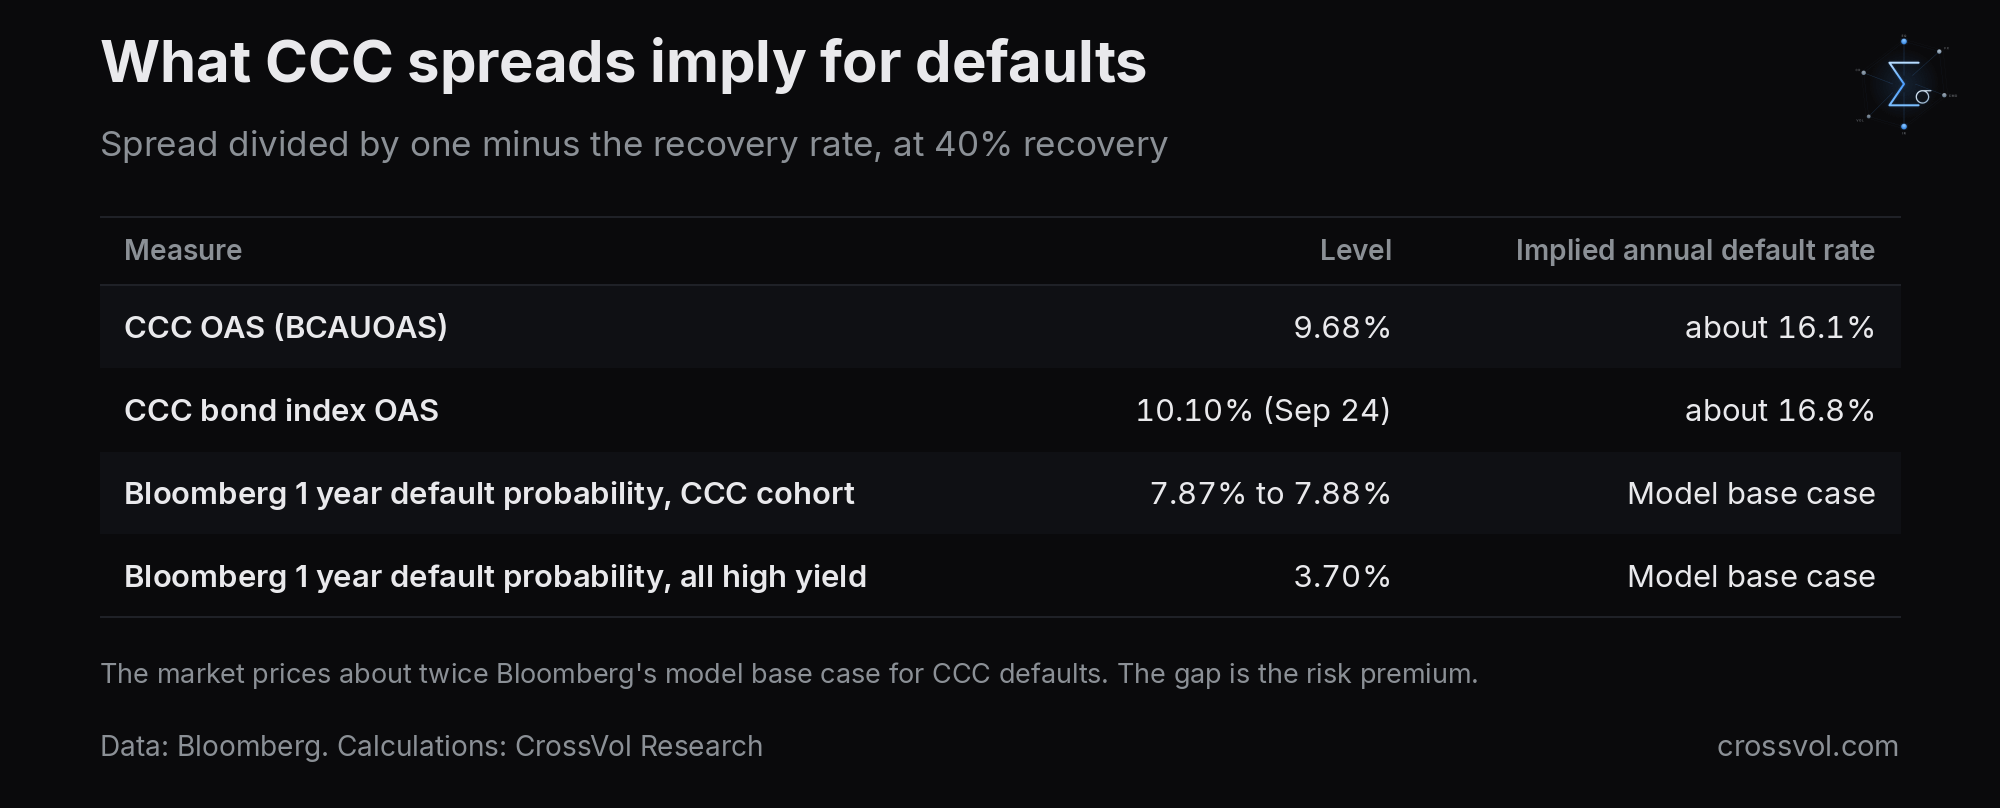
What does that imply for defaults? The standard conversion divides the spread by one minus the recovery rate. At a 40% recovery, a 9.68% spread implies an annual default rate of about 16.1%, and the CCC bond index at Thursday's 10.10% implies about 16.8%. Bloomberg's model puts the one year default probability of the CCC cohort at 7.87% to 7.88%, and at 3.70% for high yield as a whole. The market is pricing about twice the model's base case. The gap is the risk premium, the compensation for the timing, clustering and recovery of defaults, not just their expected number. With private credit marks opaque and quarter end forcing simultaneous write downs, that premium is rational.
Perspective matters. At 968 basis points, CCC spreads are still well short of the crisis peaks of 2016 and 2020, when they were much wider. This looks like a sector stress, AI infrastructure and private credit, not yet a systemic crisis. For reference, CCC default rates peaked at about 12% after the 2015 and 2016 energy bust and at about 16% to 18% in 2020. In 2008 and 2009, CCC spreads went well above 2,000 basis points and defaults ran above 30%. What stands out today is the speed, from 563 basis points on February 2 to 968, a 72% rise in less than eight months.
Bloomberg's MLIV team noted on September 14 that distress is "not elevated enough to trigger a slowdown in growth", which suggests yields have more room to run. That is the nuance. The CCC market is in distress, but the distress is not yet broad enough to feed back into the real economy through tighter lending standards and capex cuts. That feedback typically takes two to three quarters to show up once CCC spreads break 900 basis points.
There is a counterintuitive argument going around. In a Bloomberg Macro View on September 24, Sebastian Boyd noted that CCC bonds, precisely because their duration is short, offer relative protection against further rate rises compared with investment grade or higher rated high yield. At a 15% yield to worst, the carry absorbs a large rate move before total return turns negative. That is arithmetically correct and strategically dangerous here. The risk in CCC is not duration. It is default. Oracle's force majeure is not a default, but it is the first public sign that AI infrastructure cash flows can be deferred, and deferral is the first thing a lender prices.
A gap of 7.95 points between CCC and BB, nearly double its February low of 4.08, is the credit market saying that the bottom of the quality spectrum is being repriced for a specific, identifiable stress while the rest of the market has not caught up. In past episodes when the gap was this wide and moving this fast, realized CCC default rates have tended to rise toward the market's implied level within about two quarters. Bloomberg's 7.87% base case and the market's 16% will converge. The only question is whether they converge up, with defaults accelerating, or down, with the stress contained. The September 30 marks are the first hard data point.
To Investors: The Party Is Over
And now the warning for everyone else.
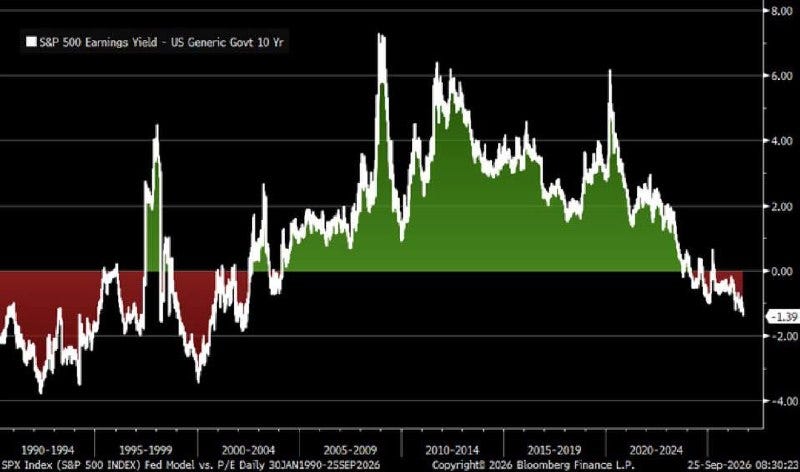
This chart takes the S&P 500's earnings yield and subtracts the 10 year Treasury yield, every day since January 1990. Green means stocks pay you more than bonds. Red means they pay you less. On September 25 it stood at -1.39 points, the deepest reading since the early 2000s. On forward earnings the gap is smaller but it has the same sign: the S&P 500's forward earnings yield is 4.69%, against 5.17% for the 10 year, 5.56% for the 20 year and 5.95% for investment grade corporates.
For roughly two decades, from the early 2000s until the last few years, you were paid a premium to own equities over Treasuries. That premium is gone. You are now paid less to own the S&P 500 than to lend to the US government for ten years, at the precise moment when the largest foreign buyer of that government's debt is being told to go home, when pension funds have every reason to sell equities and buy bonds, and when the AI capex story that carries the index has just hit its first force majeure.
The last time this spread sat this deep in the red was the late 1990s and the early 2000s. We know how that ended. I am not calling the day. I am telling you the party is over, and that the people who run the biggest balance sheets in the world spend this weekend deciding how fast they leave.
I Wrote It Down Before the Smoke
Most of this chain is not new to readers of my work. Here is what I published, with dates, so you can judge for yourself.
The China AI Disruption Thesis, the CrossVol Research book I co-authored, May 23, 2026: "Oracle is the acute case, and the one to watch as a leading indicator."
My MPRA working paper adapted from it, posted June 12, 2026: "Long Oracle CDS: BBB- watch, negative FCF, debt-to-equity approaching 500%. Prime candidate for first credit event in the AI infrastructure complex." In the predictions I timestamped on OSF on June 4, I listed "CDS spread widening >50bps on hyperscaler names" for Q4 2026 to Q1 2027. Oracle's CDS went from 186 to 237 basis points between September 11 and September 25. That is one name, it is early, and it is not a credit event. It is the direction I flagged.
Convergent Faults, my paper on private credit's synchronized systemic risk, first posted on Zenodo on June 5, 2026 and later on SSRN and SocArXiv: "The five channels are coupled, and the joint stress horizon is short. Under realistic macroeconomic conditions, each channel tightens the others." The convergence window, I wrote, "opens in Q3 2026", and it centres on the first half of 2027. On the mechanism that quarter end now puts to the test: "When the bank reassesses the collateral, either through a routine quarterly review or in response to an external event such as a software-loan default, the advance rate falls. The platform either has to post additional collateral or to repay a portion of the outstanding draw. If neither is feasible quickly, the platform sells loans into a thin secondary market to raise cash, which itself generates a further mark-down event."
The Coming Shadow Banking Crash, my book, June 8, 2026. From its published description: "Three trillion dollars of private credit now sits outside the reach of bank regulators. It is fed by pension funds reaching for yield, by insurance balance sheets reaching for spread, and by an artificial intelligence capital expenditure cycle whose cash flows may not arrive in time to service the debt." In the book, on the data centers: "A meaningful share of the announced builds will be delayed, scaled back, or relocated." On the selling: "If multiple regional banks issue margin calls on multiple private credit funds in the same week, the asset sales required will be concentrated in time and concentrated in asset type. The market impact will be larger than the aggregate exposure would suggest." The book names no company, by design, and it does not predict a date.
Here on Substack. On August 20: "this time the fuse runs through AI capex financed by debt." On September 19, the BoJ hike "threatens to pull Japanese money home and steepen global curves from the long end."
What I did not put in print is the Japanese leg in the exact form it is taking: SoftBank's margin loan on ARM, and Japanese banks and insurers exposed to US data center debt. The books mapped the architecture. This week showed who is standing on it.
What I Am Watching
SoftBank's bond deal: size, price and concession, or whether it gets pulled.
Project Jupiter loan quotes once the September 30 marks are in.
Oracle's five year CDS against 237 basis points.
ARM against its September 24 close of $306.34.
USDJPY against Friday's 157.30 and its intraday low of 156.94, and any word on intervention.
The 30 year JGB against 4.15%, and the 10 year Treasury against 5.17%.
Any follow up from the FSA on bank and insurer exposure.
The Fed on October 28 and the BoJ on October 30.
The CrossVol terminal tracks index volatility, skew, term structure and dealer positioning live, at crossvol.com for $99 a month.
This note is for information only and is not investment advice.