


By Djellal Djouad
Executive Summary: A Regime, Not a Wobble
The week of September 14 to 19, 2026 will be remembered less for any single print than for the way three fault lines converged at once. A central bank super-week delivered hawkishness on three continents inside seventy two hours: the Federal Reserve raised the funds rate 25 basis points to 3.75 to 4.00 percent on Wednesday the 16th, its first hike since 2023, with Governor Warsh framing it not as insurance but as "removing a dose of accommodation." The Bank of England held Thursday on a 6 to 3 vote while explicitly seeding a November hike and pausing quantitative tightening through April 2027. The Bank of Japan raised 25 basis points to 1.25 percent on Friday the 18th, its highest policy rate since 1995, on a fractured 7 to 2 vote. Layer on top of that a Middle East energy shock, the drone strike that closed Saudi Arabia's East to West (Abqaiq to Yanbu) pipeline and put roughly 9.5 million barrels a day of Hormuz transit back in the headlines, and a roughly $7 trillion options expiry on Friday, and you have the raw material for a regime, not a wobble.
That regime is best described as higher for longer plus energy shock plus AI earnings, a configuration that sits uncomfortably close to stagflation without quite being it. And the cross asset fault line that expresses it most honestly is not equities, not credit, not the dollar. It is the long end. US 10 year yields touched 5.00 percent intraday and closed the week at 4.998 percent, cycle highs last seen in 2007 and 2008. The OAT to Bund spread blew out to roughly 100 to 105 basis points, the widest since the 2012 euro crisis. The 10 year JGB pushed to roughly 3.0 percent, a thirty year high. None of these moves is primarily a policy story. Policy is the trigger. The load bearing driver is the trinity of fiscal deterioration, supply indigestion, and a rebuilding term premium, the structural reason duration is no longer a hedge but a source of risk.
Against that backdrop the tactical setup is what makes this note urgent. Positioning across the equity complex looks like a coiled spring. Sentiment is washed out to an extreme (AAII net bulls at minus 24.5, a sixteen month low; BofA's Bull and Bear indicator at 9.5, an outright buy signal by its own construction). Realized and implied volatility got crushed into and through opex. Dealers sit long roughly $3.84 billion of gamma. Speculators are the most long the dollar in a decade. CTAs are net long but perched within 1.1 percent of a systematic sell trigger. Every one of those facts is a stored energy statement. The question for the coming weeks is not whether the spring releases but in which direction, and the honest answer is that the microstructure is now primed for a violent move either way, with the trigger lines unusually legible.
US Equities and the $7 Trillion Opex
Beneath a placid weekly index tape sat one of the more revealing dispersions of the year. The Nasdaq 100 rose 1.78 percent to 29,644 while the small cap Russell 2000 fell 1.07 percent to 2,860 and the Dow Jones Industrial Average dropped 1.39 percent to 51,683. The S and P 500 split the difference, up 0.42 percent to 7,651. Post FOMC the reflex was textbook: an initial dip, then a squeeze that carried the S and P roughly 1 percent and the Nasdaq roughly 3 percent off the lows. But the weekly spread between mega cap tech and everything else, north of 300 basis points between the NDX and the Dow, is the tell. This is not a market rising. It is a market narrowing.
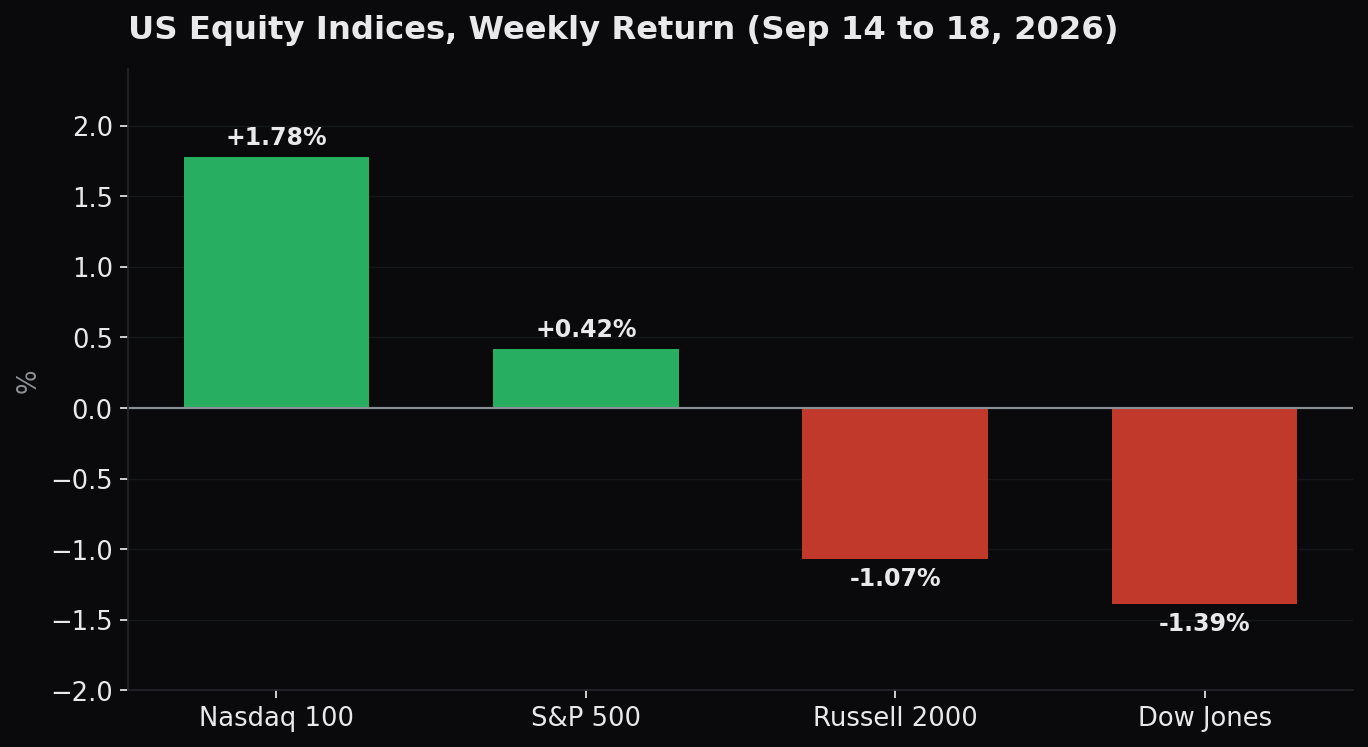
The valuation backdrop leaves almost no margin for that narrowing to fail. The S and P trades at 19.1 times forward and 22.6 times trailing earnings, and the cyclically adjusted CAPE ratio sits at 40.6 times, the 99th percentile of its own history. You are paying a top percentile multiple for an index whose internals are quietly falling apart. Breadth has collapsed: 32 percent of constituents sit at least 20 percent below their peaks, and the technology sector, on a 56.2 percent basis, is already in a bear market beneath the surface even as the cap weighted index prints near record highs. The entire edifice rests on artificial intelligence, which by house estimates accounts for roughly 50 percent of S and P EPS growth, against a heroic 2026 index earnings growth assumption of 25 to 33 percent. The fragility of that assumption is quantifiable. If semiconductor gross margins compress from roughly 70 percent toward 55 percent as competition and capex catch up, the arithmetic drops through to roughly a 10 percent cut to aggregate S and P earnings. The market is priced as though the AI margin cycle is a permanent plateau rather than a cycle.
Sentiment, by contrast, is priced for the apocalypse. The AAII bull minus bear spread at minus 24.5 is a sixteen month low, the CNN Fear and Greed index sits at 29, and BofA's Bull and Bear indicator at 9.5 is a mechanical contrarian buy. This is the crux of the equity setup and the reason it deserves the coiled spring label. You have extreme bearish positioning and sentiment sitting on top of collapsed volatility and, by extension, cheap convexity. That is the classic recipe for an upside squeeze. The offsetting caveat is breadth: with participation this thin, any rally is a hedged long, not a clean one, because the index can be dragged higher by five names while the median stock does nothing or bleeds.
The technical map is precise enough to trade against. Support runs 7492, then 7314, then the 200 day moving average at 7175. Resistance sits 7938 to 8022, with an intraday shelf at 7630 support and 7650 to 7710 resistance. The Dow's break of the 50000 to 49900 confluence is a genuine warning from the cyclical, value heavy side of the market. The single most important number for the days ahead is 7492: it is both a chart support and, as the positioning section will show, the neighborhood where systematic selling flips on. Around the $7 trillion opex, the mechanical point is that a vast quantity of dealer long gamma, which pins price and compresses realized volatility, rolled off Friday. What remains after the roll is not a positioning imbalance resolved but a pin removed, which is to say the tape is now free to trend.
Oil and Refined Products: A Geopolitical Premium on a Bearish Structure
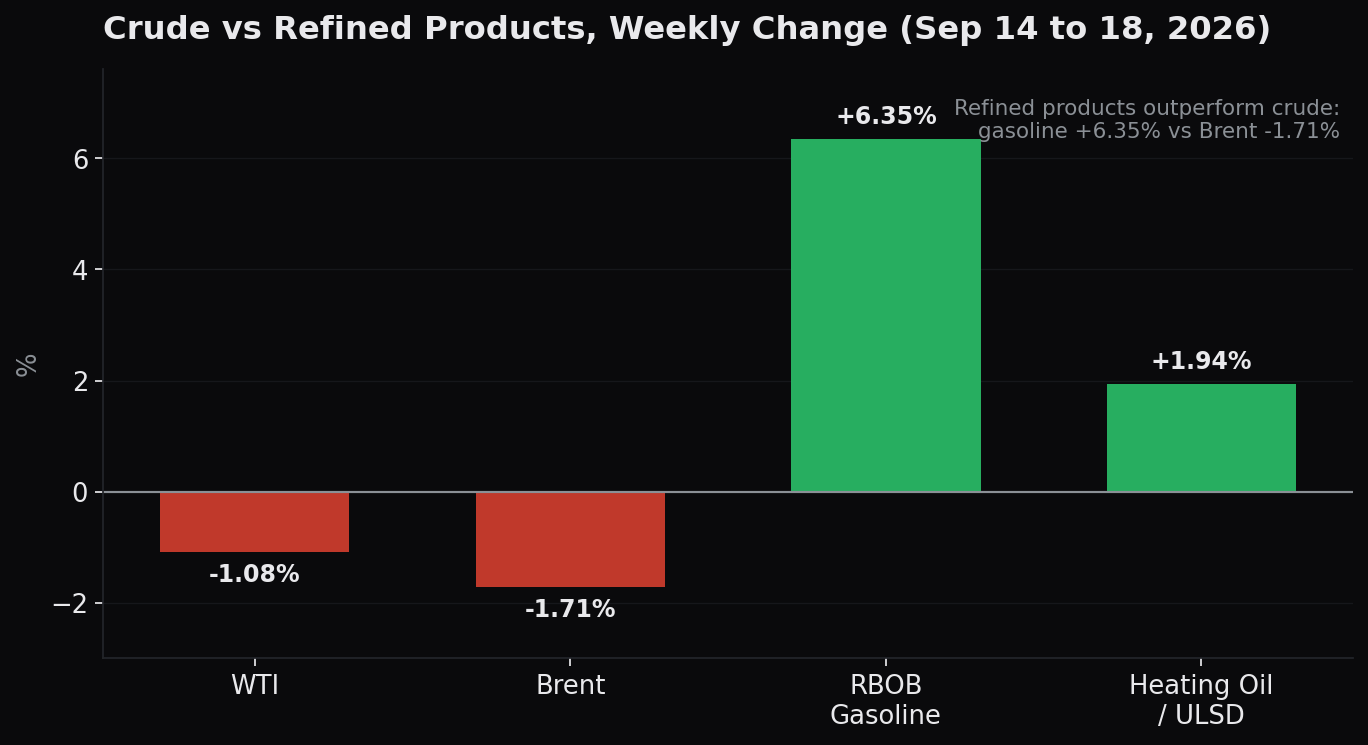
Crude spent the week executing a paradox. Brent settled around 103.87, down 1.71 percent, and WTI around 100.30, down 1.08 percent, even as the physical disruption that defined the week was real and large. The Saudi East to West pipeline, the Abqaiq to Yanbu artery, was closed from roughly the 8th to the 15th of September, removing on the order of 4 to 7 million barrels a day of optionality and putting the roughly 9.5 million barrels a day of Hormuz transit back into every risk desk's tail scenario. The reason spot crude fell rather than rocketed is twofold: the pipeline came back to roughly 50 percent capacity with a full restoration path of around six weeks, and China leaned on the Houthis to curb attacks, a diplomatic release valve that alone knocked Brent down 1.56 percent and WTI 2.21 percent on the day it landed.
Strip out the noise and the market is carrying roughly a $16 geopolitical premium over a $90 fair value, which is the price signal for about 4 million barrels a day of priced disruption. That premium is fragile because the structural picture underneath it is bearish. Global demand is running roughly 4.4 million barrels a day below 2025, and demand destruction, not supply, is the number one rebalancer in the current cycle. China's crude imports are down about 4 million barrels a day year over year. Inventories drew, but only to about 555 million barrels against a forecast draw toward 1.6 billion, roughly a third of what the bulls needed, and the US Strategic Petroleum Reserve sits at its lowest since 1982, which removes a cushion but does not create demand. JPMorgan's long term path captures the asymmetry bluntly: Brent from 81 toward 63 and WTI from 76 toward 51 by 2027. The message is that anything above $100 is geopolitical, not structural, and should not be chased on spot crude.
The cleaner expression of the shock is downstream, in refined products, where the tape confirmed it: RBOB gasoline jumped 6.35 percent to 352.76 and heating oil rose 1.94 percent to 505.78 even as crude fell. European gasoil printed an all time high. The mechanics are a refining slate problem, not a barrel problem. With a 29.6 percent diesel yield now favored against a 54.9 percent gasoline yield, and with naphtha exports down about 30 percent year over year and gasoline exports down about 24 percent, product prices have run up 103 and 138 percent on the relevant grades. European natural gas compounds the tightness: TTF sits around 80 euros per megawatt hour, its highest since December 2022, with EU storage at 67 percent versus an 85 percent seasonal average. The trade that respects both the shock and the structure is therefore to be long refined cracks and gasoline into any escalation while declining to chase spot crude, because the premium bleeds the moment Hormuz headlines quiet.
US Treasuries: The Bear Flattener and the Buyer of Last Resort Problem
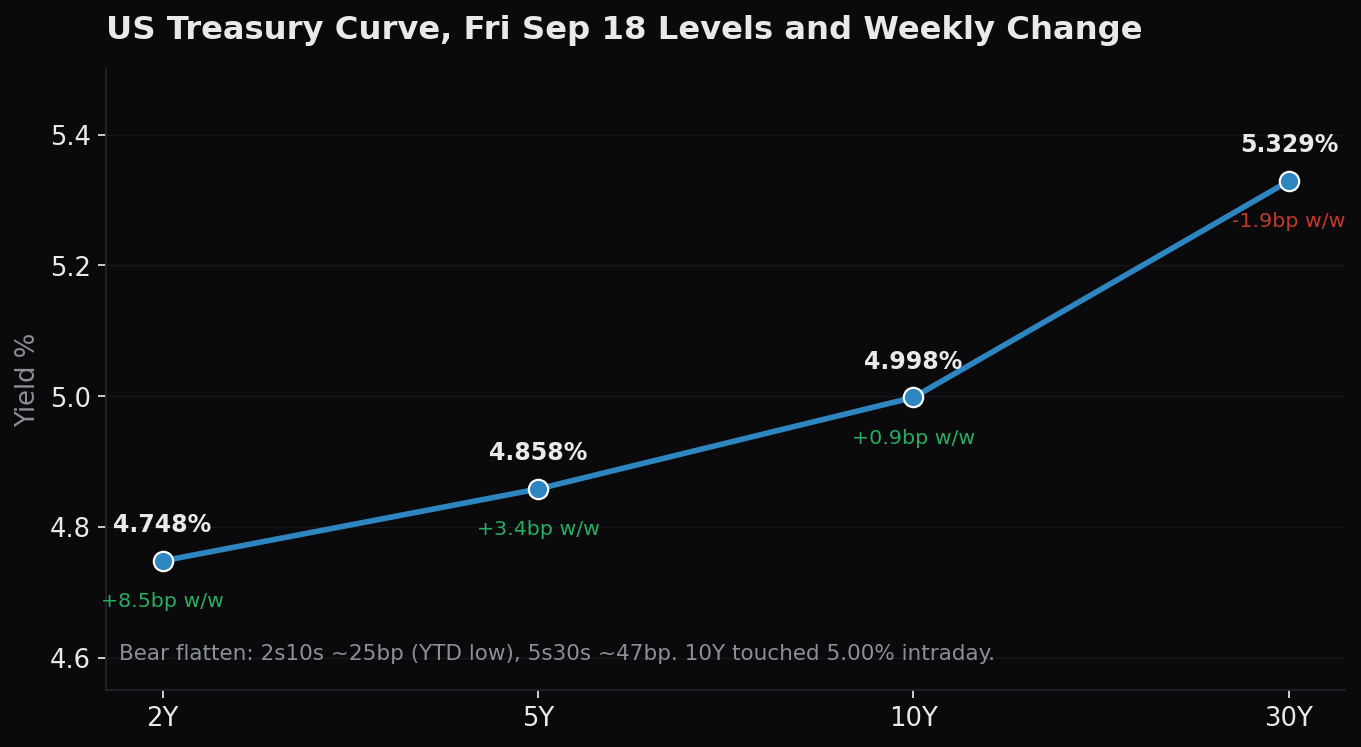
The Treasury market did the single most important thing in cross asset markets this week: it bear flattened into a 5 percent 10 year. The 2 year rose 8.5 basis points to 4.748 percent, the 5 year rose 3.4 to 4.858 percent, the 10 year rose 0.9 to 4.998 percent after touching 5.00 percent intraday, and the 30 year actually fell 1.9 basis points to 5.329 percent. The 2s10s curve compressed to roughly 24 basis points, a year to date low, and 5s30s sat near 46 basis points. Post FOMC the 10 year briefly eased back toward 4.93 percent as the hike was digested, but the level is the story: cycle highs on the back of a hiking central bank is what a policy story looks like, yet the deeper move is structural.
The structural driver is a buyer of last resort problem colliding with a supply avalanche. Foreign investors sold $3.6 billion of long term Treasuries in July, and the foreign ownership share has slid to roughly 30 percent in the second quarter, near the 29 percent multi decade low set in 2023. That matters because the Treasury itself now funds 46 percent of US debt in bills, against 15 to 20 percent in the 2005 to 2010 era, with debt to GDP somewhere in the 95 to 124 percent range depending on the measure. When the marginal foreign buyer steps back and the issuer is already skewed to the front end, the term premium has to do the clearing, and it is. Layer on the artificial intelligence capex supercycle, which is turning into a corporate supply tsunami: roughly $420 billion of investment grade issuance tied to hyperscalers penciled for 2027, about $260 billion net technology supply in 2026, and corporate net supply near $1 trillion in 2026. Every one of those bonds competes with Treasuries for the same duration dollars.
Positioning confirms the pressure and warns against pressing it naively. CFTC data show extreme bearish speculative positioning, with SOFR futures at minus 86 and 2 year contracts at minus 32 on the relevant net measures, and specification shorts in SOFR at an all time high. Roughly 75 basis points of additional Fed hikes are priced for next year. House forecasts put the 10 year at 5.1 percent by year end 2026 and 5.5 percent on a twelve month horizon. The tactical implication is to reduce duration and favor the 2 to 5 year part of the curve, where carry and roll are cleaner and the supply pressure is less acute. Goldman's tactical overlay, a steepener paying the belly on a 2s5s10s fly, makes sense specifically in the wake of the BoJ hike, which threatens to pull Japanese money home and steepen global curves from the long end.
European Bonds: France Is the New Fault Line
Europe's rates story is increasingly a France story. The OAT to Bund spread widened to roughly 97 to 105 basis points, the widest since 2012, and French paper is now trading at a 36 basis point discount that is effectively a record on the relevant measure. OATs cheapened 9.1 basis points on the week. The catalyst is fiscal: France's 2026 deficit is running above 5.5 percent of GDP with a 2027 path toward roughly 6.5 percent, and both Moody's, at A1, and Scope, at A plus, are live downgrade catalysts. When a core euro area sovereign trades like a semi core credit, the market is repricing the political capacity to consolidate, not just the coupon.
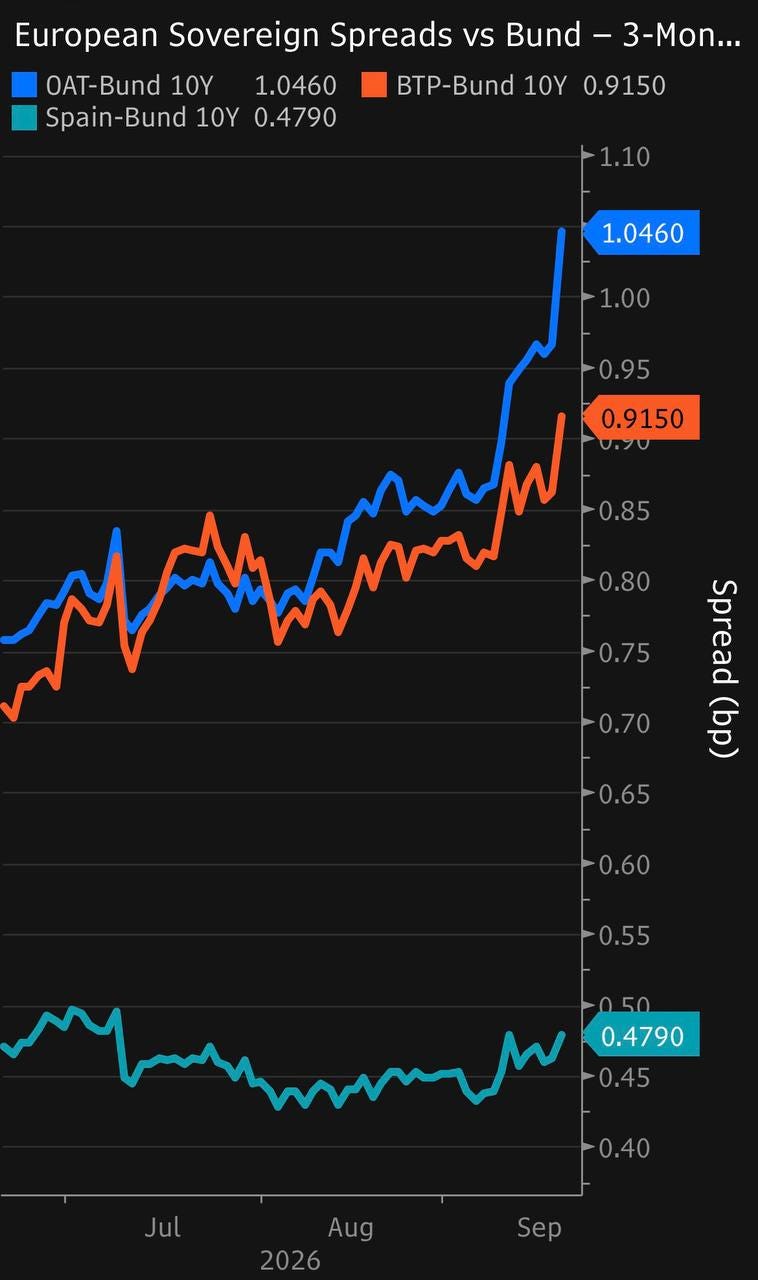
The rest of the European complex is caught between a hawkish central bank and structural technicals. The Bund sits around 3.15 to 3.25 percent, with the ECB expected to hike the deposit rate to 2.75 percent in December on a path to a 3.0 percent terminal, and euro area inflation's peak revised up toward 4.4 percent, a number that keeps the energy shock uncomfortably present in the rates conversation. Italy remains the most oil sensitive euro government bond market, a vulnerability that matters precisely in a week defined by a Hormuz premium. The Bank of England's QT overhaul is the important structural offset: 120 billion pounds of long gilts retained, 146 billion sold to the Debt Management Office, and no active QT through April 2027, a change that pulled the 30 year gilt down 12 to 13 basis points and frames a 10 year gilt forecast around 5.00 percent. On top of that, the Solvency II reforms arriving in January 2027 create a structural insurance and pension bid for long dated euro government and SSA paper. The trade that respects the divergence is to be long 10 year Spanish government bonds against core OATs, to avoid the longest Italian paper given oil sensitivity, and to lean on UK gilts as beneficiaries of the QT pause.
Japan and Asian Bonds: Fiscal Dominance Arrives
The Bank of Japan finally moved, 25 basis points to 1.25 percent, on a 7 to 2 vote that itself signals how contested the exit has become, with a January 2027 next step and a roughly 2 percent terminal in view. The market reaction that matters is at the long end: the 10 year JGB pushed to roughly 2.98 to 3.0 percent, a thirty year high. And, exactly as in the US and France, the driver is as much fiscal as monetary. The FY27 budget lands at 143 trillion yen, up 21 trillion, with a primary deficit near 1.5 percent of GDP and JGB issuance rising by roughly 13 trillion yen. This is fiscal dominance arriving in the world's most indebted large sovereign, and the long end is where it prints.
The flow picture carries a global tail. Foreign investors bought 449.6 billion yen of JGBs, but the more consequential number is on the Japanese side: record foreign equity buying of 8,606 billion yen alongside cumulative foreign bond selling of 4,490 billion yen, with the GPIF home bias risk hanging over the whole complex, and Japan's Treasury bill holdings drawn down from $155 billion toward $80 billion in the service of FX intervention. The reason this matters beyond Tokyo is repatriation. Every basis point of pickup in domestic JGB yields raises the hurdle for Japanese institutions to keep money in US Treasuries and European government bonds. The signal is that long end JGBs are a fiscal bet with a capped upside in price, and the real cross asset watch item is Japanese repatriation out of Treasuries and euro bonds, the mechanism by which a Tokyo hike steepens curves in New York and Paris.
Foreign Exchange: A Crowded Dollar and a Yen That Would Not Rally
The dollar had a strong week on paper and a fragile one underneath. The DXY rose 0.84 to 100.22. The euro fell 0.55 percent to 1.1486, sterling dropped 0.77 percent to 1.3395 on the BoE hold and the November hike risk, and USD/CNH slipped 0.21 percent to 6.6955. The standout was the yen: USD/JPY rose 1.64 percent to 156.88 and pushed past 157 even though the Bank of Japan had just hiked. A currency that weakens on a rate increase is a currency whose weakness is being driven by something other than rate differentials, in this case the persistence of the carry trade and a market that faded the BoJ's resolve. The 200 day moving average at 158.42 is the level that frames the fade.
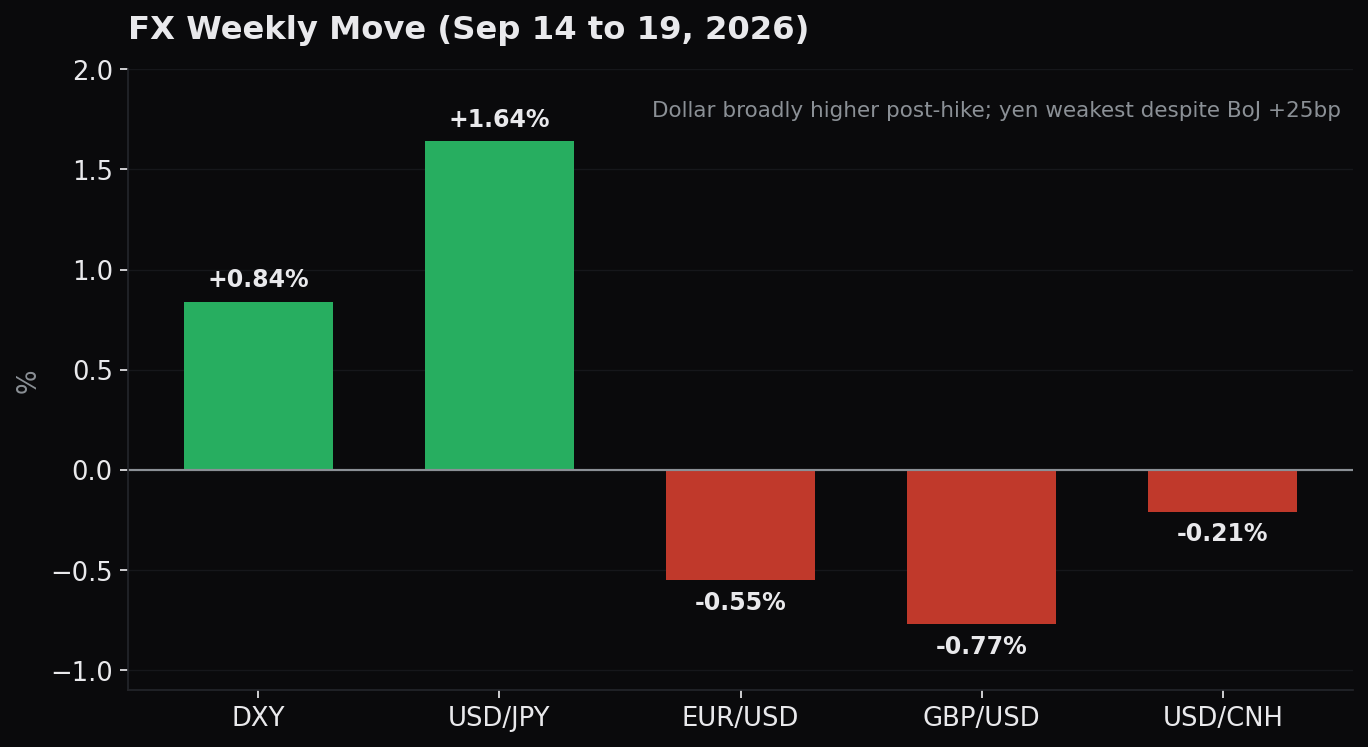
The strategic read on the dollar is that it is right for now and dangerous later, because it is crowded. Speculators are the most long the dollar in a decade, and the euro screens roughly 8 percent overvalued on GSDEER against a fair value estimate near 1.15, with downside scenarios into 1.12 to 1.132. EMFX turned bearish on the median for the first time since July. Crowding of this magnitude is a positioning risk, not a valuation one: when everyone is on the same side of the dollar, any catalyst that forces even a modest unwind moves the cross violently. The tactical stance that respects both the trend and the crowding is to favor carry in sterling, the Norwegian krone, and the yuan, and to fade USD/JPY toward the 160 area rather than chase it, on the view that the pair is stretched and the intervention reaction function is live given the T bill drawdown.
Positioning Deep Dive: Anatomy of a Coiled Spring
This is the section that ties the note together, because in a week where the macro drivers pull in different directions, positioning is the map of where the pain lives. Start with the trend followers. CTAs are net long $37.54 billion of US equities, which sounds large until you see it sits in only the 22nd percentile of the historical range against a $29.39 billion average, and, critically, within 1.1 percent of a short term sell trigger. That is the definition of a fragile long: not much cushion, and a mechanical seller waiting just below. The broader systematic cohort is at the 88th percentile, extreme bullish, against discretionary investors at the 46th percentile, and systematic exposure carries a 77 percent correlation to S and P realized volatility, which means a volatility spike is self reinforcing on the way down as vol control and CTA books de gross together.
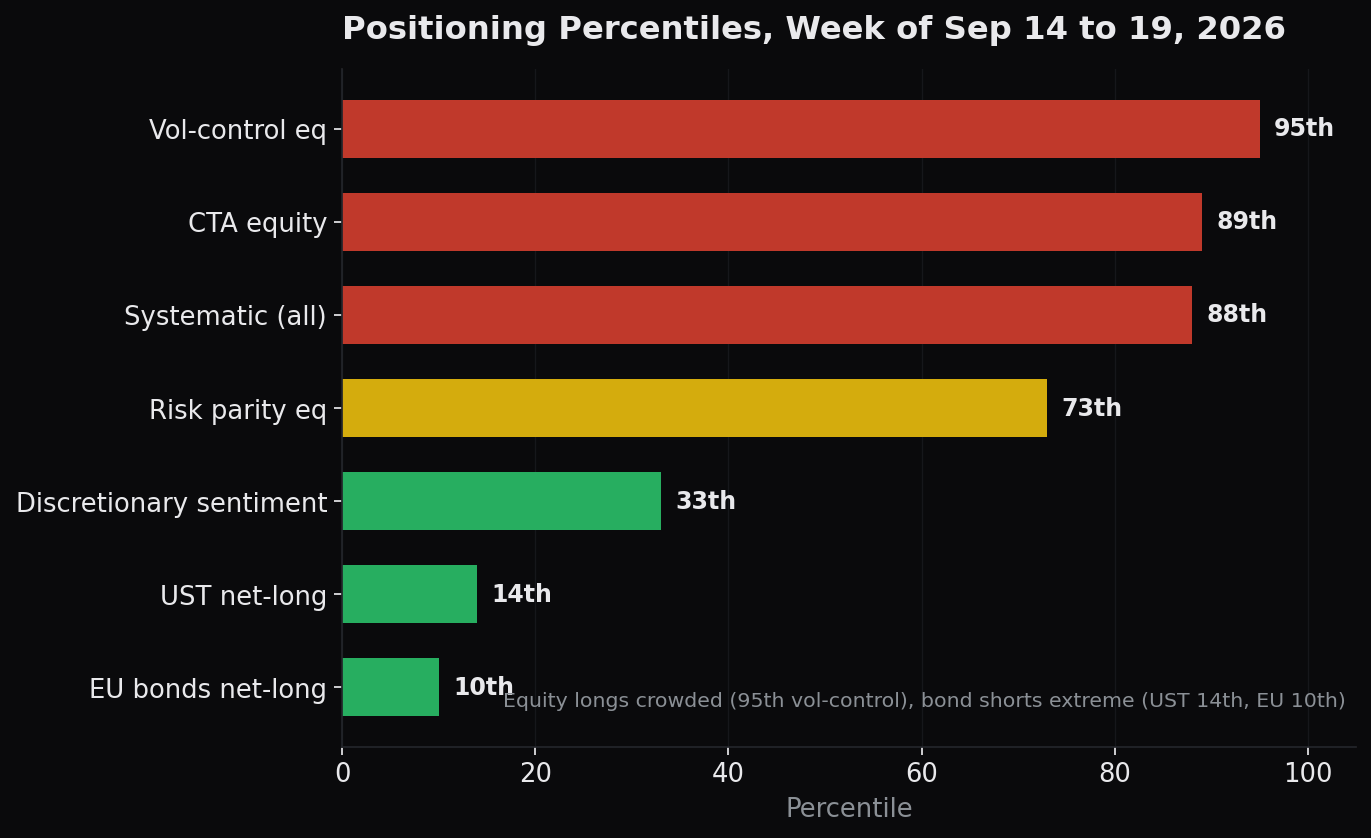
Hedge fund books tell a more defensive story that partly offsets the systematic froth. Gross leverage rose from about 304.6 toward 309.2 percent, the 65th percentile, but net exposure at 77.5 percent sits only in the 34th percentile, and fundamental long/short net exposure is at a 5th percentile extreme, which is to say very low, a defensively positioned discretionary community. Under the surface the flows are telling: funds added to technology, consumer discretionary, industrials, and financials by roughly $658 million, while cutting software from 16 percent to 2 percent of the relevant book, effectively going net short software, a clean expression of skepticism on the part of the AI trade most exposed to margin compression. Crowding is at a wince inducing extreme in exactly the places that hurt: banks are 98 percent short crowded and retail favorites are at the 81st percentile. When the most crowded shorts are in the banks, a rally forces a cover in precisely the cyclical names the Dow's break says are already weak.
The volatility and dealer picture completes the spring. The VIX posted its largest one day drop in ten years and then re elevated, a whipsaw that leaves squeeze fuel intact. Dealers sit long $3.84 billion of gamma, a plus 6 out of 10 reading that pins price and suppresses realized volatility right up until the opex roll removes it. The 2 year by 10 year swaption skew at 13.5 sits in the 87th percentile, CDX investment grade at 2.77 times and high yield at 2.23 times screen volatility as overpriced in credit, and institutions are quietly buying out of the money VIX calls for October and November, hedging the event calendar rather than the spot tape. The flow of funds turned defensive as well: a $75.9 billion cash outflow, a nine week high, the first investment grade outflow since April, high yield ETF redemptions of $253 million, against a token equity ETF inflow of $1.2 billion. Put it together and you have the coiled spring in full: extreme sentiment, crushed vol, a fragile systematic long, defensive discretionary books, and crowded shorts, all sitting on a dealer gamma pin that just rolled off. The stance the setup dictates is long convexity and hedged equity, with hard stops at S and P 7492 and the CTA trigger.
Week Ahead, September 21 to 25: The Pin Is Gone
The opening fact of the new week is a microstructure reset. With dealer gamma long at plus 6 out of 10 rolling off the $7 trillion opex, the pinning that compressed intraday ranges is gone, and what remains is directional tape with wider ranges. Implied volatility, having posted the largest one day VIX drop in a decade and then re elevated, is positioned to drift higher on event risk, which keeps the squeeze fuel live. The single most important structural fact is unchanged: opex removed a gamma pin, not a positioning imbalance. The CTA book is still net long $37.5 billion at the 22nd percentile, still within 1.1 percent of the trigger, and the systematic cohort is still at the 88th percentile. That is the setup for a choppy, two way, event driven week rather than a clean trend, with a decisive down close capable of flipping CTAs to sellers and a hold above roughly 7630 keeping them long.
The catalyst calendar is dense. Monday the 22nd brings US durable goods for July, forecast at minus 0.3 percent against a prior plus 1.1 percent. Tuesday the 23rd delivers euro area and UK flash PMIs (euro area composite 51.6, UK 52.7, French composite a contractionary 48.7, German manufacturing 53.8) and, more importantly, the start of a $173 billion auction series with the 2 year. Wednesday the 24th brings US S and P flash PMIs (manufacturing 54.0, services 56.1) and earnings from Cintas, General Mills, and Paychex. Thursday the 25th is the event: a Trump to Xi summit in Washington covering trade, artificial intelligence, and critical minerals, with the truce expiring November 1, alongside durable goods final and new home sales near 623,000. All week the Federal Reserve is on the tape, with Williams appearing multiple times plus Goolsbee, Bowman, Schmid, Hammack, and Jefferson, and the ECB's Lane. The global overlay adds an RBA hike toward 4.60 percent, a South African Reserve Bank 25 basis point move to 7.25 percent, a coin flip at Norges Bank, and a Riksbank hold. Because the summit date has been cited variously as the 23rd to the 25th, treat Thursday and Friday as the elevated volatility window.
The auctions are the make or break for rates. A $173 billion series landing into a market where the foreign share is at a 30 percent multi decade low and the AI supply pipe is filling is the cleanest possible test of the buyer of last resort thesis. A weak auction takes the 10 year from 5.00 toward 5.25 percent, and 5.25 percent on the 10 year is the level that becomes the equity market's problem. Across assets the base case is a range bound, digest and consolidate week: pipeline repair and Chinese diplomacy drain the oil premium toward $100 Brent, auctions get absorbed, no Fed shock lands, and the S and P holds 7550 to 7710 with the 10 year at 4.95 to 5.05 percent and EUR/USD around 1.14. The bull case, a summit squeeze, needs a constructive Trump to Xi outcome, oil relief, and strong PMIs to carry the S and P through 7710 toward 7938 to 8022, push volatility up in a good way, drive USD/JPY to 160, and bounce EM. The bear case, tail but real, is a hawkish Fed surprise or a failed summit or a weak auction that lifts the 10 year above 5.25 percent, flipping CTAs to sellers and taking the S and P through 7492 toward 7314, with oil spiking on re escalation, the dollar surging, and OAT to Bund pushing back above 100 basis points. The lines to trade are unusually clean: the CTA trigger neighborhood at 7550 to 7630, the equity stop at 7492, and the rates stop at a 10 year above 5.25 percent.
Net Actionable Stance, Twelve Months
The through cycle allocation that falls out of the week is not complicated, because the regime is coherent. Stay overweight US and Asia ex Japan equities with a clear tilt toward artificial intelligence semiconductors and the power and infrastructure buildout that feeds them, on the understanding that this is the earnings engine and also the single largest concentration risk, which is why it must be a hedged long. Own quality investment grade and selective emerging market credit, where carry compensates and volatility screens overpriced. Own gold, where Goldman's $5,400 by end 2027 target frames the debasement and reserve diversification thesis that the falling foreign Treasury bid corroborates. Own energy and refined products as the cleanest expression of the supply constrained, demand destroyed oil complex, favoring cracks and gasoline over spot crude.
On the other side, stay underweight long duration sovereigns across the US, Europe, and Japan, because the fiscal, supply, and term premium story that pushed 10 year yields to 5 percent, OAT to Bund to 100 basis points, and JGBs to 3 percent is structural and early rather than late. Stay underweight software, the part of the AI trade most exposed to the margin compression that the hedge fund community is already shorting. Fade the crowded dollar longs over the medium term, respecting the trend for now but sizing for the violent unwind that a decade extreme in speculative positioning eventually produces. And throughout, maintain volatility and convexity hedges, because the defining feature of this market is not its direction but its stored energy. The spring is coiled. The prudent posture is to be long the release in both directions and disciplined about the trigger lines, 7492 and 7630 in equities and 5.25 percent in the 10 year, that will tell you which way it goes.
Related reading
The Volatility Risk Premium Explained
CrossVol: dealer gamma and GEX
Djellal Djouad