


By Djellal Djouad. October 25, 2026.
Weekly changes run from the Friday October 16 close to the Friday October 23 close, unless stated otherwise.
This article is for educational purposes only. It is not investment advice. Trading equities, bonds, futures and options involves substantial risk of loss.
The week in five lines
Equities: the main indices barely moved, but the AI trade broke underneath. Semiconductors lost 6.7% in one session while small caps and the average S&P 500 stock rose.
Bonds: US Treasuries rallied hardest on the day stocks fell, so bonds hedged stocks again after months of moving with them. Funds that were short Treasuries had to buy them back as yields dropped.
Credit: it kept leading. US high yield spreads reached a 17-month high, and the cost of insuring Oracle ($ORCL) and CoreWeave ($CRWV) debt widened sharply, while the Nasdaq 100 lost less than 1%.
Oil: Brent rose 6.2% to $116.72 on the Gulf escalation, with an extreme premium for prompt barrels and a $13 gap over WTI.
France: the gap between French and German 10-year yields widened 29 bp, the second biggest weekly move since 1990. France now borrows at higher rates than Italy and Greece. I cover it in a separate piece on the French bond crisis.
My reading: the week reset positioning without breaking the market. Hedge funds are at their most defensive in five years, crowded long books have been cut, and the volatility curve never inverted. The two themes I have described here since September both advanced: AI spending financed with debt widened its credit cracks, and long-term money kept choosing bonds over stocks. The large indices still show little of either.
A few units used throughout: a basis point (bp) is one hundredth of a percentage point. A CDS (credit default swap) is an insurance contract against a borrower's default, quoted as an annual premium in basis points. High yield bonds are bonds rated below investment grade.
Weekly scorecard: stocks, bonds, oil, gold and volatility
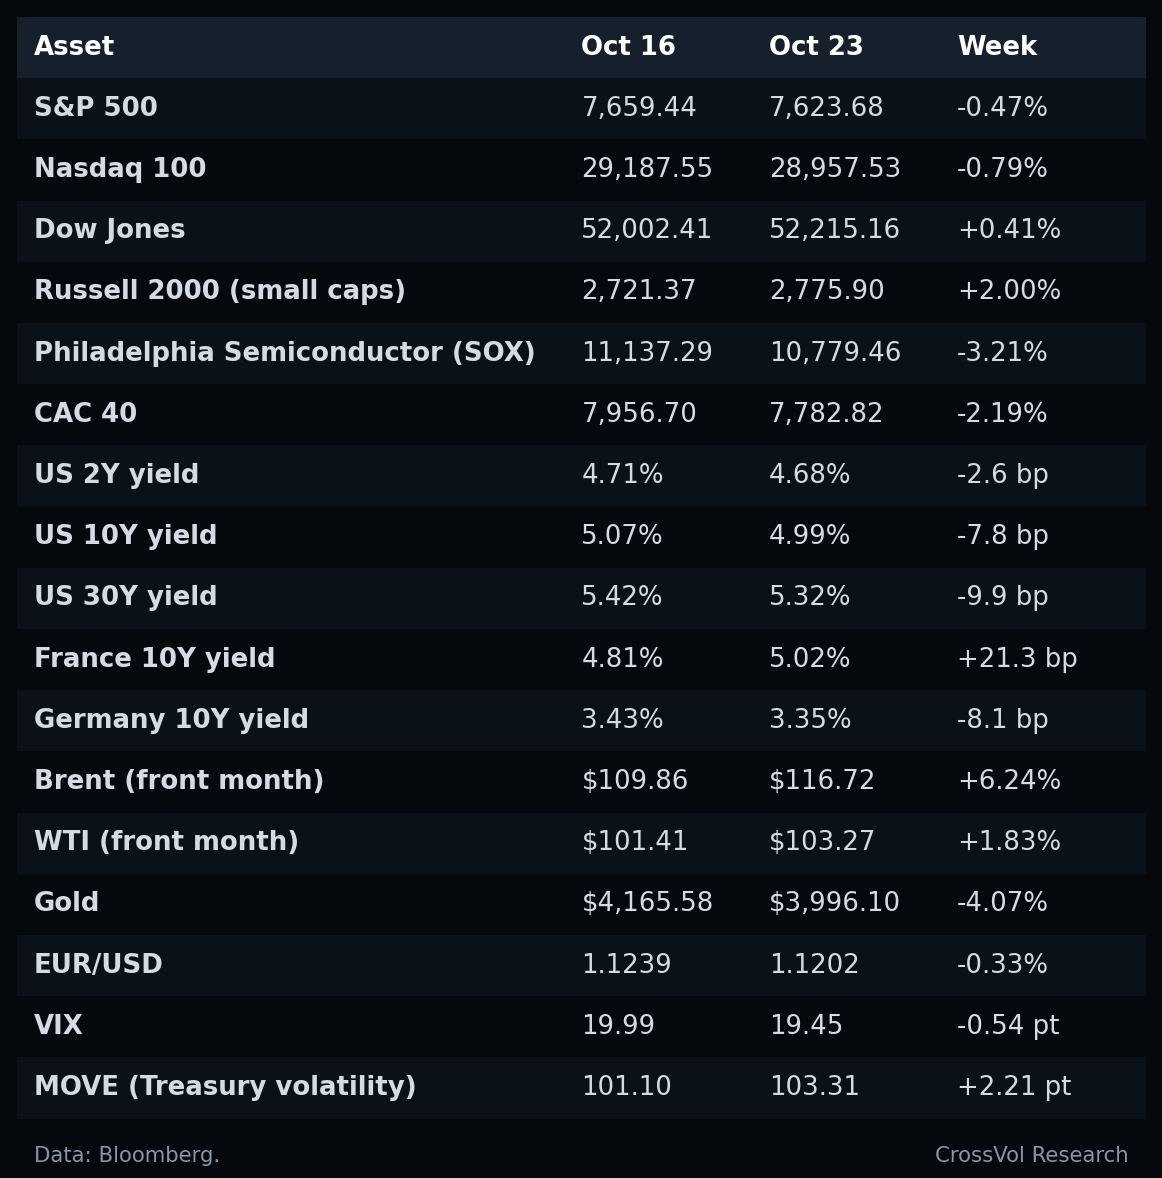
A note on method: several recaps circulating this weekend measure the week from Monday's close. Monday was itself an unusual session (the US 10-year closed at its weekly high and utilities fell 2%), so Monday-based numbers overstate several moves. Utilities, for example, are up 2.9% from Monday's close but only 0.8% from the previous Friday.
1. Equities: the AI trade broke under a calm surface
The Thursday shock
On Thursday, October 22, a supply warning from Lam Research ($LRCX) and Meta's plan to raise capital spending again, funded through a new share class, changed the market's question about AI from "how much will they earn?" to "who pays for it?". The Philadelphia Semiconductor Index fell 6.72% in one session. Meta lost 6.98% on twice its average volume. Nvidia lost 4.4%, AMD ($AMD) 8.1%, Micron ($MU) 6.3%. CoreWeave lost 10.1% and Nebius 7.2%.
The S&P 500 lost 1.21% that day, yet more of its stocks rose than fell: 335 against 161. The equal-weight S&P 500, which gives every member the same weight instead of weighting by market value, rose 0.73%, and consumer staples gained 3.3%. A few very large stocks pulled the index down while the typical stock went up.
Rotation, measured
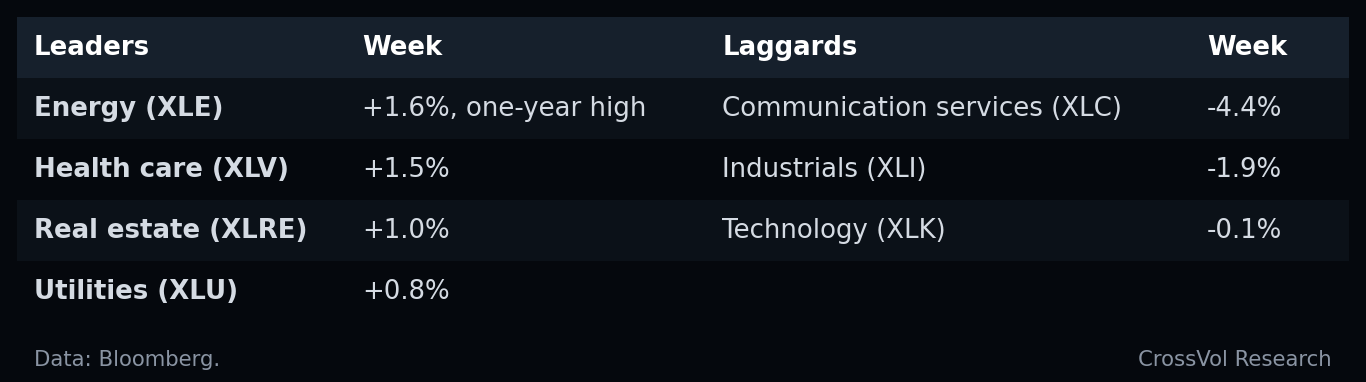
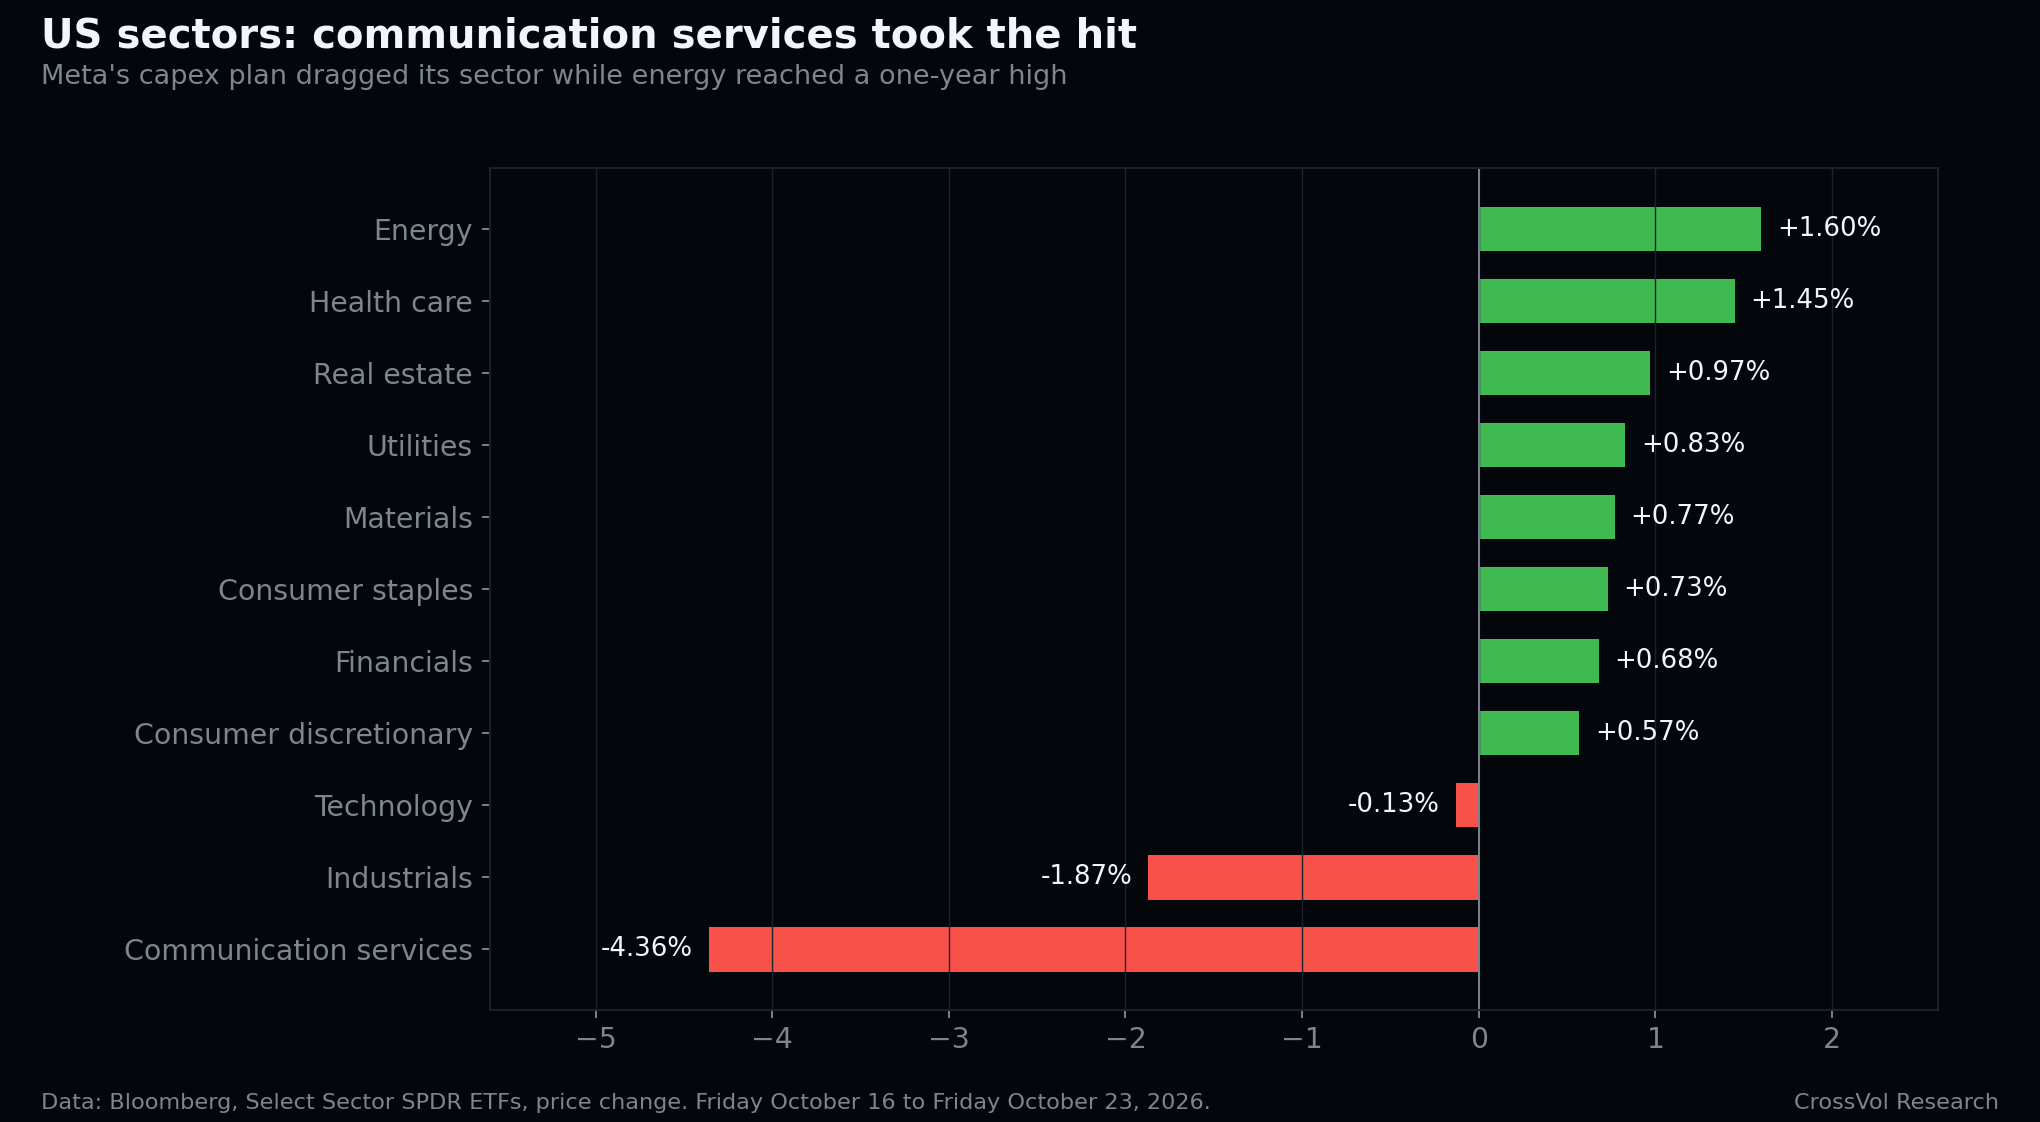
Sectors, Friday to Friday:
Equal weight versus market-cap weight. The equal-weight S&P 500 ETF ($RSP) gained 1.1% while the standard S&P 500 ETF ($SPY) lost 0.4%, so the ratio between them rose 1.6%. When the average stock beats the index, money is leaving the largest names rather than leaving equities.
Bank baskets. Banks publish baskets of stocks built to isolate one theme or factor. Five-session moves to Friday's close:
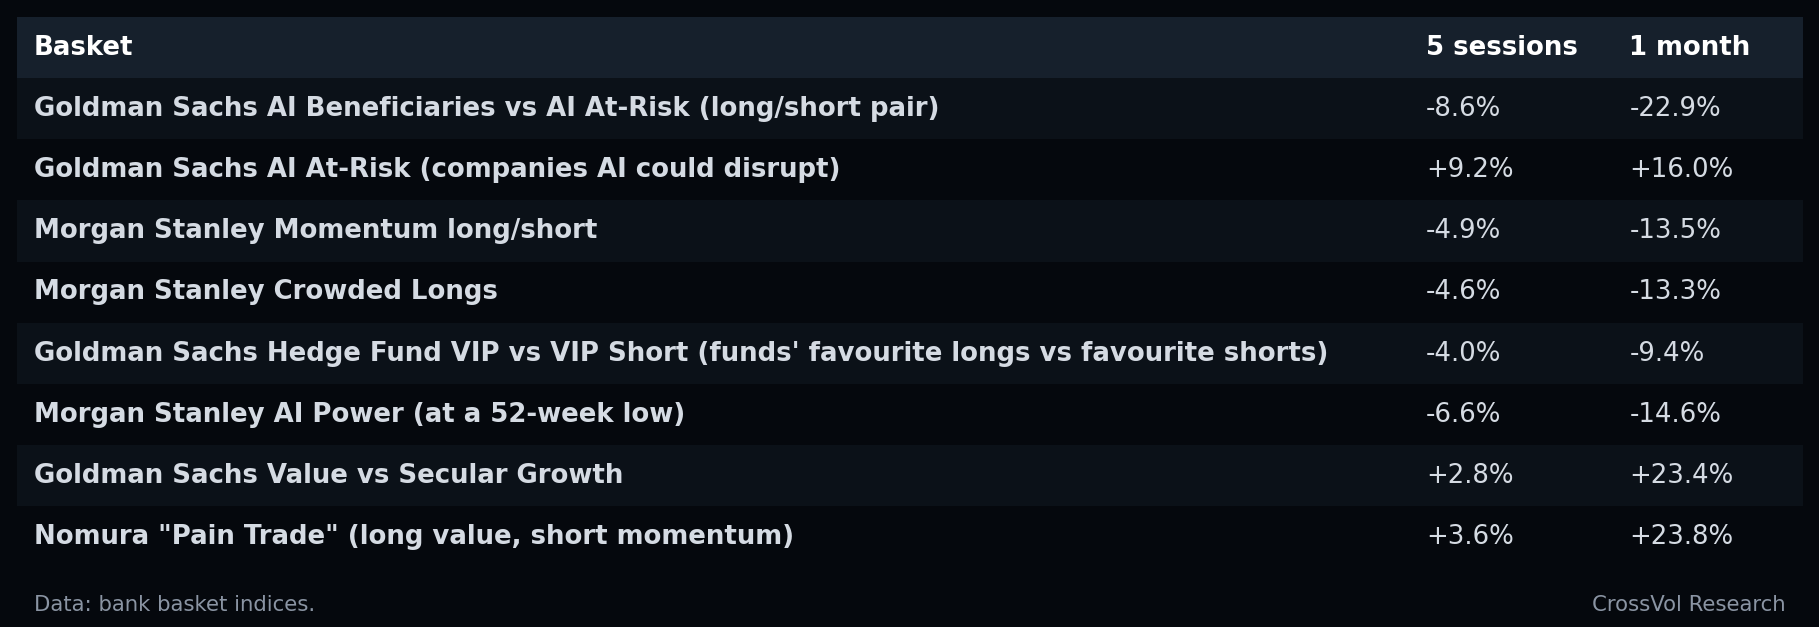
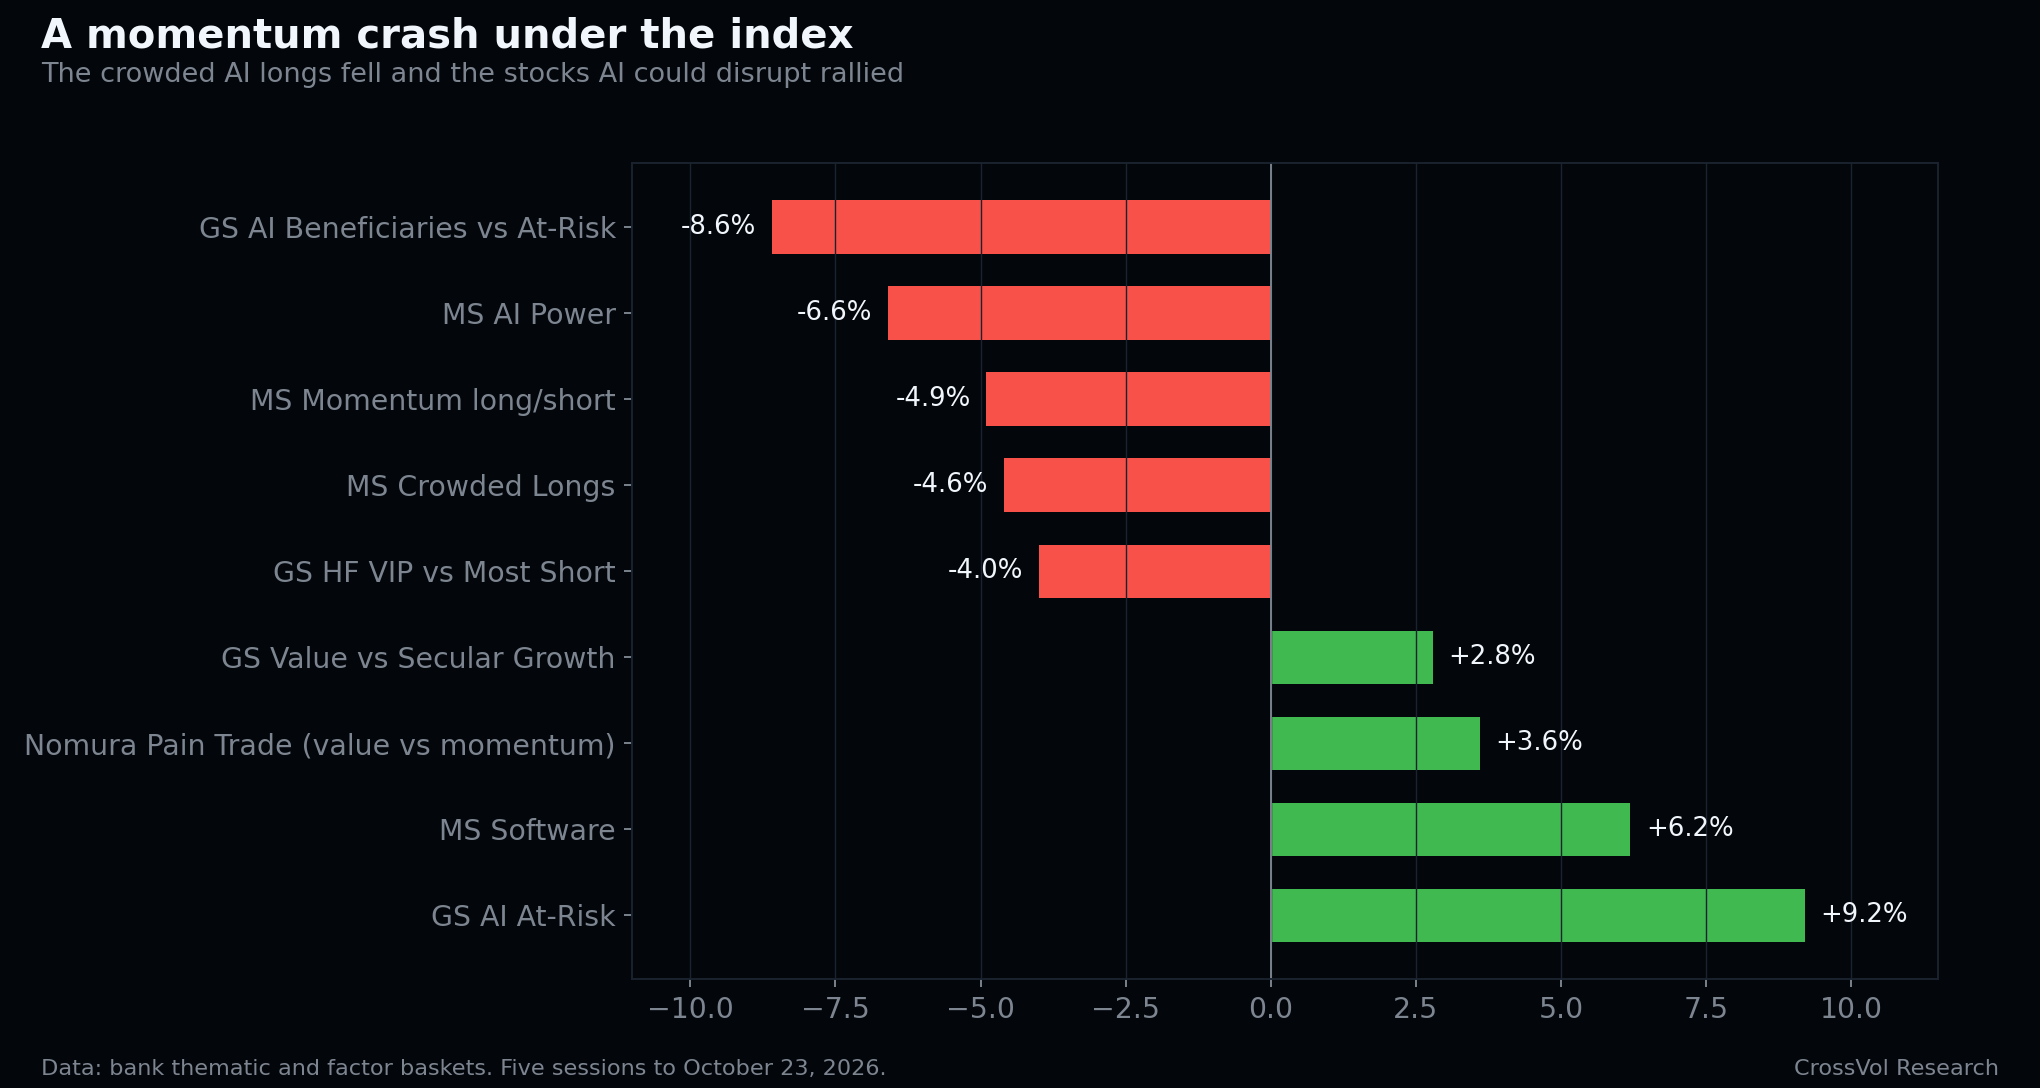
Momentum is the strategy of owning what has risen most over the past year. On Thursday alone, the Nomura Pain Trade basket gained 12.0% and Morgan Stanley's momentum pair lost 8.1%. Over one month, "long value, short momentum" made almost 24%. The stocks everyone owned for the AI story were sold and the stocks everyone was short were bought back: a momentum crash, more than a sector rotation.
Positioning: the selling fuel is largely spent
Goldman Sachs prime brokerage data reported this week (a prime broker is the bank that finances and holds hedge funds' positions):
Net leverage of US long/short hedge funds at 43.4%, the 0th percentile over one, three and five years. Net leverage is long exposure minus short exposure, relative to capital: these funds are at their most defensive in five years.
Short leverage near a five-year high, at the 99th percentile, concentrated in AI infrastructure and semiconductors.
Gross leverage of the prime book at 312.3% (96th percentile over five years). Gross leverage adds longs and shorts: funds are still heavily invested, on both sides.
Goldman's basket of hedge fund favourite longs against their favourite shorts fell about 4.2% on Thursday, its worst day since 2011.
De-grossing, the cutting of both longs and shorts, on 7 of the last 8 sessions. The October 22 session was the fifth-largest de-grossing in Goldman's prime book data, almost entirely long selling.
Hedge fund exposure to the "Magnificent 7" (Apple $AAPL, Microsoft $MSFT, Alphabet $GOOGL, Amazon $AMZN, Nvidia $NVDA, Meta $META, Tesla $TSLA) at a record 22%.
My read on the "record shorts": mostly a financing artifact
Short interest charts are everywhere this weekend. Most of them miss the flows behind them.
Much of this short exposure is not an outright bet against the market. Prime brokers are rationing their balance sheets. Goldman Sachs said earlier this month that demand for equities financing "continued to exceed available industry capacity", and Bloomberg reported that Barclays and other banks worked with hedge fund clients to limit their balance sheet use, "encouraging them to take more short positions".
The sequence on the street looks like this:
A hedge fund manager asks for more financing.
The bank answers: public AI bets look risky and we already lend a lot against private AI bets. We will extend more financing, but only if you add short exposure to improve your collateral profile.
The manager shorts more stocks against the main bet.
That is how short exposure can look astronomically high while many end investors remain heavily long tech. The extra shorts finance the main bets. It also explains why equity financing rates have not blown out the way they did before the SpaceX IPO in June, even though lending is slowing.
Two consequences:
The squeeze potential is mechanical. Shorts held as collateral can be covered quickly if prices bounce, which is why a strong week of results from the large cloud companies could trigger a sharp one to two day rally.
The real risk sits in the longs. If AI spending guidance disappoints, the 22% Magnificent 7 exposure is the fuel, and these shorts will not provide a floor.
Breadth and volatility plumbing
Friday breadth: 134 S&P 500 stocks up, 362 down, 73% of volume on the sell side. 58% of members trade above their 50-day moving average.
Volatility-targeting funds, which cut exposure when market volatility rises, run at about 94% exposure. A 1% daily move would trigger about $15 billion of selling, and a 2% move about $69 billion.
Dealer gamma. Option dealers hedge their books by trading the index. Below a "flip" level, their hedging amplifies moves instead of damping them. As of Thursday, the S&P 500 flip sat near 7,740, above the market, with large option positions at 7,600 and 7,800. Chart watchers also mark 7,616 as the neckline of a head-and-shoulders pattern.
2. Rates: the hedge came back, and short sellers were caught
The Thursday rally
The US 10-year yield fell from 5.12% on Wednesday to 4.95% on Thursday, a 16.6 bp drop in one session and the biggest since August 2025, as the AI selloff sent money into Treasuries. On the week, the 10-year lost 7.8 bp and the 30-year 9.9 bp.
Two correlations confirm that bonds hedged stocks again:
the 50-day correlation between the S&P 500 and long-dated Treasuries (the $TLT ETF) fell from about 50% at the end of September to 19% on Friday;
the 50-day correlation between AI stocks relative to the rest of the market ($SMH against $RSP) and long Treasuries reached -36%, near its lowest of the year.
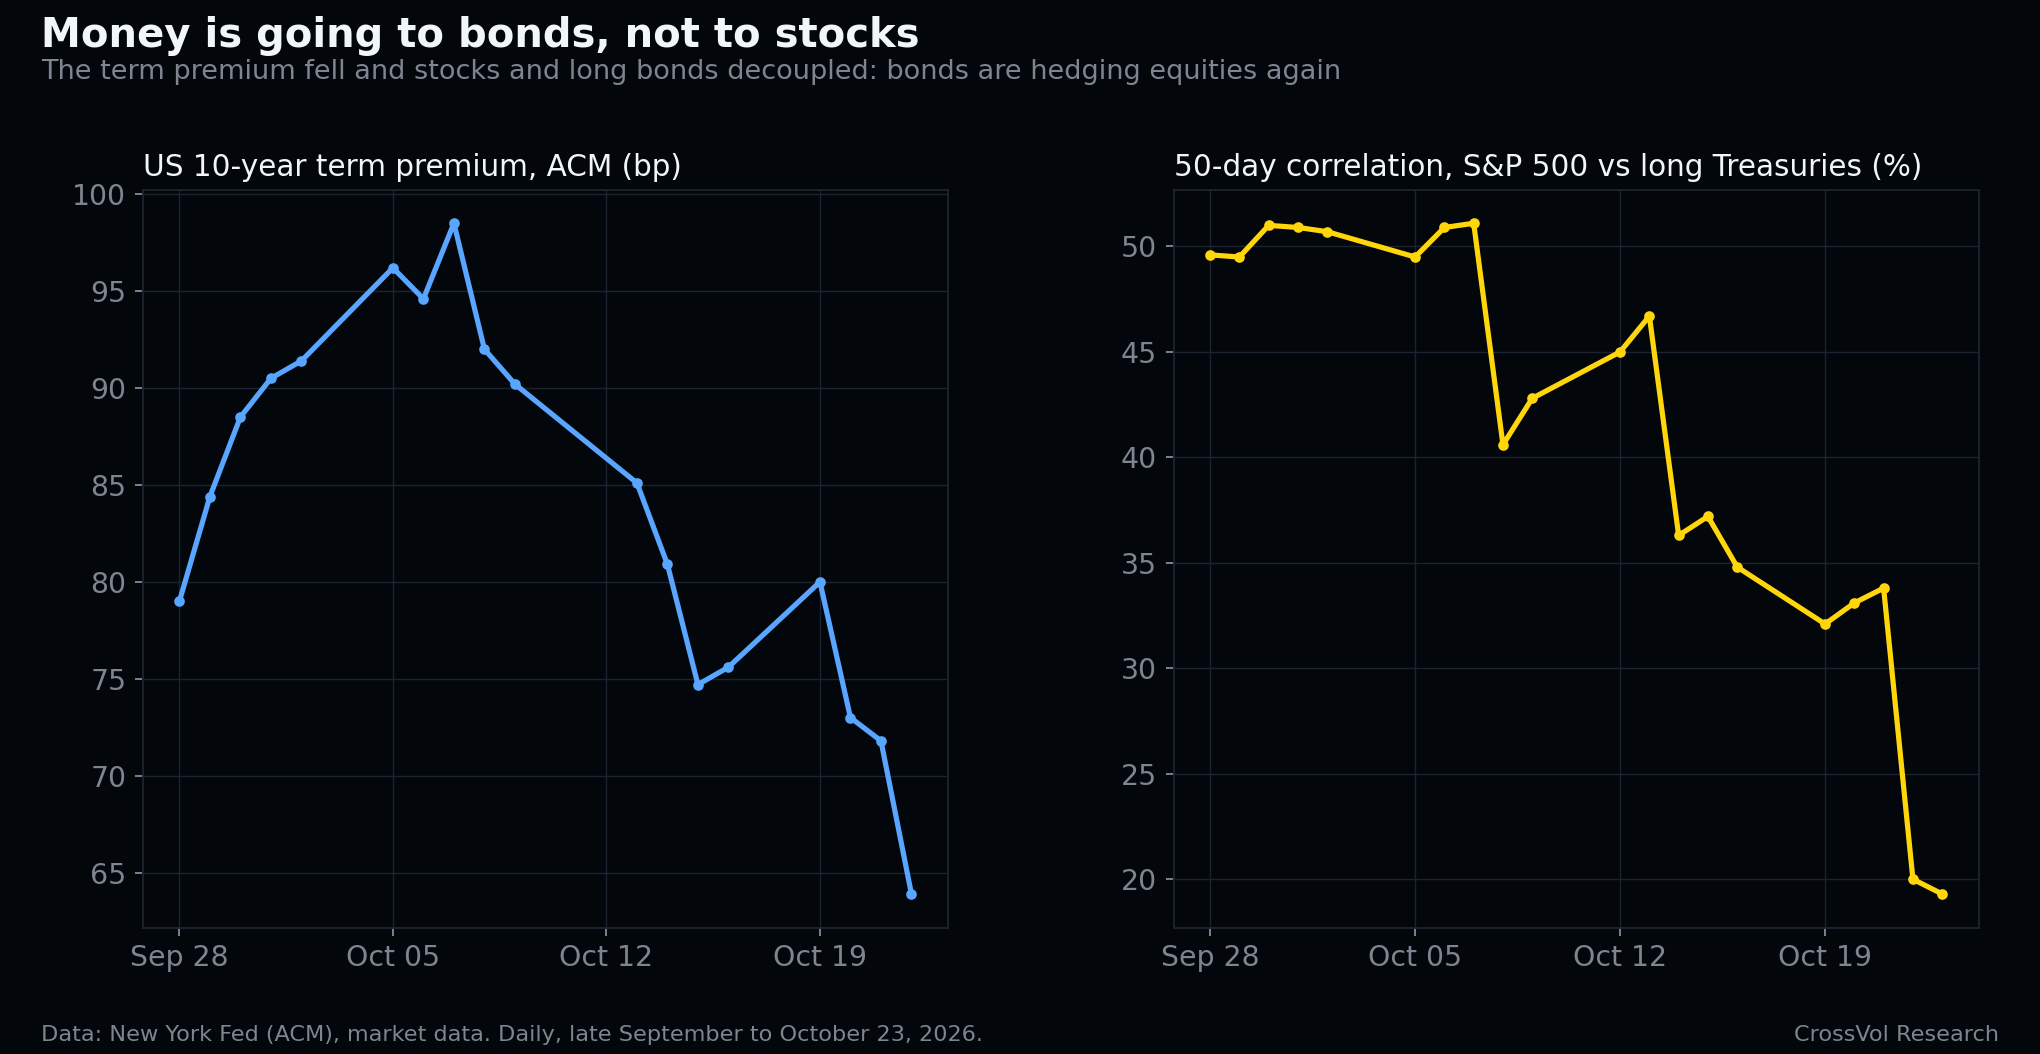
This is the scenario I laid out in The Pension Valve Only Opens One Way (October 15): long-term money that does not come in to buy equities on a selloff is buying bonds instead. When that happens, stocks and bonds stop moving together and the bond hedge comes back. This week's falling correlation and falling term premium are what that flow looks like in the data.
On AI selloff days, yields now fall with stocks. On October 18, I wrote that "AI specific sessions behave differently: on those days, yields fall with stocks", and flagged the late-October AI earnings as the date to watch (The VIX Woke Up Loaded the Other Way). Thursday was that session.
Why the rally was so violent: positioning
CFTC data as of Tuesday, October 20 showed speculators heavily short Treasury futures: about 857,000 contracts net short on 2-year futures and 964,000 on 10-year futures. Those shorts had begun to shrink (the aggregate fell by about 93,000 contracts, measured in 10-year equivalents). On Thursday, open interest (the number of contracts outstanding) fell in 2-year and 5-year notes, a short-covering signal, while new positions were opened in 10-year notes.
CTAs (commodity trading advisors, systematic trend-following funds that buy what rises and sell what falls) entered the month maximum short bonds. The long end is the exception to the covering: as of Tuesday, speculators had added 30-year shorts for a second straight week (-16.7% week on week). Covering at the front, adding at the back: the market still bets on heavy bond supply at long maturities while buying short maturities on growth fears.
The squeeze is not over: half a trillion dollars of CTA buying is still loaded
The most important positioning number of the week did not come from the CFTC. It came from Nomura's cross-asset strategist Charlie McElligott, in a note reported on Saturday, October 24:
CTAs covered $68 billion of bond futures and $38 billion of STIRs (short-term interest rate futures, such as SOFR contracts) in two weeks.
And they are still short. Their net weight stands at -47.3% in bonds, the 12th percentile of history, and -32.8% in STIRs. In McElligott's words, much of the CTA signal went "from -100% Short to now -74% Short on BIG covering". They are not long. They are "less short".
The fast windows have already flipped. Trend models blend several look-back periods. The two-week and one-month windows have turned long. The three-month window has not: it needs what McElligott calls a "substantial further rally from here".
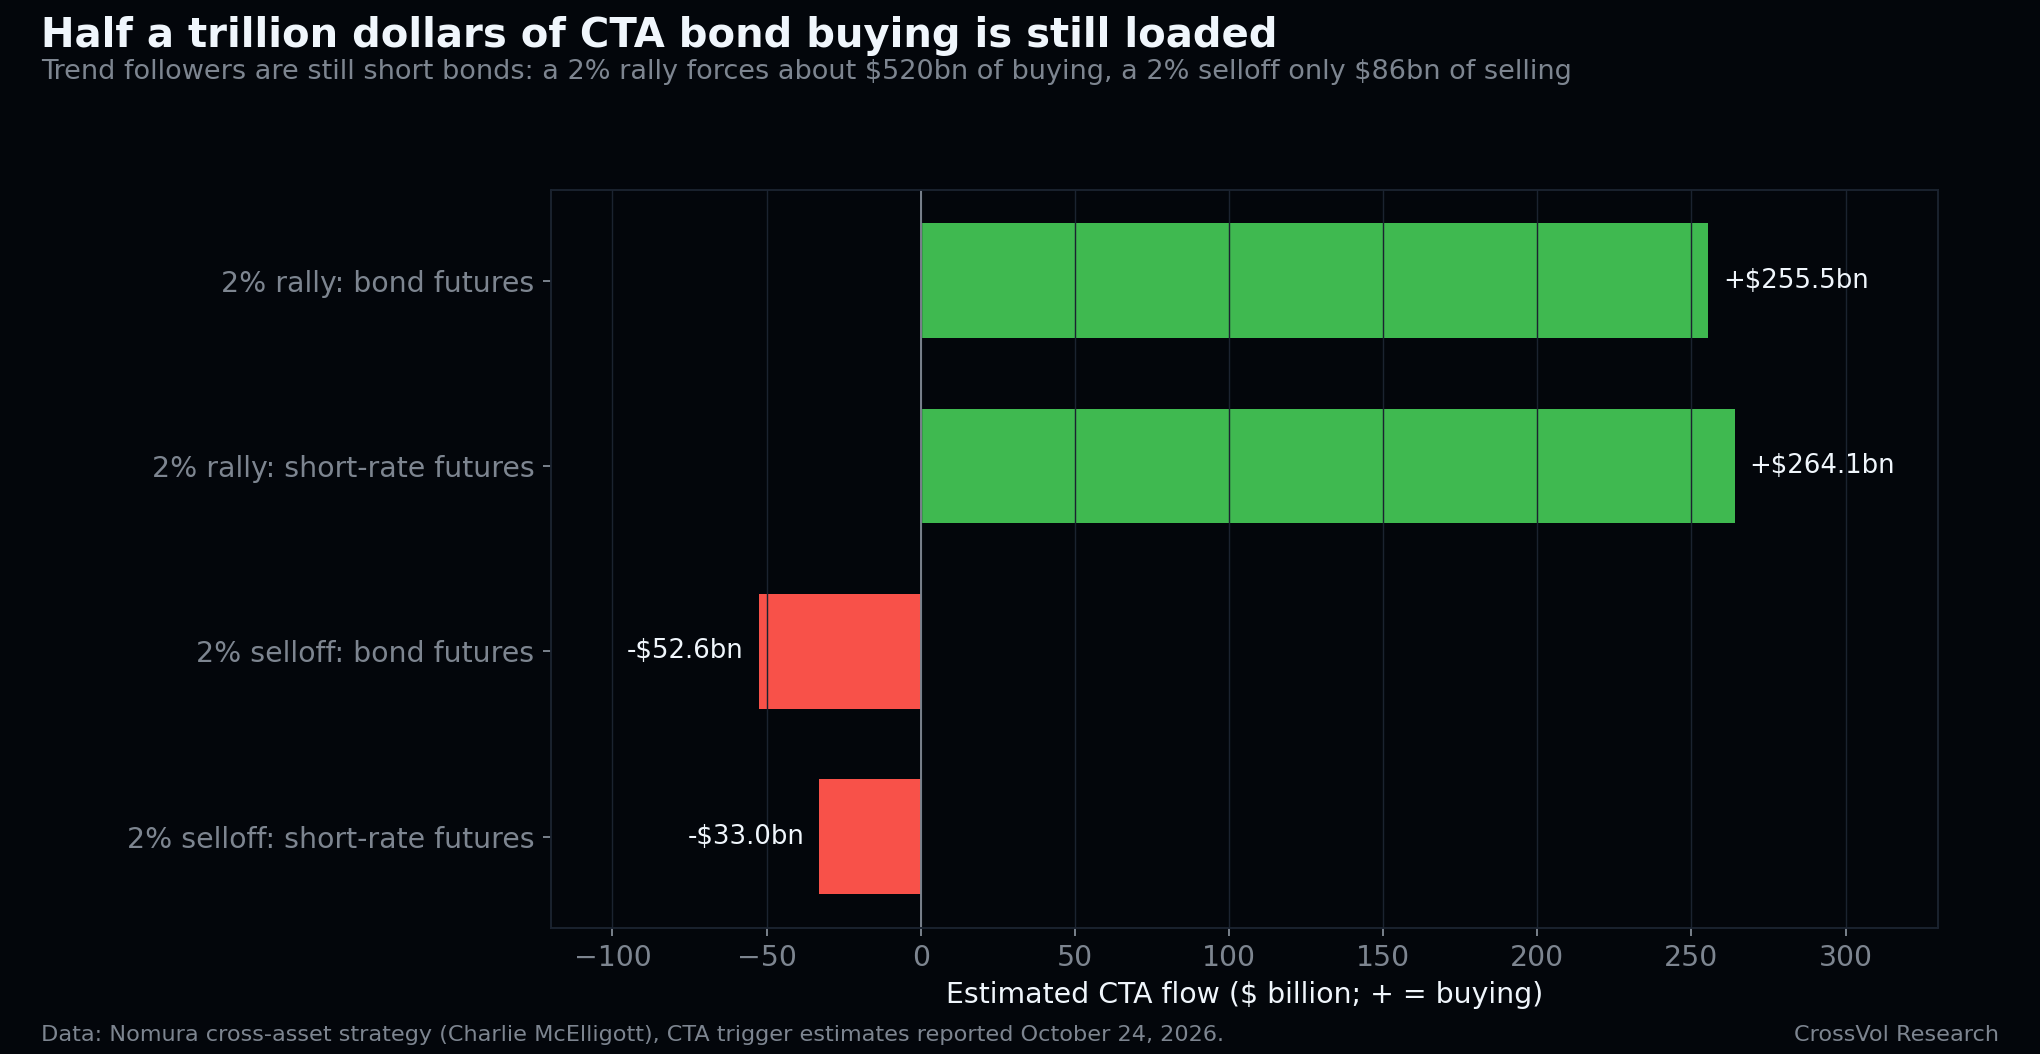
The asymmetry is extreme. Under Nomura's trigger estimates, a further 2% rally in bond futures would force CTAs to buy about $255.5 billion of global bonds, and a 2% rally in short-rate futures another $264.1 billion of STIRs: roughly half a trillion dollars of systematic buying. A 2% selloff would trigger only $52.6 billion and $33 billion of selling.
Two other details from the note matter for bonds. Spot and volatility moved together in Treasuries on Thursday: bond prices rose while bond volatility rose too, the signature of a short squeeze rather than calm buying (the MOVE index jumped from 95.9 to 106.8 that day). And CTAs lost 2.0% on the week, their 9th percentile, which pushes their risk models to cut the losing shorts faster.
This is why I do not read Friday's pause in the Treasury rally as the end of the move. Trend followers covered just enough to stop the bleeding, and the bulk of their short is still on the book. The fuel for a second leg is larger than the first one. ZeroHedge summed up the cross-asset link in one line: "the very thing creating the equity problem is solving the rates problem." An AI growth scare sends money into bonds, and every point of bond rally pulls the CTAs closer to the next trigger.
Term premium and the Fed
The term premium is the extra yield investors demand to lock in money for ten years rather than rolling short-term bills. The New York Fed's estimate (the ACM model) fell from 98.5 bp on October 8 to 63.9 bp on October 22, and from 75.6 bp to 63.9 bp this week alone.
The market removed part of the Fed's expected hikes. The gap between the SOFR futures contract three years out and today's SOFR rate (the benchmark overnight rate) fell from 76 bp on Monday to 58.5 bp on Friday, and December contracts stopped fully pricing another hike.
The MOVE index of Treasury volatility swung from 95.9 on Wednesday to 106.8 on Thursday and closed the week at 103.3.
The long end did not trade on supply this week; it traded on who is buying. As long as equity selloffs send long-term money into bonds, rallies like Thursday's will keep coming on the bad days for stocks.
3. Credit: still leading
US high yield spread: 340 bp, a 17-month high and the 99th percentile of the past year. The primary market saw the year's biggest wave of pulled deals.
Oracle five-year CDS: 314 bp on October 21, from 301 on October 16, after a peak of 329 on October 20. On September 25, I noted it at 237 bp (The Crash Fuse Is Lit). On October 13, one of my markers for the next phase was "five year CDS above the 260.9 of October 8" (US Macro: Where Are We as of October 2026?). It is now 53 bp above that level.
CoreWeave five-year CDS: about 1,100 bp, up from about 850 in early October. The spread of its 9% 2031 bond over Treasuries widened from 985 bp to 1,101 bp in one week.
Oracle 4.95% 2031 bond: 260 bp over Treasuries, from 235 bp.
SpaceX's $40 billion AI chip bond deal was snarled as borrowing costs across the sector rose.
Blue Owl ($OWL), a bellwether of private credit, trades 45% below its 52-week high.
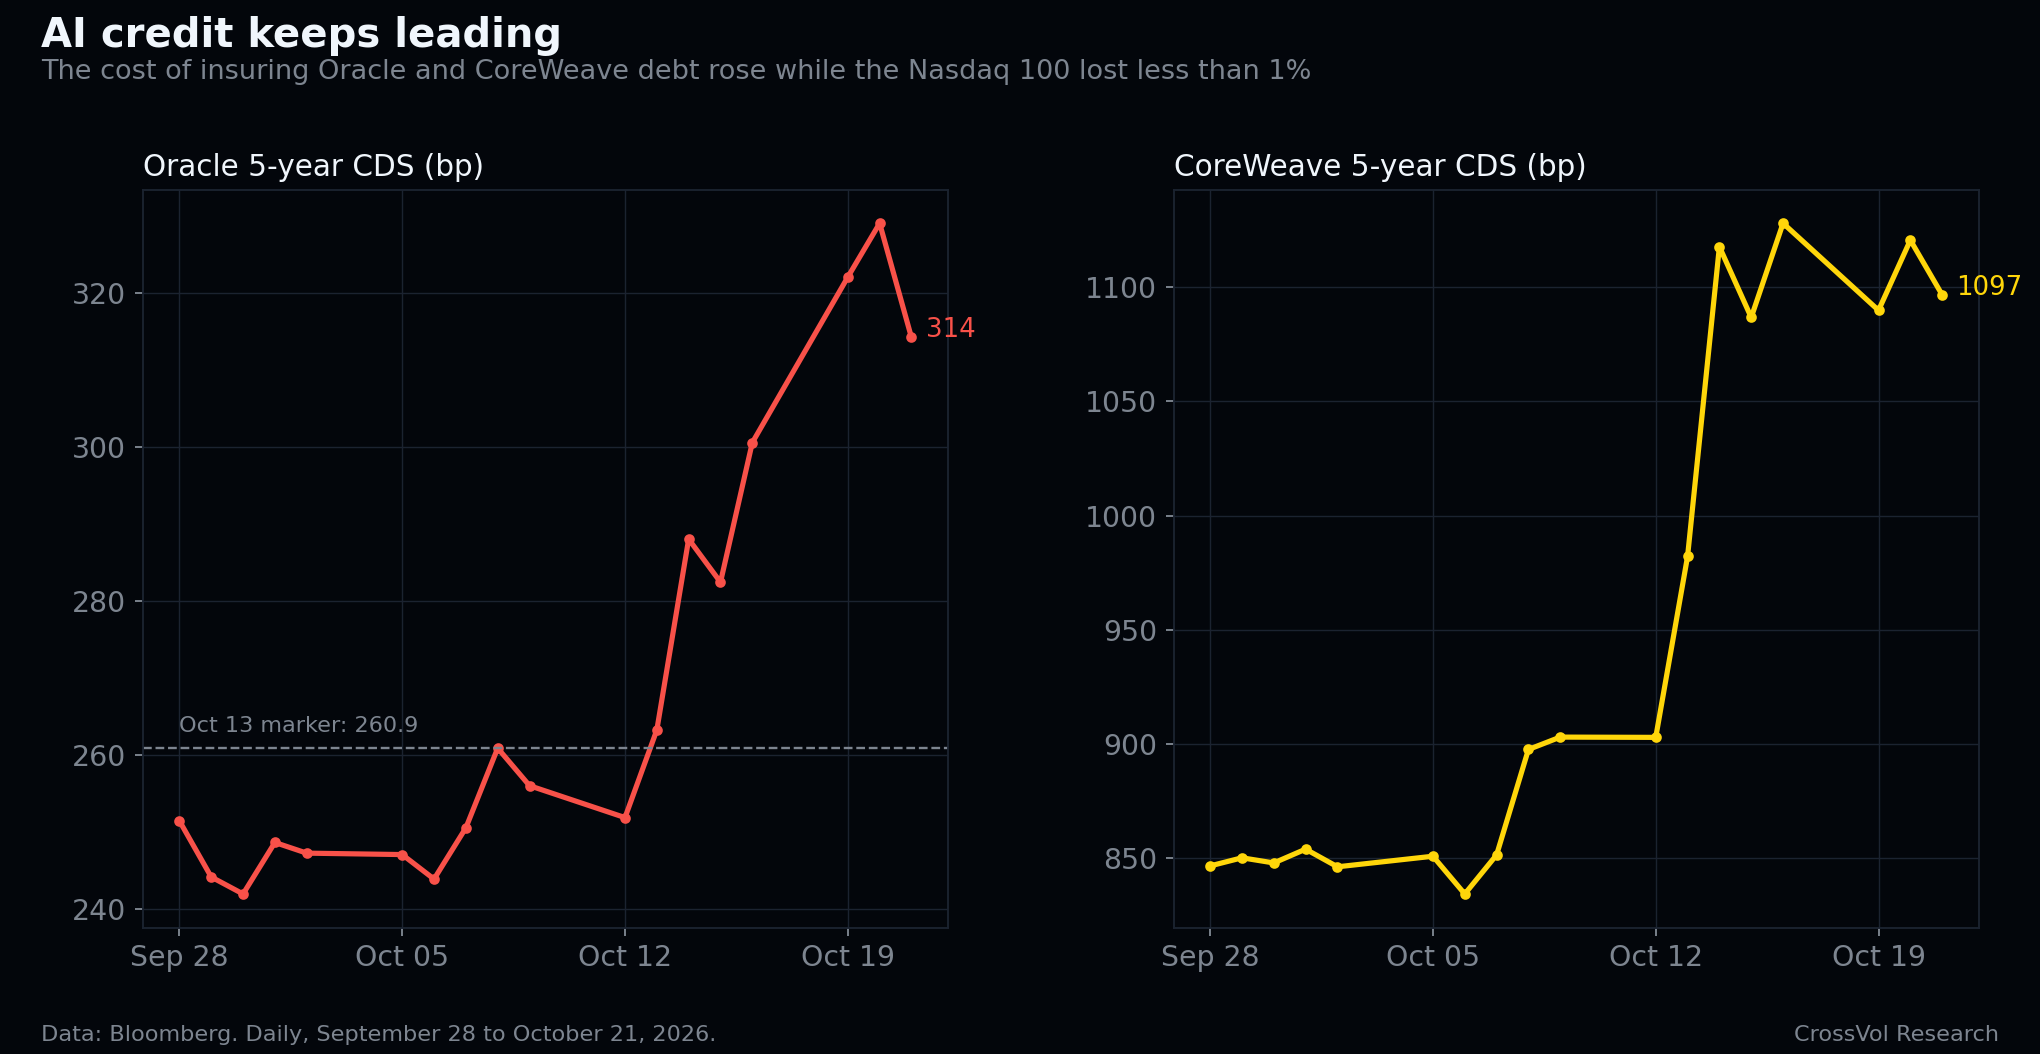
On October 13, my verdict was "early Act 4, through credit. The indices will see it last." This week, AI credit widened again and the Nasdaq 100 lost 0.8%. Credit is moving first, exactly in the order that piece described. The next markers to watch are cash high yield through 350 bp and the first decline in forward earnings estimates.
4. Volatility: a V inside an upward-sloping curve
Daily path, Monday to Friday (on Friday, October 16, the VIX closed at 19.99 and the oil volatility index at 50.7):
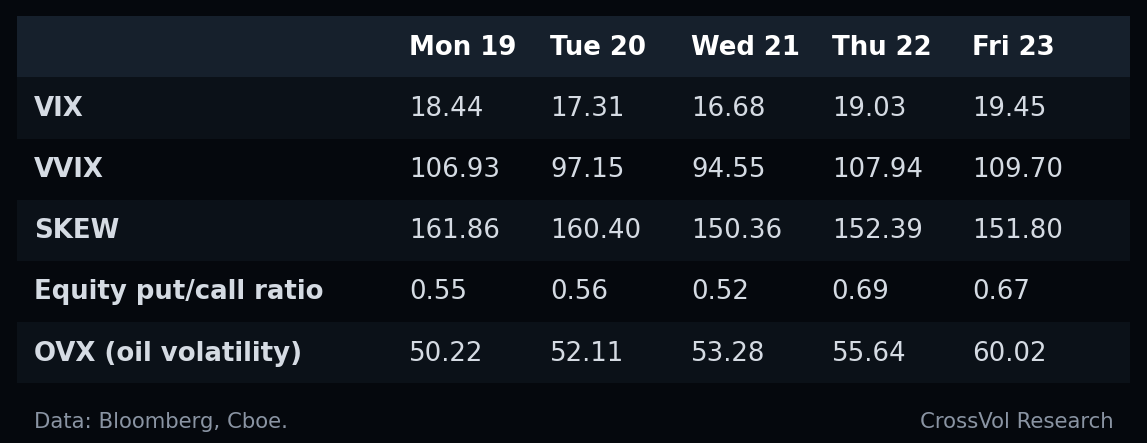
Definitions: the VIX is the 30-day implied volatility of the S&P 500, the market's price for expected swings. The VVIX is the implied volatility of the VIX itself; it rises when investors pay up for VIX calls, the classic institutional hedge against a volatility spike. The SKEW index measures the price of far out-of-the-money puts: above 150, options price a meaningful chance of a large drop. The put/call ratio compares put volumes to call volumes.
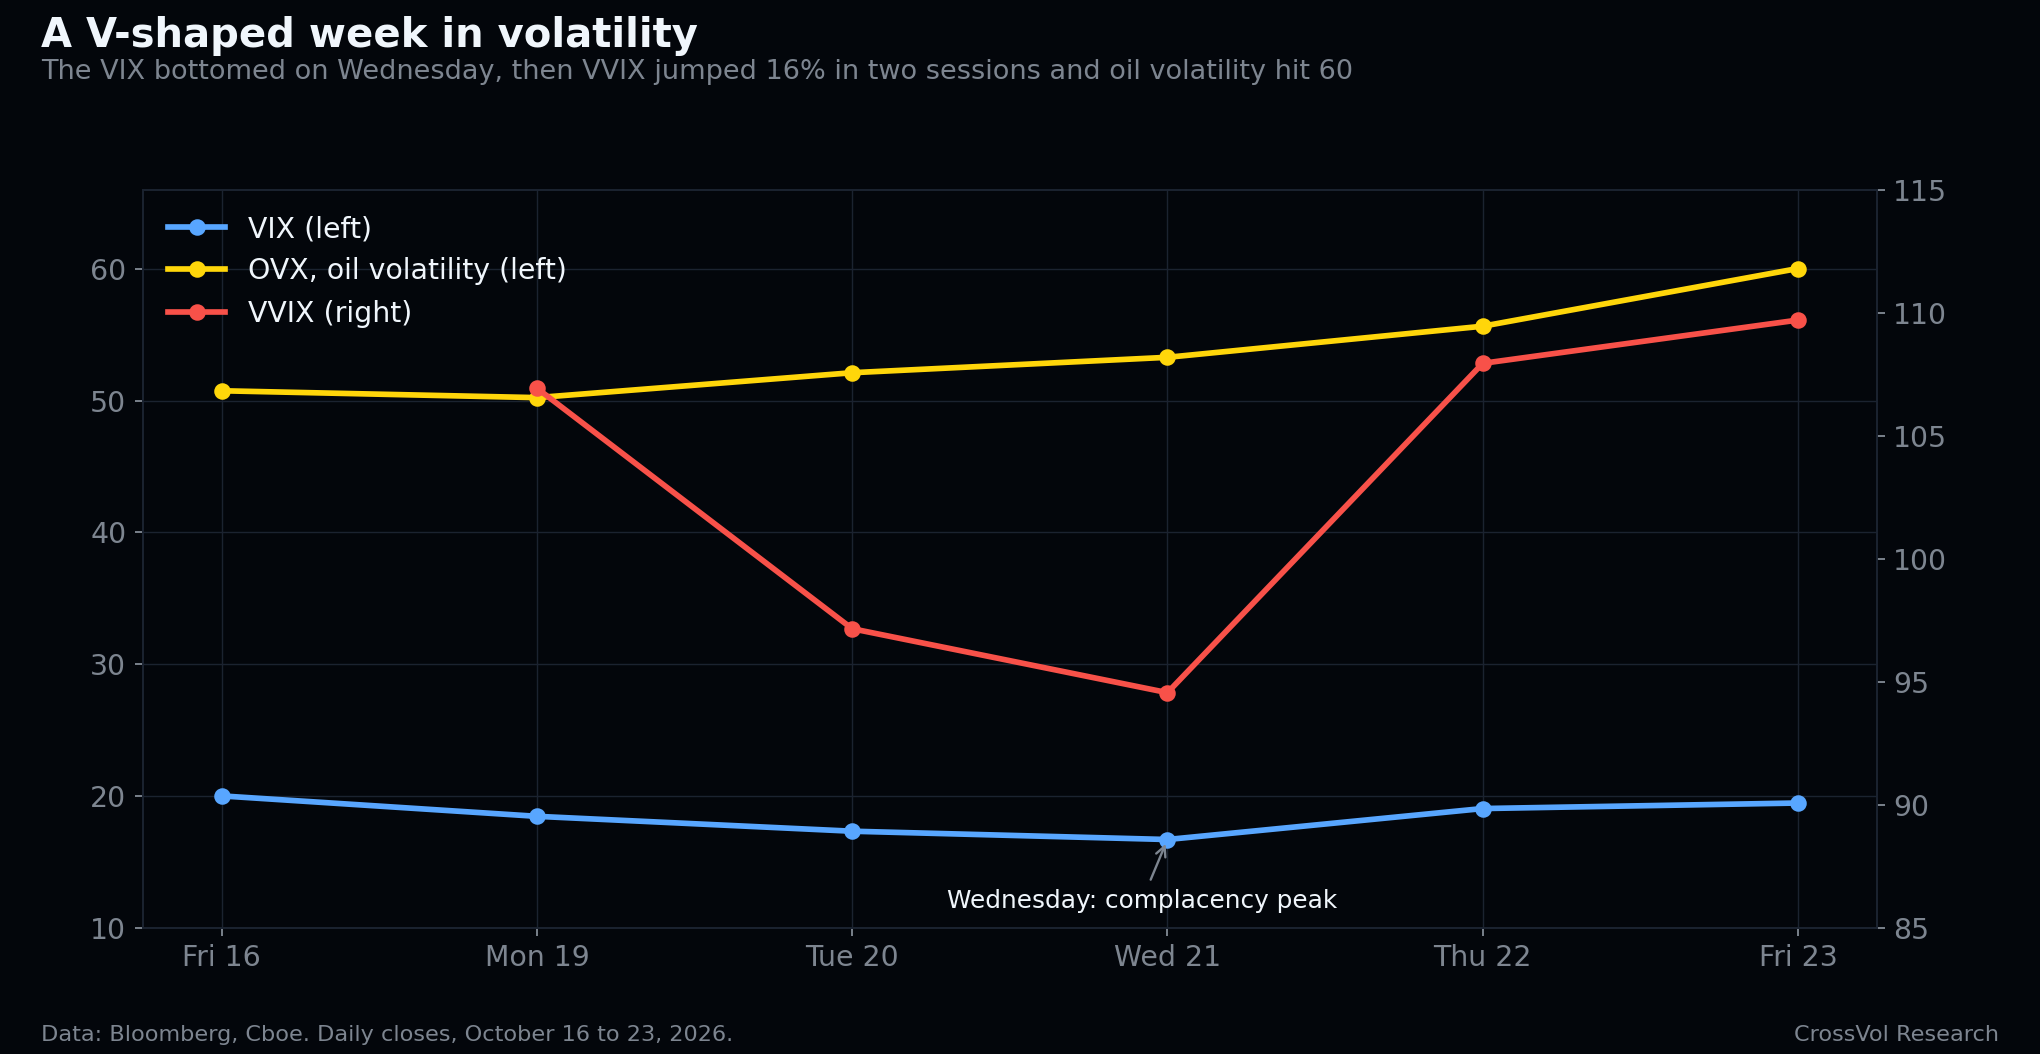
What the table says:
Complacency peaked on Wednesday. VIX 16.68, VVIX 94.55, put/call 0.52, SKEW 150: every gauge pointed to a breakout the day before the shock.
The volatility curve never inverted. The VIX stayed below its three-month equivalent (VIX3M) all week, a configuration called contango, with a ratio near 0.95 on Thursday. The market treated Thursday as a repricing within a range, not a crash.
VVIX rose 16% in two sessions, from Wednesday's low to 109.7, while the VIX stayed below 20. In September, I wrote: "A VVIX that keeps climbing from here would be the options market saying it no longer trusts the calm" (The VIX Is Too Calm for a 3.4 Sigma Rates Shock). This week's tape is consistent with that.
Downside protection is expensive. On Thursday, a "16-delta" S&P put, an option roughly one standard deviation out of the money, cost 1.8 times the equivalent call. The VIX traded 7.5 points above one-month realized volatility, the swings the index actually delivered.
Implied correlation stays low. The Cboe one-month implied correlation index (COR1M) sits at 10.9: options price individual stocks as moving largely independently. That keeps index volatility cheap relative to single-stock volatility.
5. Oil: the risk premium sits in the curve
Brent ($BNO) +6.24% to $116.72, near its March 31 peak of $118.35. WTI ($USO) +1.83% to $103.27. The Brent-WTI gap reached $13.45: the geopolitical premium sits in the international benchmark, closest to the Gulf.
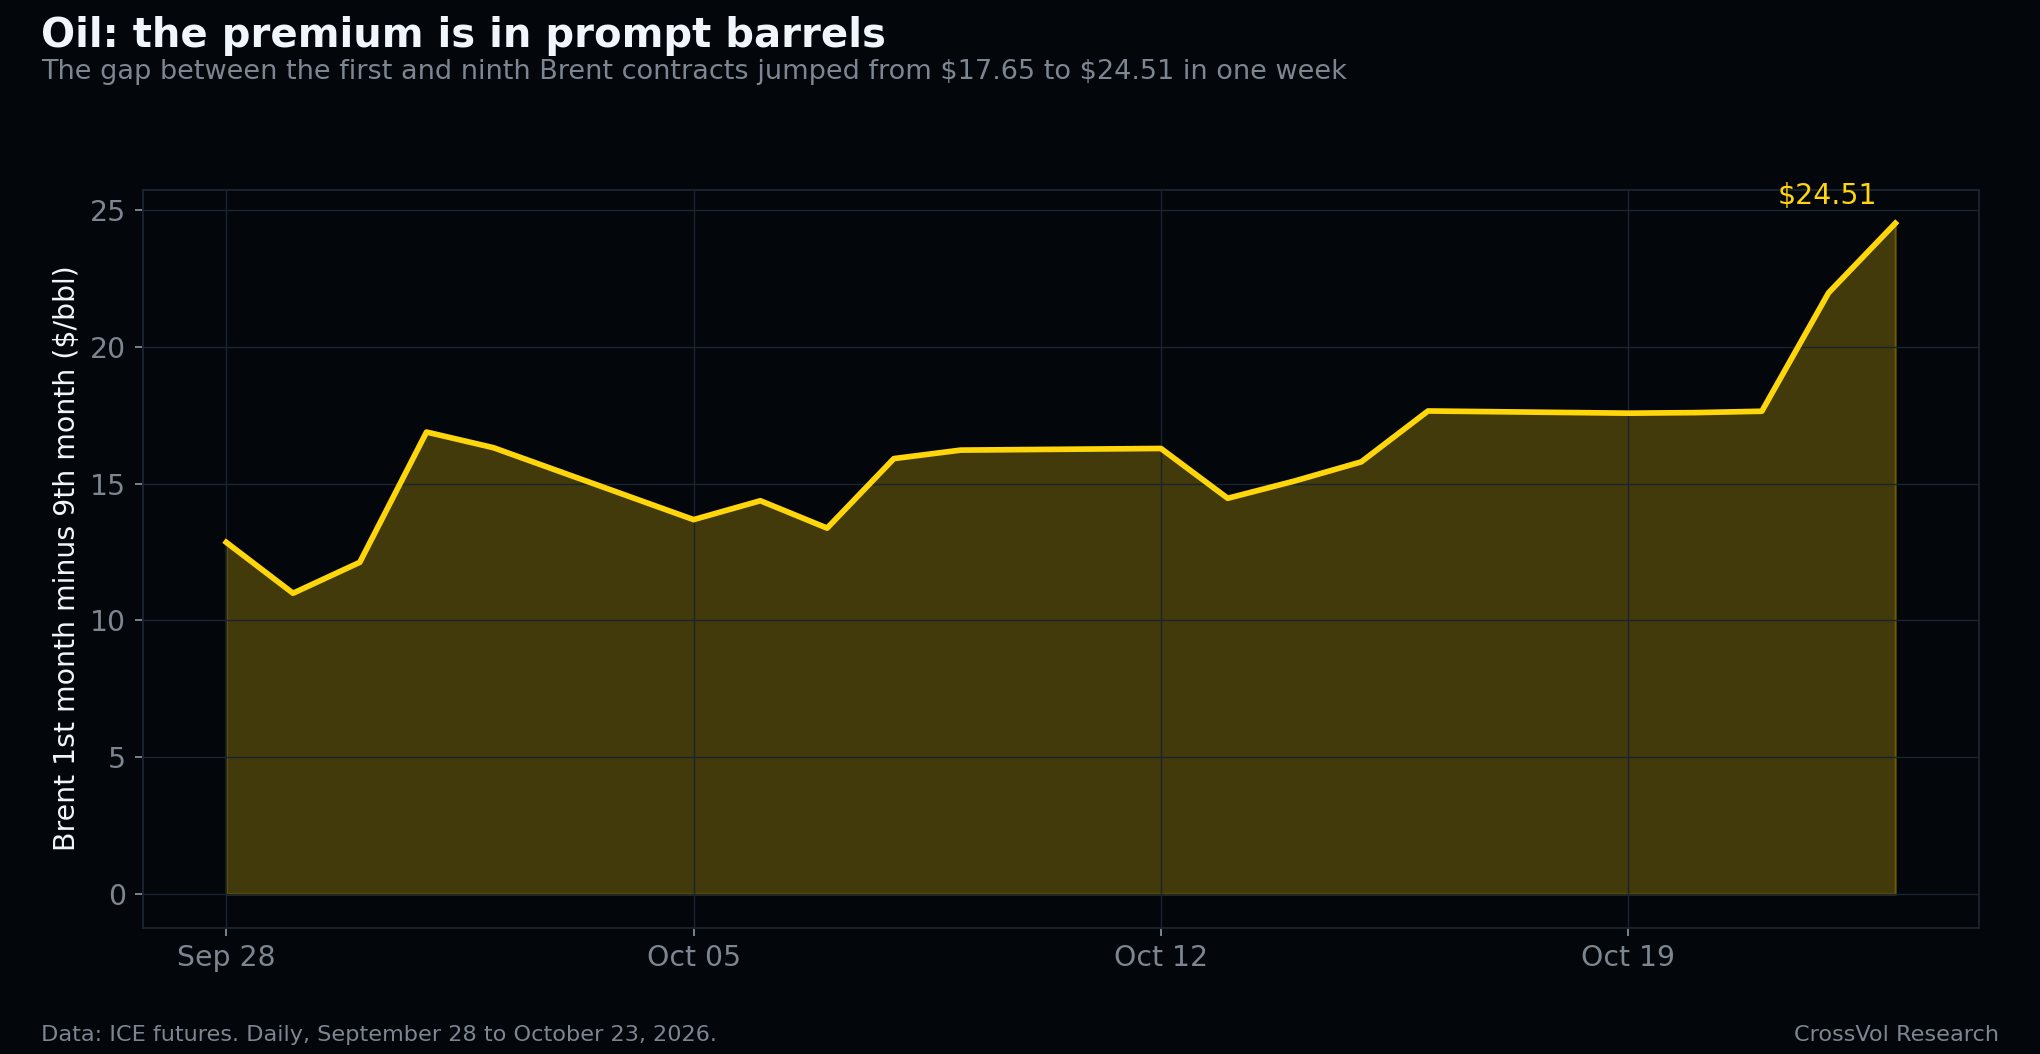
An extreme backwardation. The gap between the first and ninth Brent contracts widened from $17.65 to $24.51 in one week. Backwardation means near-term barrels cost more than later ones: buyers pay a premium for immediate supply.
Oil volatility (OVX) rose from 50.7 to 60.0, +18% on the week.
Strait of Hormuz: transits ran at about 7 ships a day, according to IMF PortWatch data. Tankers were hit, Aramco evacuated its Dhahran headquarters, and the US asked diplomats to leave Saudi Arabia.
Positioning, in futures data released at the start of the week: money managers raised Brent net longs to a one-month high while WTI net longs were the smallest since early August.
According to export figures cited in the market this week, Gulf exports have recovered to 17 to 18 million barrels a day, above pre-war levels. Futures price the risk of disruption more than a measured shortage. That makes the downside violent in case of a ceasefire, and the upside violent in case of a real closure.
My October 17 piece (Oil Above $100) described energy "settling on a higher plateau", with trend followers already long and few sellers left to absorb a fresh shock. This week's $7 jump in Brent, met by almost no selling, is that mechanism at work.
6. Gold, the dollar and crypto
Gold ($GLD) is under pressure: -4.07% on the week, including 2.8% on Thursday, the same day Treasury yields dropped 16.6 bp. A haven asset falling on a flight-to-quality day usually points to liquidity needs: investors sell what they can to meet margin calls elsewhere, and on that day the haven of choice was Treasuries, not gold. I treat it as a warning sign for next week.
The euro lost 0.3% against the dollar as France weighed. Bitcoin fell to about $81,600 early in the week as the tech selloff cooled risk appetite.
7. Europe: France decouples
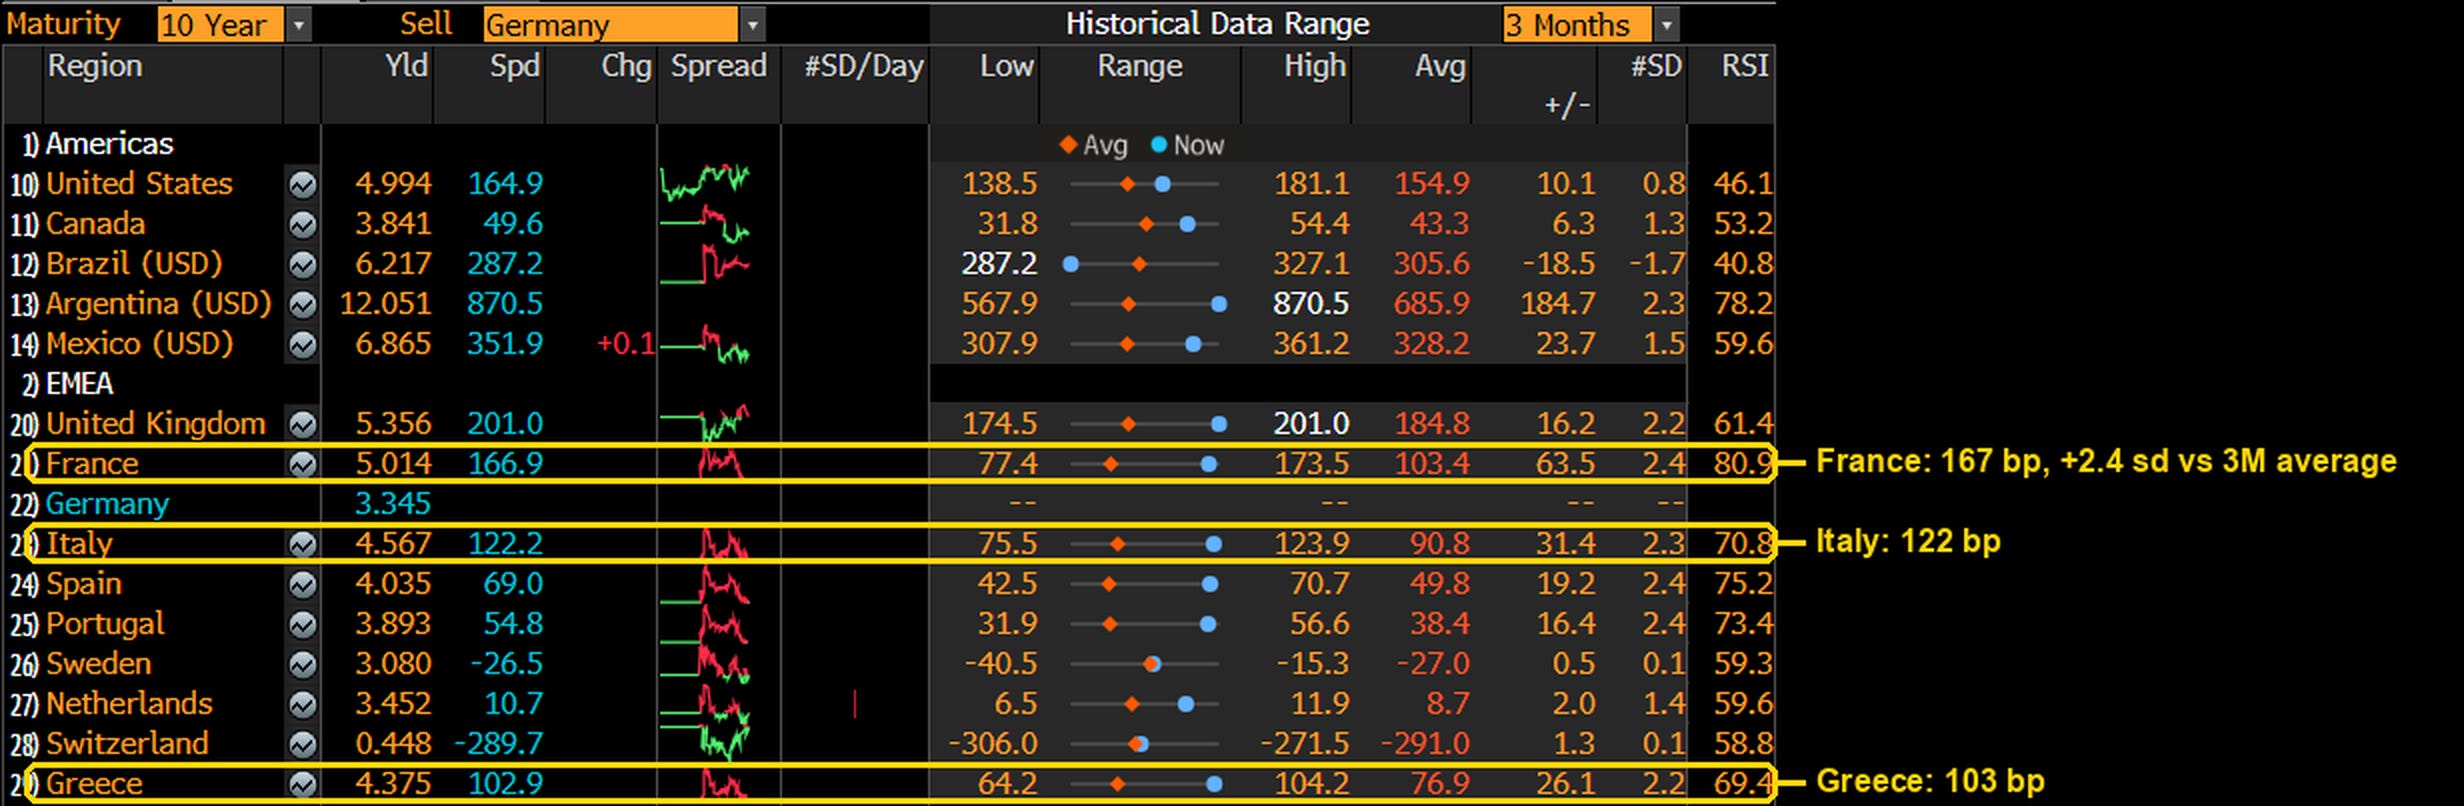
The French 10-year yield rose 21 bp to 5.02% while the German one fell 8 bp. The OAT-Bund spread (French minus German 10-year yield) widened 29 bp to 167 bp, after reaching 178 bp on Thursday. France now pays more than Italy (122 bp over Germany) and Greece (103 bp), and its five-year CDS (106 bp) is wider than Mexico's. Moody's kept France at Aa3 with a negative outlook on Friday evening, one notch above S&P and Fitch.
The CAC 40 lost 2.2% on the week and is the only major European index down for the year (-4.5%). Swiss stocks are becoming a refuge: the SMI is up 4.6% in October while the Euro Stoxx 50 is down 3.2%.
The street calendar is loaded: the yellow vests call for pot-banging protests in front of the National Assembly on October 30, and the unions have called a general strike starting November 5.
I have tracked this spread since September: 86 bp on September 4, 104.6 bp on September 18 (Dispersion and the OAT-Bund Channel), 141 bp on October 4 (Volatility Is Starting to Talk Even While the VIX Sleeps), 167 bp now. The full analysis, including the political and constitutional risk behind the move, is in today's separate piece.
8. Flows
Equity funds took in $55.6 billion in the week to October 21, money market funds $28.8 billion, bonds $12.1 billion and gold $2.6 billion, according to BofA.
China equity funds saw $17 billion of inflows and technology funds $18.8 billion, the largest since July: investors bought the dip.
Emerging market bond funds recorded 12 straight weeks of inflows.
ICI data show US mutual fund outflows at a record, while equity ETFs keep gathering assets: the shift from mutual funds to ETFs continues.
9. What this week confirmed
The OAT-Bund widening is "a structural repricing, not a headline" (Sep 19). This week: 104.6 bp then, 167 bp now, 178 bp on Thursday.
Cross-asset volatility talks before the VIX, with France at the epicenter (Oct 4). This week: France +29 bp, oil volatility +18%, VVIX +16% from Wednesday.
Oracle credit insurance is the fuse of the AI financing story (Sep 25). This week: Oracle 5Y CDS 237 bp then, 314 bp now.
The next phase arrives through AI credit and the indices see it last (Oct 13). This week: Oracle above the 260.9 marker, CoreWeave about 1,100, high yield at a 17-month high, Nasdaq 100 -0.8%.
Long-term money that skips equities buys bonds, and the bond hedge returns (Oct 15). This week: Stock-bond correlation 50% to 19%, term premium 98.5 to 63.9 bp, Treasuries up on the worst equity day.
On AI selloff days, yields fall with stocks (Oct 18). This week: Thursday: semiconductors -6.7%, 10-year yield -16.6 bp.
A climbing VVIX means the options market no longer trusts the calm (Sep 23). This week: VVIX 94.5 to 109.7 while the VIX stayed under 20.
Energy settles on a higher plateau, with few sellers left (Oct 17). This week: Brent +6.2% to $116.72, backwardation at $24.51.
Six weeks of posts, one consistent read: credit and cross-asset volatility move first, long-term money rotates from stocks into bonds, and the headline indices are the last to show it.
10. Next week: the Fed has no good option, and only the megacaps can save the market
The Fed's lose-lose
The futures market does not expect a Fed hike on Wednesday, October 28. Fed funds futures priced only a 9.4% probability of a hike at the October meeting on Friday's close, against 75% for December 9, and a policy rate peaking at 4.56% in October 2027, about 2.7 hikes above today's 4.00% target.
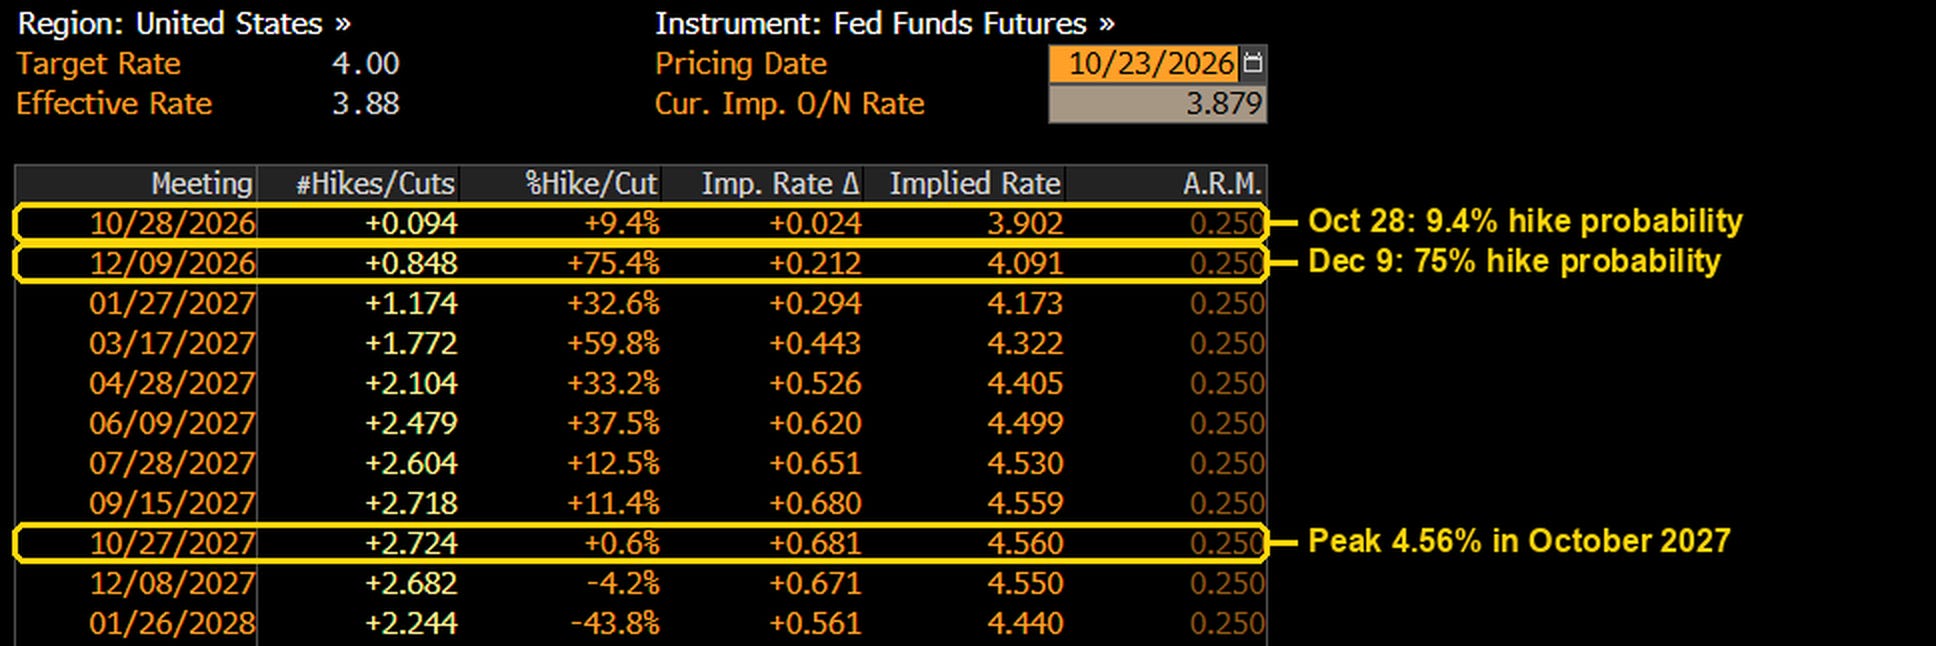
My view is that both outcomes are negative for stocks.
If the Fed holds, it falls further behind inflation. The data are moving the wrong way:
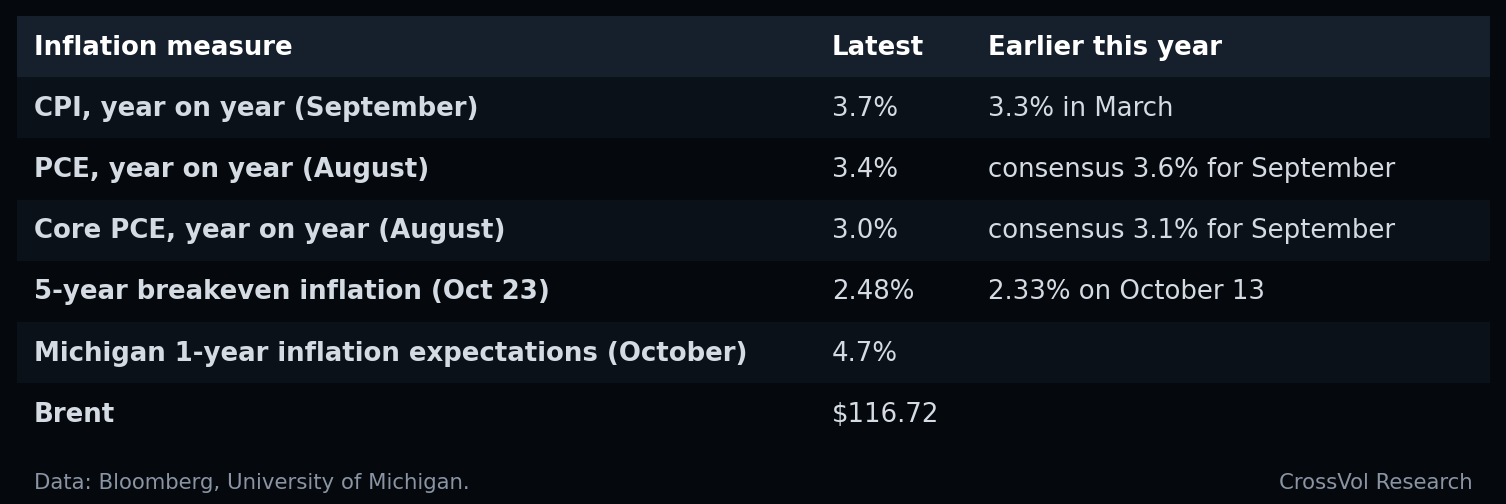
With the effective fed funds rate at 3.88%, the real policy rate, the policy rate minus inflation, is barely positive: about 0.2 point against CPI and 0.5 point against PCE. Policy is hardly restrictive while inflation is rising and oil is above $115. A hold on Wednesday, followed by a hot PCE print on Thursday, would tell markets that the Fed is behind the curve. That raises the inflation risk premium in long yields, and higher discount rates compress equity valuations, starting with the long-duration growth stocks that dominate the index.
If the Fed hikes by surprise, it tightens financial conditions into a fragile tape. With less than a 10% probability priced, a hike would be a genuine shock. Financial conditions are still easy: the Bloomberg US Financial Conditions Index stands at +0.80, above its long-run average, but it already fell from +1.21 on October 13 as credit spreads widened. A surprise hike would push the dollar and real yields up, widen credit spreads that are already at a 17-month high, and hit a market where volatility-targeting funds would sell about $15 billion of stocks for every 1% daily move.
Either way, the Fed is not the catalyst that rescues equities next week.
A Fed hold is the trigger for the next leg of the Treasury squeeze
The bond market reads the same decision very differently. A hike would push short rates up and extend the CTA short a little longer. A hold does the opposite. December contracts already stopped fully pricing another hike this week. A Fed that stays put on Wednesday, while growth stocks sell off on AI capex fears, lets front-end futures rally further. That is exactly the move that brings the three-month CTA window within reach.
Once that window flips, the buying is mechanical, not discretionary: about $264 billion of STIRs and $256 billion of bond futures for a 2% rally, against limited selling the other way. With CTAs still at the 12th percentile of their bond positioning, a hold could turn last Thursday's 16.6 bp drop in the 10-year yield into the first leg of a much larger squeeze, and probably a dramatic one.
That is the cruel symmetry of next week. The same hold that leaves the Fed behind inflation and hurts equity valuations would feed one of the largest forced bond-buying setups of the year. Bonds would keep doing the hedging job. Stocks would still need the megacaps.
Only the megacaps can rescue the market
If anything turns the tape, it is the largest companies in the index, and they report in the same 48 hours as the Fed, GDP, PCE and the ECB:

The setup favors a sharp move in either direction:
Upside fuel. Hedge fund short leverage sits at the 99th percentile, concentrated in AI infrastructure. If Microsoft, Alphabet and Amazon defend their AI spending with visible revenue, the shorts held as financing collateral can be covered within one or two sessions.
Downside risk. Hedge funds hold a record 22% of their exposure in the Magnificent 7. Meta showed the template on October 22: more capex without more revenue meant -7% in one session and a semiconductor crash. A repeat from Microsoft or Alphabet would remove the last support of the cap-weighted index.
So the week comes down to one question: can the megacaps outrun the Fed? If their results are strong enough to offset a Fed that is either late or hawkish, the index holds. If not, there is no other buyer in sight.
The full calendar
Sun Oct 25. Brazil presidential runoff. What would move markets: A contested result would hit the real and emerging market carry trades.
Tue Oct 27. Durable goods (Sep), Conference Board confidence (Oct), new home sales. Consensus: +1.9% / 80.9 / 650k.
Wed Oct 28. FOMC decision. Consensus: Hold (9.4% hike probability). What would move markets: A hold with a dovish tone: behind the curve. A surprise hike: tighter conditions.
Thu Oct 29. US Q3 GDP (advance), September PCE inflation. Consensus: GDP +3.2%, PCE 3.6% y/y, core 3.1%. What would move markets: Hot PCE: December hike priced fully, 10-year back above 5.10%.
Thu Oct 29. Microsoft and Alphabet results. What would move markets: AI revenue versus AI spending.
Thu Oct 29. ECB decision. Consensus: Pause. What would move markets: Any language on its bond backstop for France.
Fri Oct 30. Amazon results.
Fri Oct 30. Employment cost index (Q3), Chicago PMI. Consensus: +0.8% / 56.1. What would move markets: Wage inflation, a key Fed input.
Fri Oct 30. Bank of Japan. What would move markets: A December hike signal would lift the yen and pressure carry trades.
Fri Oct 30. Yellow vests "casserolades" (pot-banging protests) in front of the French National Assembly. What would move markets: First test of the protest bans.
Mon Nov 2. Apple results.
Tue Nov 3. US midterm elections. What would move markets: The window for an Iran strike after the vote is the oil market's binary risk.
Thu Nov 5. General strike in France, called by the unions. What would move markets: The biggest street test for French spreads since the crisis began.
Consensus: Bloomberg surveys.
Bottom line. Markets enter the week with the VIX near 19.5, the MOVE near 103, oil volatility at 60, a broken AI momentum trade and a historically wide OAT-Bund spread. The Fed cannot help: holding leaves it behind rising inflation, and a surprise hike would tighten conditions into a fragile market. For bonds, a hold is the spark: CTAs are still short, with about half a trillion dollars of systematic buying waiting on a 2% rally. The only possible rescue for stocks comes from Microsoft, Alphabet and Amazon. The signal I will watch most closely besides their results is gold: if it keeps falling with yields, liquidity rather than growth is driving the tape.
FAQ: the week of October 19, 2026 in four questions
Why did semiconductor stocks fall on October 22, 2026? A supply warning from Lam Research and Meta's plan to raise AI capital spending again, funded through a new share class, made investors question who pays for the AI build-out. The Philadelphia Semiconductor Index fell 6.72% that day.
Why did Treasuries rally while stocks fell? Money left AI stocks for bonds, and speculators who were heavily short Treasury futures had to buy them back. The 10-year yield fell 16.6 bp on Thursday to 4.95%, and stocks and bonds hedged each other again. Trend-following funds are still net short bonds after covering, which leaves room for a larger squeeze.
Are hedge funds bearish? Their net exposure is the lowest in five years, but much of the record short position finances their long bets rather than expressing a view against the market. Their exposure to the Magnificent 7 is a record 22%.
Will the Fed hike on October 28, 2026? Futures priced only a 9.4% probability on October 23, against 75% for December. With CPI at 3.7% and the real policy rate barely positive, a hold risks leaving the Fed behind inflation, while a surprise hike would tighten financial conditions.
What are the key events for the week of October 26, 2026? The Fed on October 28; US GDP, PCE inflation, the ECB and results from Microsoft and Alphabet on October 29; Amazon and the Bank of Japan on October 30; Apple on November 2.
Further reading on CrossVol Research
France Bond Crisis: The OAT-Bund Spread Hits 178 bp and France Now Pays More Than Italy and Greece (October 25, 2026)
The Pension Valve Only Opens One Way (October 15, 2026)
The VIX Woke Up Loaded the Other Way (October 18, 2026)
Oil Above $100: What Futures Curves, Crack Spreads and Gas Spreads Say (October 17, 2026)
US Macro: Where Are We as of October 2026? (October 13, 2026)
Volatility Is Starting to Talk Even While the VIX Sleeps (October 4, 2026)
The Crash Fuse Is Lit (September 25, 2026)
The VIX Is Too Calm for a 3.4 Sigma Rates Shock (September 23, 2026)
Dispersion and the OAT-Bund Channel (September 19, 2026)
This article is for educational purposes only and does not constitute investment advice or a recommendation to buy or sell any security. Equities, bonds, futures, CDS and options carry substantial risk, including the loss of more than the initial investment for leveraged instruments. Past patterns do not guarantee future results.