


By Djellal Djouad. October 15, 2026.
Market commentary for educational purposes. This is not investment advice and not a recommendation to buy or sell anything. Levels are as of 4:00 am New York time on Thursday, October 15, 2026, unless another time is given, and markets move fast. Options, futures and bonds carry a high risk of loss.
At 8:30 am New York time on Wednesday, October 14, the September consumer price index came out hot. Prices rose 0.6 percent on the month and 3.7 percent on the year, against 3.6 percent expected. Core prices, which leave out food and energy, rose 0.3 percent on the month against 0.2 percent expected, and 2.6 percent on the year, up from 2.4. Treasuries were sold on the print, as they should be after a number like that. Then the long end came back, and it came back further than it had fallen. By 2:25 pm the ultra bond future, which tracks Treasuries maturing in about 25 to 30 years, had won back 133 percent of its post CPI loss. The 2 year note future had won back 89 percent. On the Treasury's own daily curve, set from prices at about 3:30 pm, the 2 year yield ended 3 basis points higher at 4.82 percent and the 30 year 4 basis points lower at 5.52 percent. The S&P 500 closed down 1.11 percent at 7,718.94.
In plain terms. A bond's price and its yield move in opposite directions: when buyers push a bond's price up, the yield a new buyer locks in goes down. A basis point is one hundredth of a percentage point. So a hot inflation number pushed short term yields up, as you would expect when the Fed may have to hike again, and yet the longest bonds ended the day more expensive than they were just before the number. Someone bought the long end, and mostly the long end, while stocks kept falling.
My reading is this. The 100 largest US corporate pension plans were 114.5 percent funded on September 30, meaning their assets covered 114.5 percent of the pensions they have promised, their best level since June 2001. At that level, the trigger of liability driven investing, or LDI, works only one way: sell equities, buy the long end, and keep cutting equity exposure. LDI is the practice of running a pension's assets so that they move like its promises to retirees, above all when interest rates move. October 14 showed that trigger at work during US trading hours, in three waves. Overnight, the unwind of the AI trade in Asia added equity selling of its own, and it will not bring the pensions back to buy.
What I wrote three weeks ago
On September 25, in The Crash Fuse Is Lit, I wrote that "US corporate pension funding ratios are near 25 year highs" and that selling equities to buy long duration bonds "is the mechanical output of every major pension's glide path policy." I also set the limits of that bid. "Glide paths are slow," I wrote. "It is a structural tailwind, not a tactical floor." On insurers: "they buy investment grade corporates, not Treasuries." And my conclusion: "The 'pension bid saves the trade' argument is a tailwind, not a backstop."
The same piece put a date on the risk. "Quarter end is not a tail scenario," I wrote. "It is the scheduled moment when every mark to market loss in this chain becomes a reported number." That line was about the chain of debt that finances AI. It holds just as well for pensions, because quarter end is also when the funded ratio becomes a reported number, the one investment committees act on.
Three things have changed since. The September 30 measurement came in at 114.5 percent, with the accounting discount rate at its highest since 2009, and that very likely put many plans across new steps of their glide paths, the schedules that cut equities as funding improves. The CPI day showed the bid during US hours, strongest in the long end, with stocks sold at the same time. And the AI trade is now unwinding, which adds equity selling that the pensions will not absorb. One thing has not changed. A tailwind is still not a backstop, and I come back to that at the end.
October 14, in three waves
I timed the day on CME Treasury futures and the S&P 500 future, December 2026 contracts, in 5 minute bars, New York time. Bond futures rise when yields fall. The six Treasury contracts run from the 2 year note (ZT) through the 5 year (ZF), the 10 year (ZN), the ultra 10 year (TN) and the bond (ZB) to the ultra bond (UB).
Wave 1, bonds bid into the print. From the reopening at 6:00 pm on Tuesday to 8:25 am on Wednesday, Treasury futures gained across the curve, about 2 basis points in yield terms: 0.375 point on the ultra bond, 0.17 on the 10 year, 0.05 on the 2 year. Bloomberg tied the move to a rally in UK gilts, and CME data showed new long positions added in 2 year and 5 year futures on Tuesday.
Wave 2, sold on the print. At 8:30 am the number hit, and every Treasury contract made its low at 8:55 am. The front end led. On Bloomberg, the 2 year yield jumped as much as 16 basis points, to about 4.95 percent, and the 30 year peaked at 5.62 percent shortly after 9:00 am. That is a bear flattener: yields rise, short yields rise more than long ones, and the curve between them flattens. The gap between the 30 year and the 2 year yields, the 2s30s curve, fell from about 77 basis points before the print to 67.2 at 9:00 am. After the print, the market put the odds of another Fed hike on October 28 at about 54 percent, according to Bloomberg. The Fed had already raised its target range by a quarter point on September 16, to 3.75 to 4.00 percent.
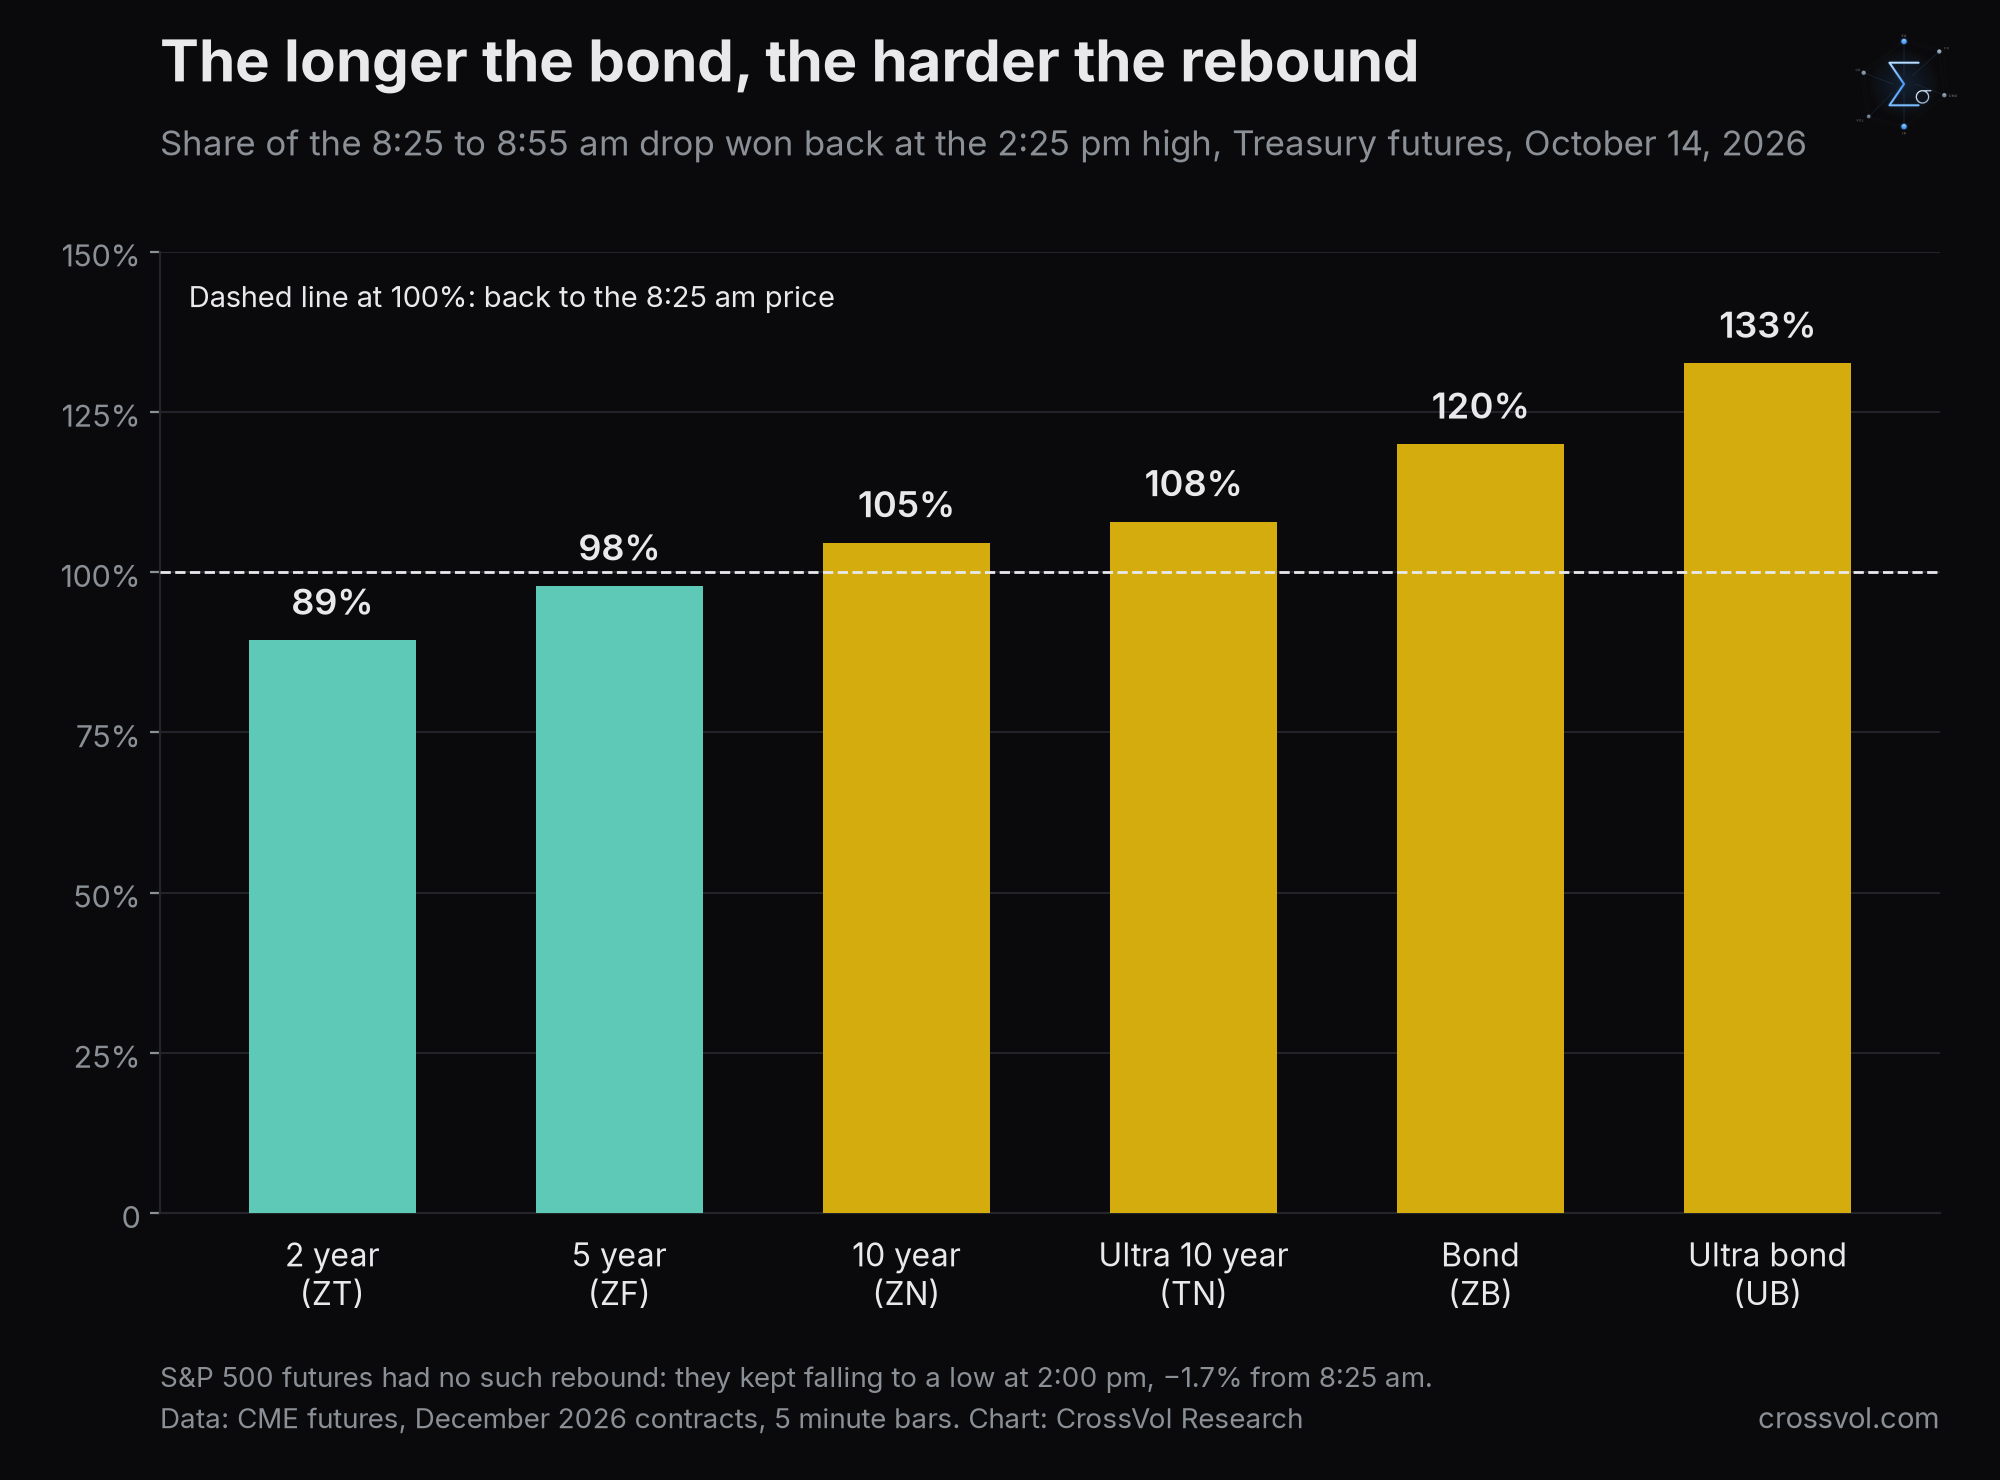
Wave 3, the long end comes back. From the 8:55 am low to a high at 2:25 pm, every Treasury future recovered, and the longer the maturity, the more it recovered. Measured against what each had lost between 8:25 and 8:55 am, the 2 year won back 89 percent, the 5 year 98 percent, the 10 year 105 percent, the ultra 10 year 108 percent, the bond 120 percent and the ultra bond 133 percent. Above 100 percent, a contract is back above its price from before the print. Bloomberg's headline on the move read "Treasuries Long-End Bounces Back, Leading a Post-CPI Recovery," and a US rates trader it quoted attributed the buying to both real money and fast money. Real money means long term investors without leverage who buy to hold, such as pensions, insurers and asset managers. Fast money means leveraged, short horizon traders such as hedge funds and CTAs, the trend following funds.
Stocks did the opposite. The S&P 500 future stood at 7,878.5 at 8:25 am and kept falling while the long end climbed, to a low of 7,741 at 2:00 pm, 1.7 percent below its level before the print. Between the 8:55 am low and the 2:25 pm high, the ultra bond future gained 1.9 points, or 1.8 percent. From 8:55 am to its 2:00 pm low, the S&P 500 future lost another 1.1 percent.
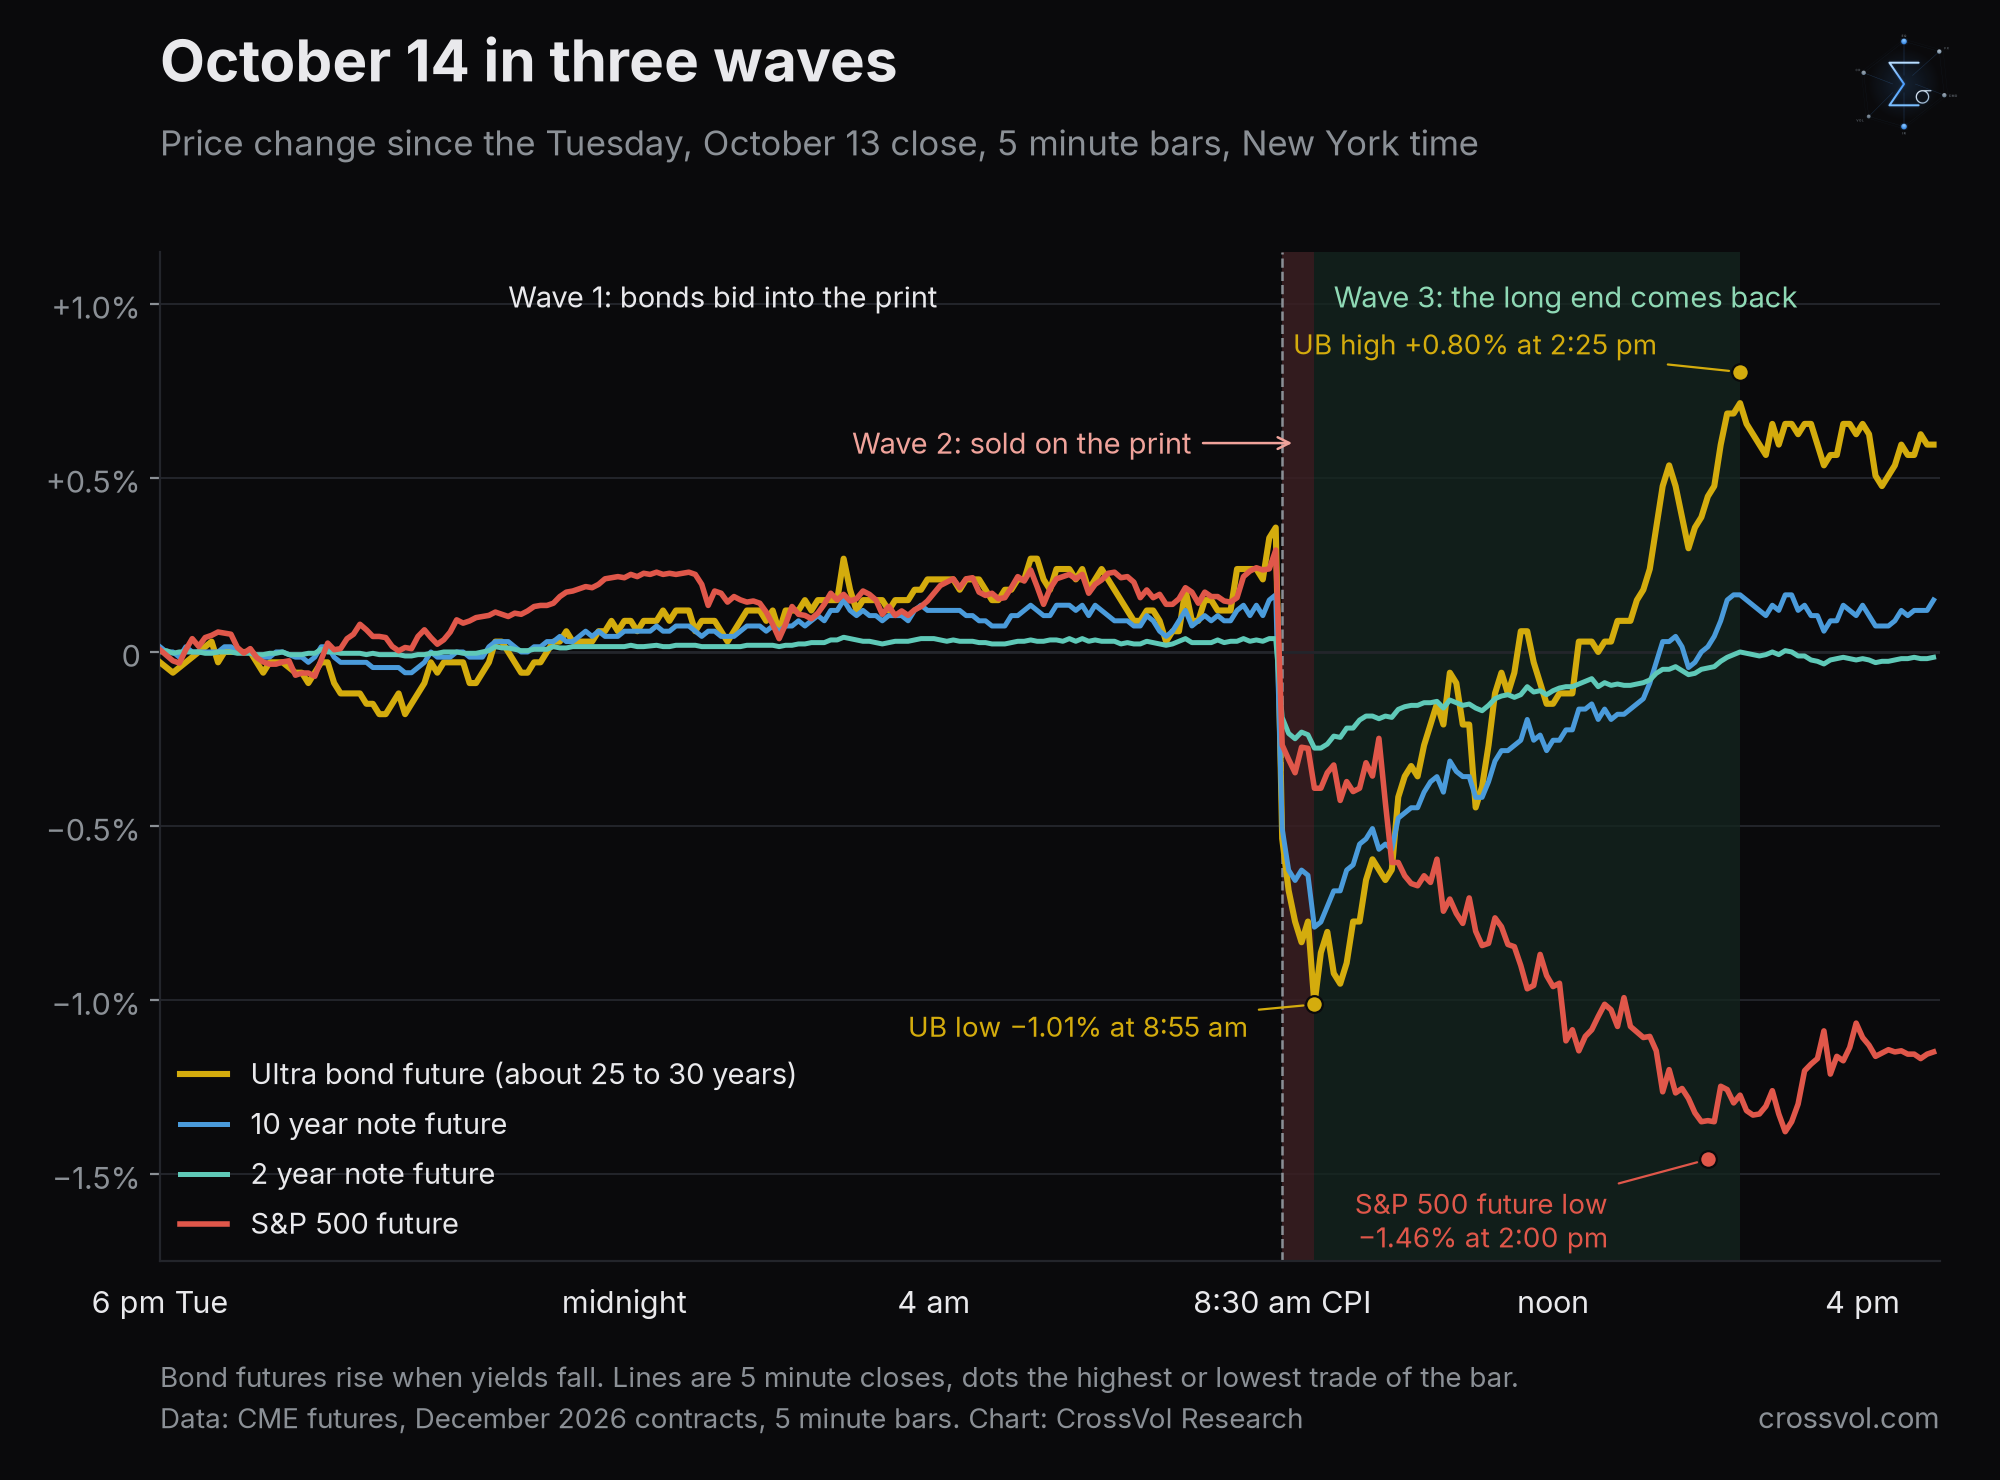
The day ended in a twist, short yields up and long yields down. On the Treasury's curve, set at about 3:30 pm, the 2 year yield rose 3 basis points to 4.82 percent and the 10 year fell 2 to 5.19 percent. The 20 year fell 3 and the 30 year 4, to 5.52 percent. In futures, the 2 year closed below its price from just before the print, and the ultra bond closed 0.25 point above it, 0.6 percent above Tuesday's close. A hot inflation number, a front end that won back most of its loss but not all of it, a long end that more than recovered, and stocks that stayed sold.
Why "opportunistic buying" does not fit
The first explanation you hear for a day like this is opportunistic buying: yields spiked, investors with cash saw value, and traders who were short took their profits. Some of that surely happened, and the trader Bloomberg quoted said fast money was there too. But three facts do not fit a story of value hunters alone.
First, the choice of maturity. The 2 year cheapened most after the print, about 16 basis points at the peak against roughly 7 for the 30 year, measured from Tuesday's close. A buyer looking only for value had more of it at the front end. The bid went to the long end instead, and the recovery rose step by step with maturity, from 89 to 133 percent. The new long positions added on Tuesday, the ones the print caught on the wrong side, were in 2 year and 5 year futures, and those are the two contracts that recovered least.
Second, the front end did not follow all the way. The 2 year never won back more than 89 percent of its loss and closed with a higher yield than before the print, and after the print the market priced slightly better than even odds of a hike on October 28. The long end did not rally because the market priced a softer Fed. It rallied because someone wanted long bonds. There is a macro reading of the same shape, in which a Fed that keeps hiking will slow the economy, so long yields fall while short yields rise. I do not rule it out, and it is probably part of the day. But it does not explain a bid that came in over five and a half hours, strongest in the longest contracts, two weeks after a quarter end that put many of the largest US pension plans across new derisking steps.
Third, stocks were sold while the long end was bought. On its own, that could be a plain flight to safety. Together with the first two facts, it is the signature of a buyer whose liabilities are long and whose equity target has just been cut.
Two pieces of evidence point the other way, and they deserve a straight answer.
ETF flows. Bloomberg data dated October 14 show 1.40 billion dollars out of SPY, the most traded S&P 500 fund, and outflows from bond funds too: 180 million dollars from TLT (Treasuries over 20 years), 269 million from IEF (7 to 10 years), 205 million from LQD (investment grade corporates) and 154 million from HYG (high yield). The only inflow among them was 16 million dollars into SHY, which holds 1 to 3 year Treasuries. If pensions were buying duration, meaning long bonds whose value moves most with rates, why did money leave long bond funds? Because pensions do not buy duration through ETFs. They buy it through separate accounts, cash bonds, STRIPS (zero coupon pieces of Treasury bonds), futures and swaps. Flows reported for a given day also often reflect orders from the day before. ETF flows neither prove nor disprove a pension bid. The shape of the curve during US hours is better evidence.
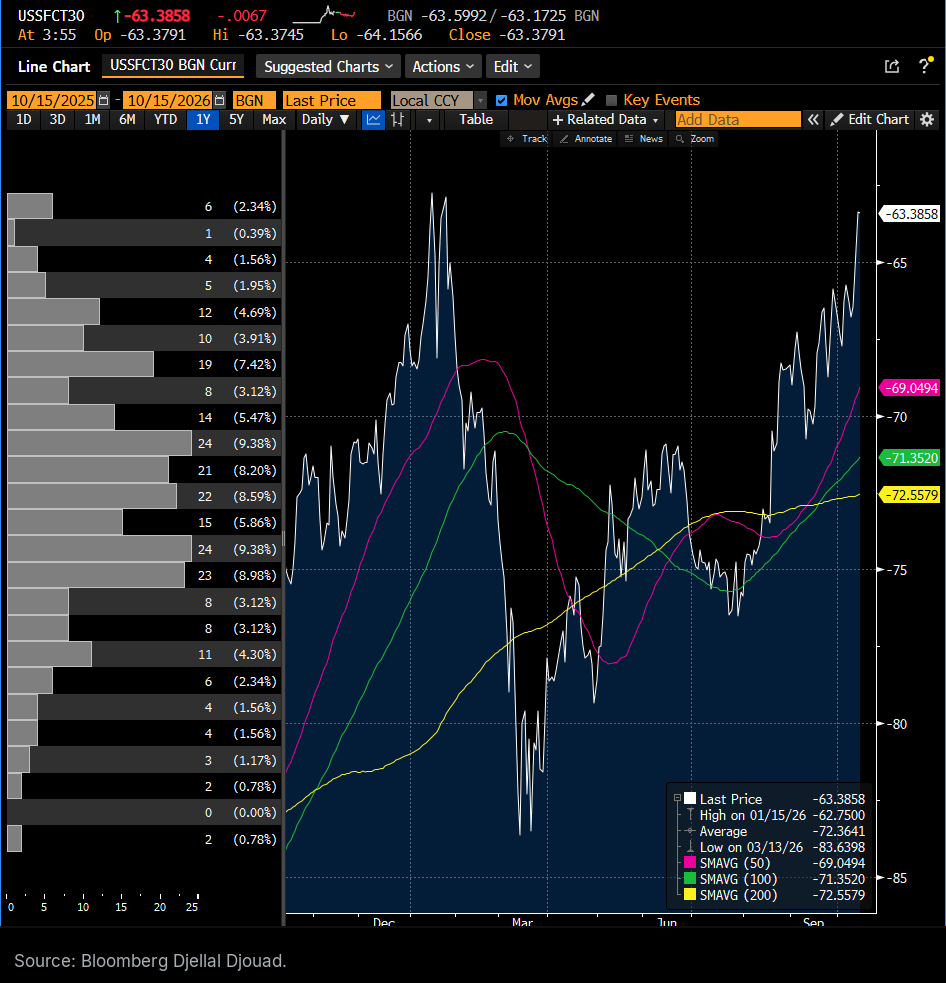
Swap spreads. A swap spread is the swap rate minus the Treasury yield of the same maturity. At 30 years it has been below zero for years, which means swaps yield less than Treasuries. When an LDI manager hedges with swaps, it receives the fixed rate, which pushes swap rates down and the spread further below zero. On October 14 the 30 year swap spread, on swaps tied to SOFR, the overnight rate published by the New York Fed, did the opposite. It closed at minus 63.38 basis points, its least negative level since January, and Bloomberg's headline that day read "Dollar Swap Spreads Back to Multi-Month Highs as Bonds Selloff." At 3:55 am this morning it stood at minus 63.39, against a one year range of minus 83.64 on March 13 to minus 62.75 on January 15. So there is no sign of a new wave of hedging through swaps. The move fits buying of cash bonds in the afternoon, which pushes Treasury yields down and lifts the spread, but the rise began during the selloff, so it does not prove it.
LDI in one page
A corporate defined benefit plan promises employees a pension for life. The plan's liabilities are the present value of those promises, called the PBO, for projected benefit obligation, in the accounts. The funded ratio, or funded status, is the plan's assets divided by those liabilities. Above 100 percent, the plan holds more than it owes, and the difference is its surplus.
The discount rate sets the size of the liabilities. Under US accounting rules (ASC 715, and IAS 19 in most other countries), the promises are discounted at the yield of high quality corporate bonds, in practice AA rated, on the measurement date. When that yield rises, the present value of the promises falls and the funded ratio improves. Milliman's discount rate was 6.47 percent on September 30.
One confusion is worth clearing up, because it is everywhere. You will read that the pension discount rate is set by the IRS segment rates. Those are corporate bond yields published by the IRS. For minimum funding contributions they are 24 month averages kept inside a corridor, and they move slowly by design. The premiums plans pay to the PBGC, the federal pension insurer, use the monthly rates instead. They are not what goes into the funded ratio a company reports, and they are not what an investment committee follows on its glide path.
The hedge ratio is the share of the liabilities' sensitivity to rates that the assets match. A plan hedged at 100 percent sees its assets and its liabilities move by the same dollar amount when rates move. The tools are long Treasuries, STRIPS (Treasury bonds cut into zero coupon pieces, the longest duration on offer), long corporate bonds and interest rate swaps. Treasuries alone are not enough, because the discount rate is a corporate yield: on September 30 the 30 year Treasury yielded 5.64 percent, 83 basis points less than the 6.47 percent discount rate. So LDI mixes Treasuries and STRIPS for the rate part of the discount rate with long corporate credit for the spread part.
The glide path is the plan's road map. It sets steps of funded ratio, every few points between roughly 90 and 120 percent. At each step crossed on the way up, the target for hedging assets rises and the target for return seeking assets, mostly equities, falls. One large US plan already held 78 percent in fixed income and 18 percent in equities by mid 2025, a plan near the end of the road. The end of the road is a pension risk transfer, or PRT: the plan pays an insurer to take over its promises, and the insurer invests the premium, mostly in investment grade corporate credit.
September 30 pulled the trigger
The Milliman 100 Pension Funding Index tracks the 100 largest US corporate defined benefit plans. On September 30 it stood at 114.5 percent, up from 112.2 percent at the end of August and 105.0 percent a year earlier. The surplus was 160 billion dollars, on 1,263 billion dollars of assets against 1,103 billion of liabilities. That is the best level since June 2001, when the index stood at 117.2 percent, and it is above the October 2007 peak of 108.1 percent.
How September got there matters. Plan investments returned minus 2.21 percent in the month, and assets fell by about 35 billion dollars, benefit payments included. But the discount rate rose 47 basis points to 6.47 percent, its highest since May 2009, and liabilities fell by 54 billion dollars. Net, funding improved by 19 billion dollars. Other trackers tell the same story at the same date: Wilshire 113.6 percent, Marsh for S&P 1500 sponsors 113 percent, LGIMA 112.3 percent, Aon for S&P 500 sponsors 109.8 percent and MetLife 109.7 percent.
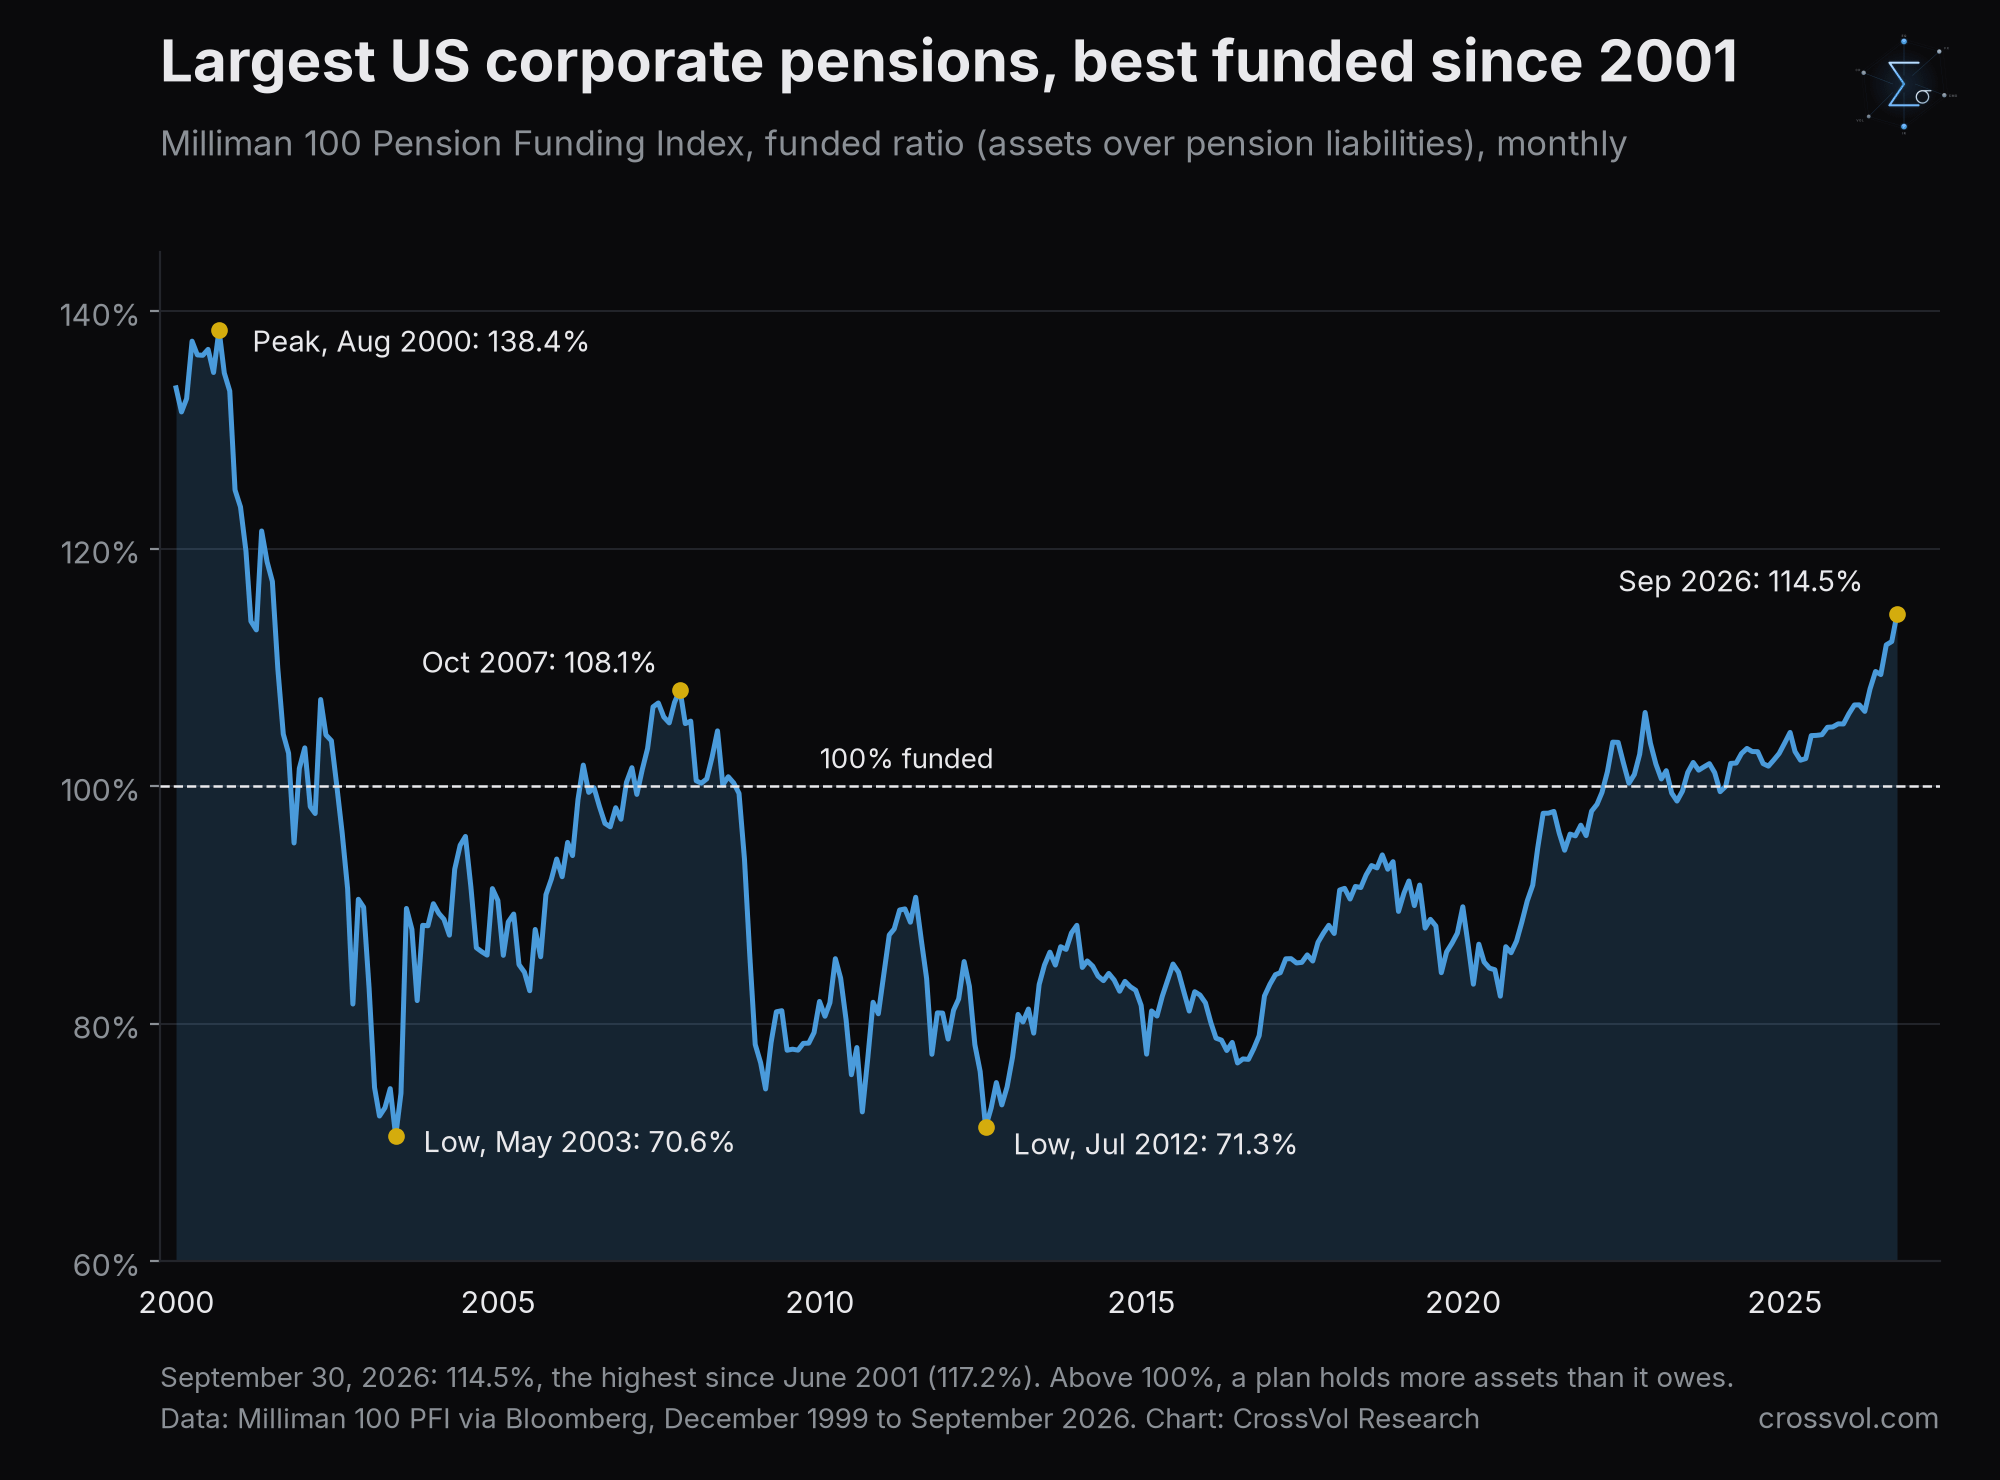
This is the accounting link I pointed to in September. Plans check their funded ratio against their glide path on a schedule, monthly or quarterly for many, and quarter end is the measurement most committees look at. Many large plans also have their LDI manager watch the triggers daily, so part of the move happened in September itself. The index gained 2.3 points in September and 9.5 points in a year, and individual plans sit on both sides of the average, so the September 30 number put many plans across new steps. The orders that follow a step crossed at quarter end are executed in the weeks after it, which means October: sell equities, buy long Treasuries, STRIPS and long credit. That is consistent with an October 14 on which the long end was bought while stocks stayed sold.
Since the measurement, long yields have fallen. The 30 year went from 5.64 percent on September 30 to 5.52 percent on October 14 on the Treasury's curve. Bloomberg's US pension liability index, I02786, stood at 3,923 when I wrote in September. It fell in the last days of September, as yields rose into quarter end, and has gained 1.16 percent since, to 3,906 on October 14, because the value of the liabilities rises when yields fall. Its yield, 6.38 percent, sits close to Milliman's discount rate. So funded ratios have probably slipped a little in October. In a ratchet, that does not undo the step.
A ratchet, not a rebalance
This is the heart of my view, and it is where most commentary goes wrong. Two different mechanisms are both called pension rebalancing, and they push in opposite directions.
The first is rebalancing to fixed weights. A plan that holds, say, 60 percent equities and 40 percent bonds buys equities after a fall to get back to 60 percent. It is contrarian by construction. This is the quarter end pension rebalancing that strategists estimate every quarter, and it supports stocks after a drop.
The second is the funded ratio glide path. Each step crossed on the way up raises the hedging target and cuts the equity target. A later fall in equities lowers the funded ratio, but it does not lift the equity target back. Most glide paths are built as ratchets: they derisk, they do not re-risk.
At 114.5 percent, the second mechanism dominates for US corporate plans. Most of them are above the steps that matter, and their goal is no longer to beat a benchmark but to lock in the surplus and prepare a transfer to an insurer. The equity target was cut at the September 30 measurement, or at an earlier one, and a fall in stocks does not restore it. That is why, at 114.5 percent funded, the LDI trigger only works one way: sell equities, buy the long end, and keep reducing equity exposure.
Some plans still sit below their steps, and some run on fixed weights, as many public pensions do. They will buy stocks after a fall, and the net flow depends on the mix. For the largest corporate plans, the ones Milliman tracks, the direction is set.
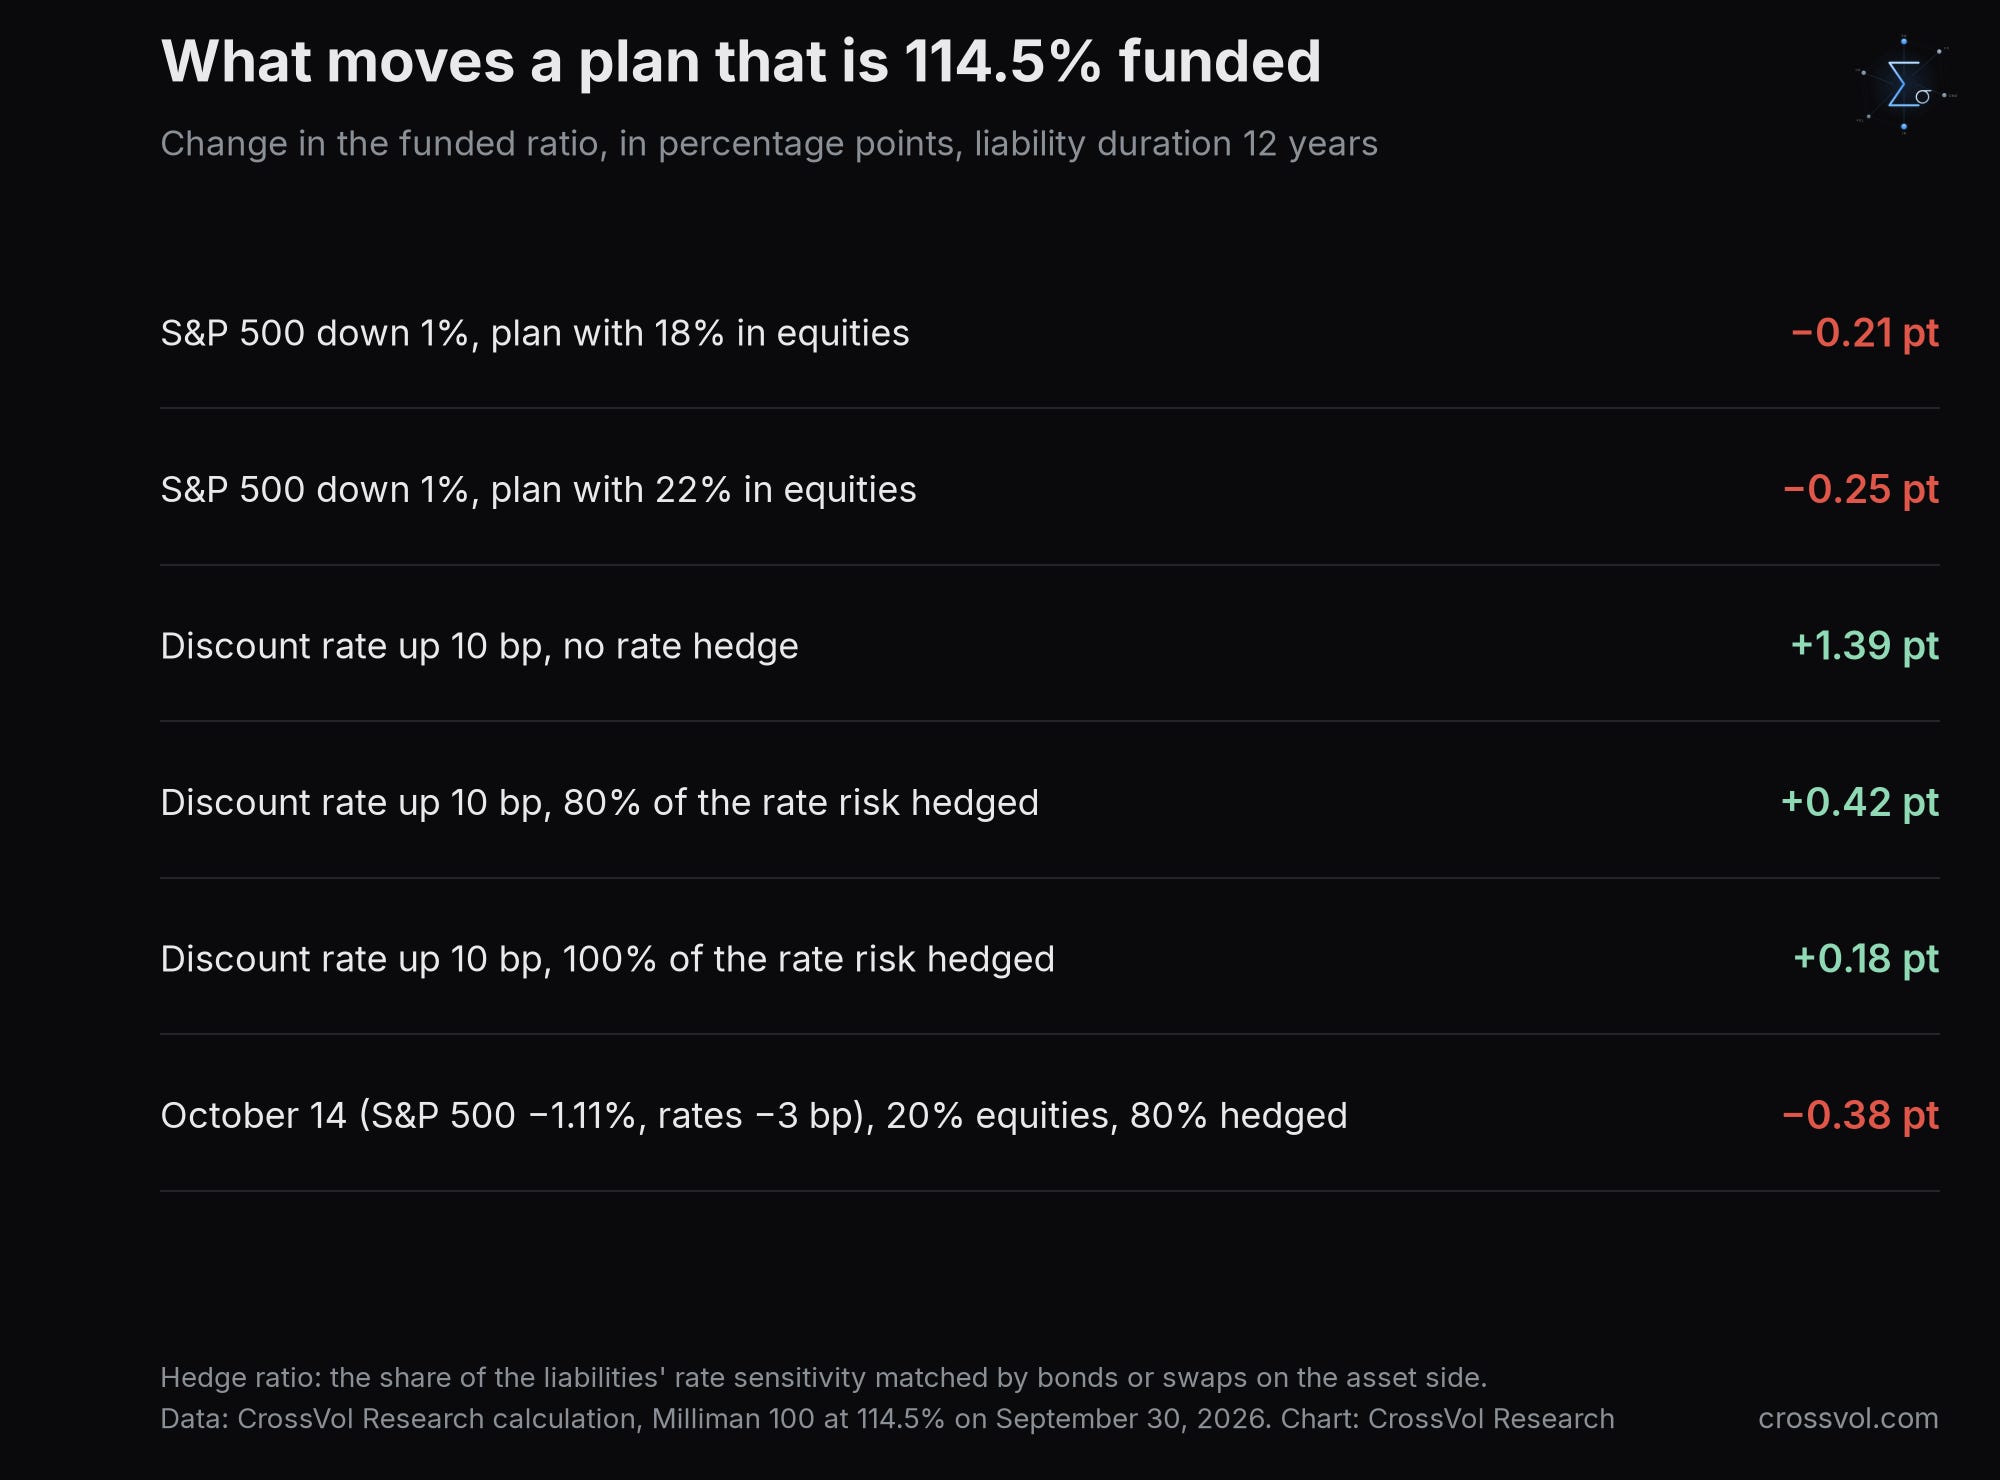
Numbers help. Duration measures how much a value moves when rates move: liabilities with a duration of 12 years gain or lose about 1.2 percent for each 10 basis points. Take a plan at 114.5 percent. With 20 percent of its assets in equities, a 1 percent fall in the S&P 500 costs it about 0.23 point of funded ratio, 0.21 with 18 percent in equities and 0.25 with 22 percent. A 10 basis point rise in the discount rate adds 1.39 points to a plan with no rate hedge and 0.42 point to a plan hedged at 80 percent. It still adds 0.18 point at 100 percent, because a plan in surplus gains in ratio when its assets and liabilities fall by the same dollar amount.
October 14 itself lowered funded ratios. For the same plan, 80 percent hedged, the S&P 500 down 1.11 percent and rates down about 3 basis points cost about 0.38 point. So the trigger was not the day. It was the September 30 measurement. A 1 percent fall in equities does not force a pension to sell. It trims its ratio by about a fifth of a point. What sells is the target that was already cut. And for a plan that hedges most of its rate risk, equities are now the main risk left in the portfolio, which is the strongest reason to keep cutting them.
How large is the stock? Private US defined benefit plans held about 3.47 trillion dollars of assets at the end of June 2026, against 3.12 trillion dollars of promises, according to the Federal Reserve, a funded ratio of about 111 percent across all of them. If 18 to 22 percent of those assets is still in equities, close to the large plan above, that is about 0.62 to 0.76 trillion dollars of equities. That is a stock still held, not a sell order. But in a ratchet it can only go one way.
The night of October 15, and the AI loop
Overnight, the selling moved to Asia and to the AI trade. Korea's Kospi fell about 9 percent and triggered a trading halt, with Samsung Electronics and SK Hynix down as much as 11 percent. Japan's Nikkei and Taiwan's Taiex lost more than 4 percent each, and the MSCI Asia Pacific index fell 3.2 percent, according to Bloomberg. On Wednesday, CoreWeave and the other neoclouds, the companies that rent out AI computing capacity, had already fallen, and the Nasdaq 100 had lost about 2 percent. At 3:00 am New York time, the S&P 500 future was down 0.4 percent from Wednesday's close and the Nasdaq 100 future 1.2 percent.
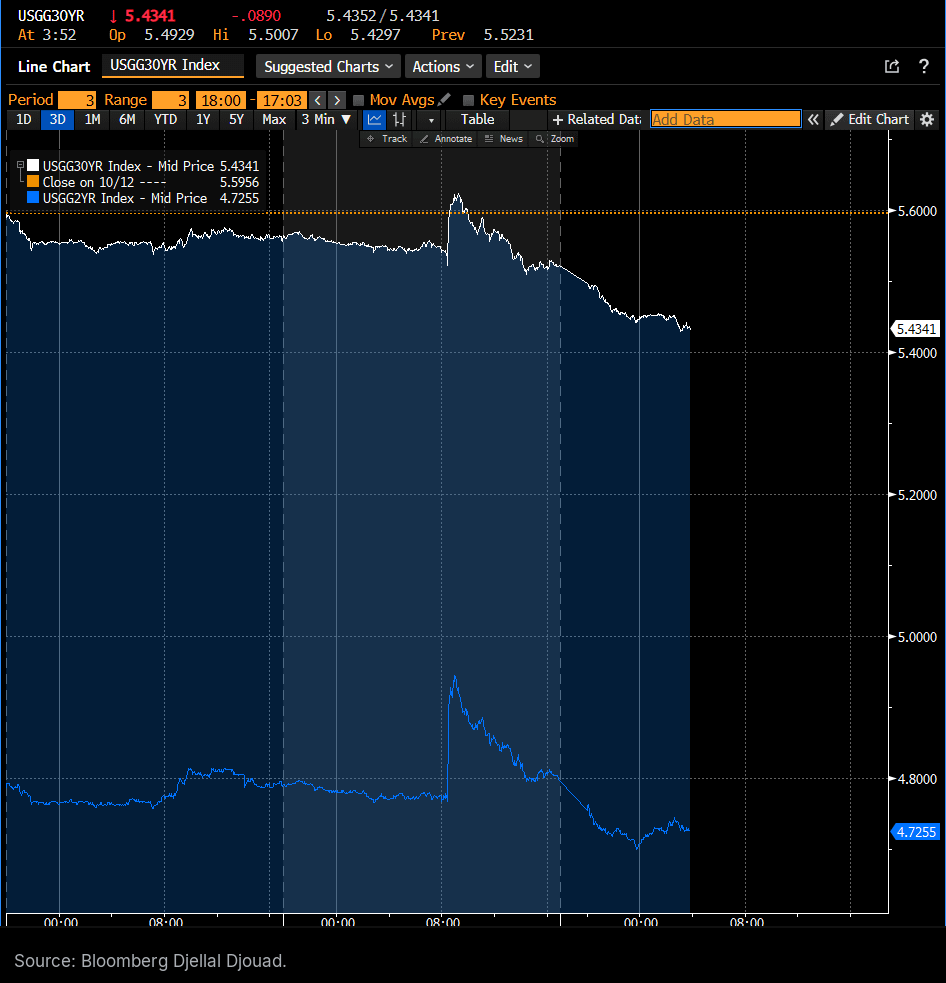
Treasuries rallied, almost in parallel. Around 3:50 am, on Bloomberg, the 2 year yield was at 4.73 percent, 7 basis points below its Wednesday close of 4.80 percent, and the 30 year at 5.43 percent, 9 basis points below its close of 5.52 percent. Treasury futures prices rose across the curve, by 0.15 percent for the 2 year note and 1.4 percent for the ultra bond. The 2s30s curve swung between 69.4 and 75.6 basis points, the high in the thin hour after the evening reopening, and was at 70.7 at 3:54 am, little changed from its close of 71.9. A bull steepener, in which yields fall and short yields fall more, or a bull flattener, in which long yields fall more, would each tell a story. The curve told neither. It moved down nearly in one piece.
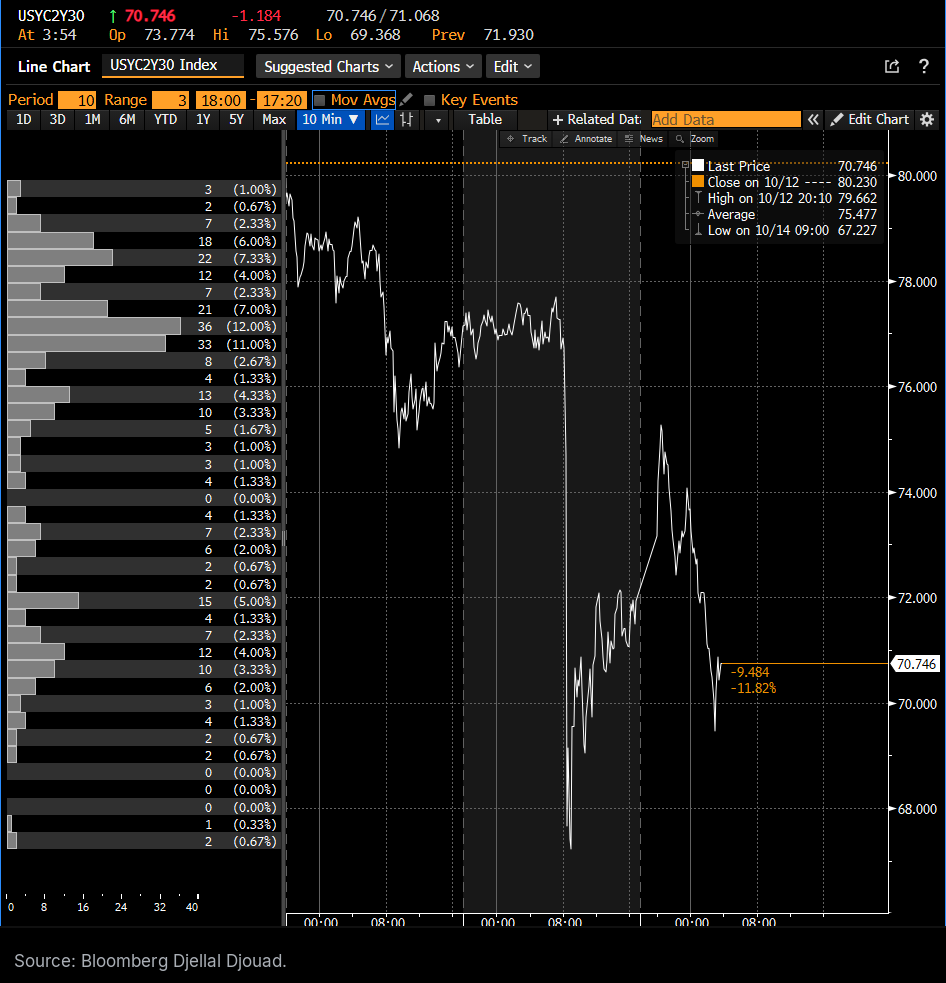
Two things follow. First, this is not the pensions' hour. US pension plans and their LDI managers trade mostly during US hours. The night belongs mostly to Asian and European banks, insurers, trend followers and macro hedgers, and nothing in its shape can be read as pension buying. The signature to look for was in US hours on October 14, and it was there.
Second, the night matters for pensions in another way. Lower stocks and lower yields both lower the funded ratio. On a ratchet, a lower ratio does not bring pensions back to buy equities. So the AI unwind adds equity selling, and the pensions, the natural dip buyers of a world run on fixed weights, do not step in. They keep executing the cut decided on September 30. On a down day, pensions are not forced sellers. They are missing buyers, and sellers on schedule. The AI unwind and the pension rotation push equities the same way.
How much is left
Most of the rotation has been done. The Milliman ratio went from 105.0 to 114.5 percent in a year, demand for STRIPS has slowed, and Bloomberg reported in June that pension demand for corporate bonds may be fading as plans are overfunded. I have seen the cycle described as 80 to 85 percent complete. Nobody can measure that, and I will not use a number.
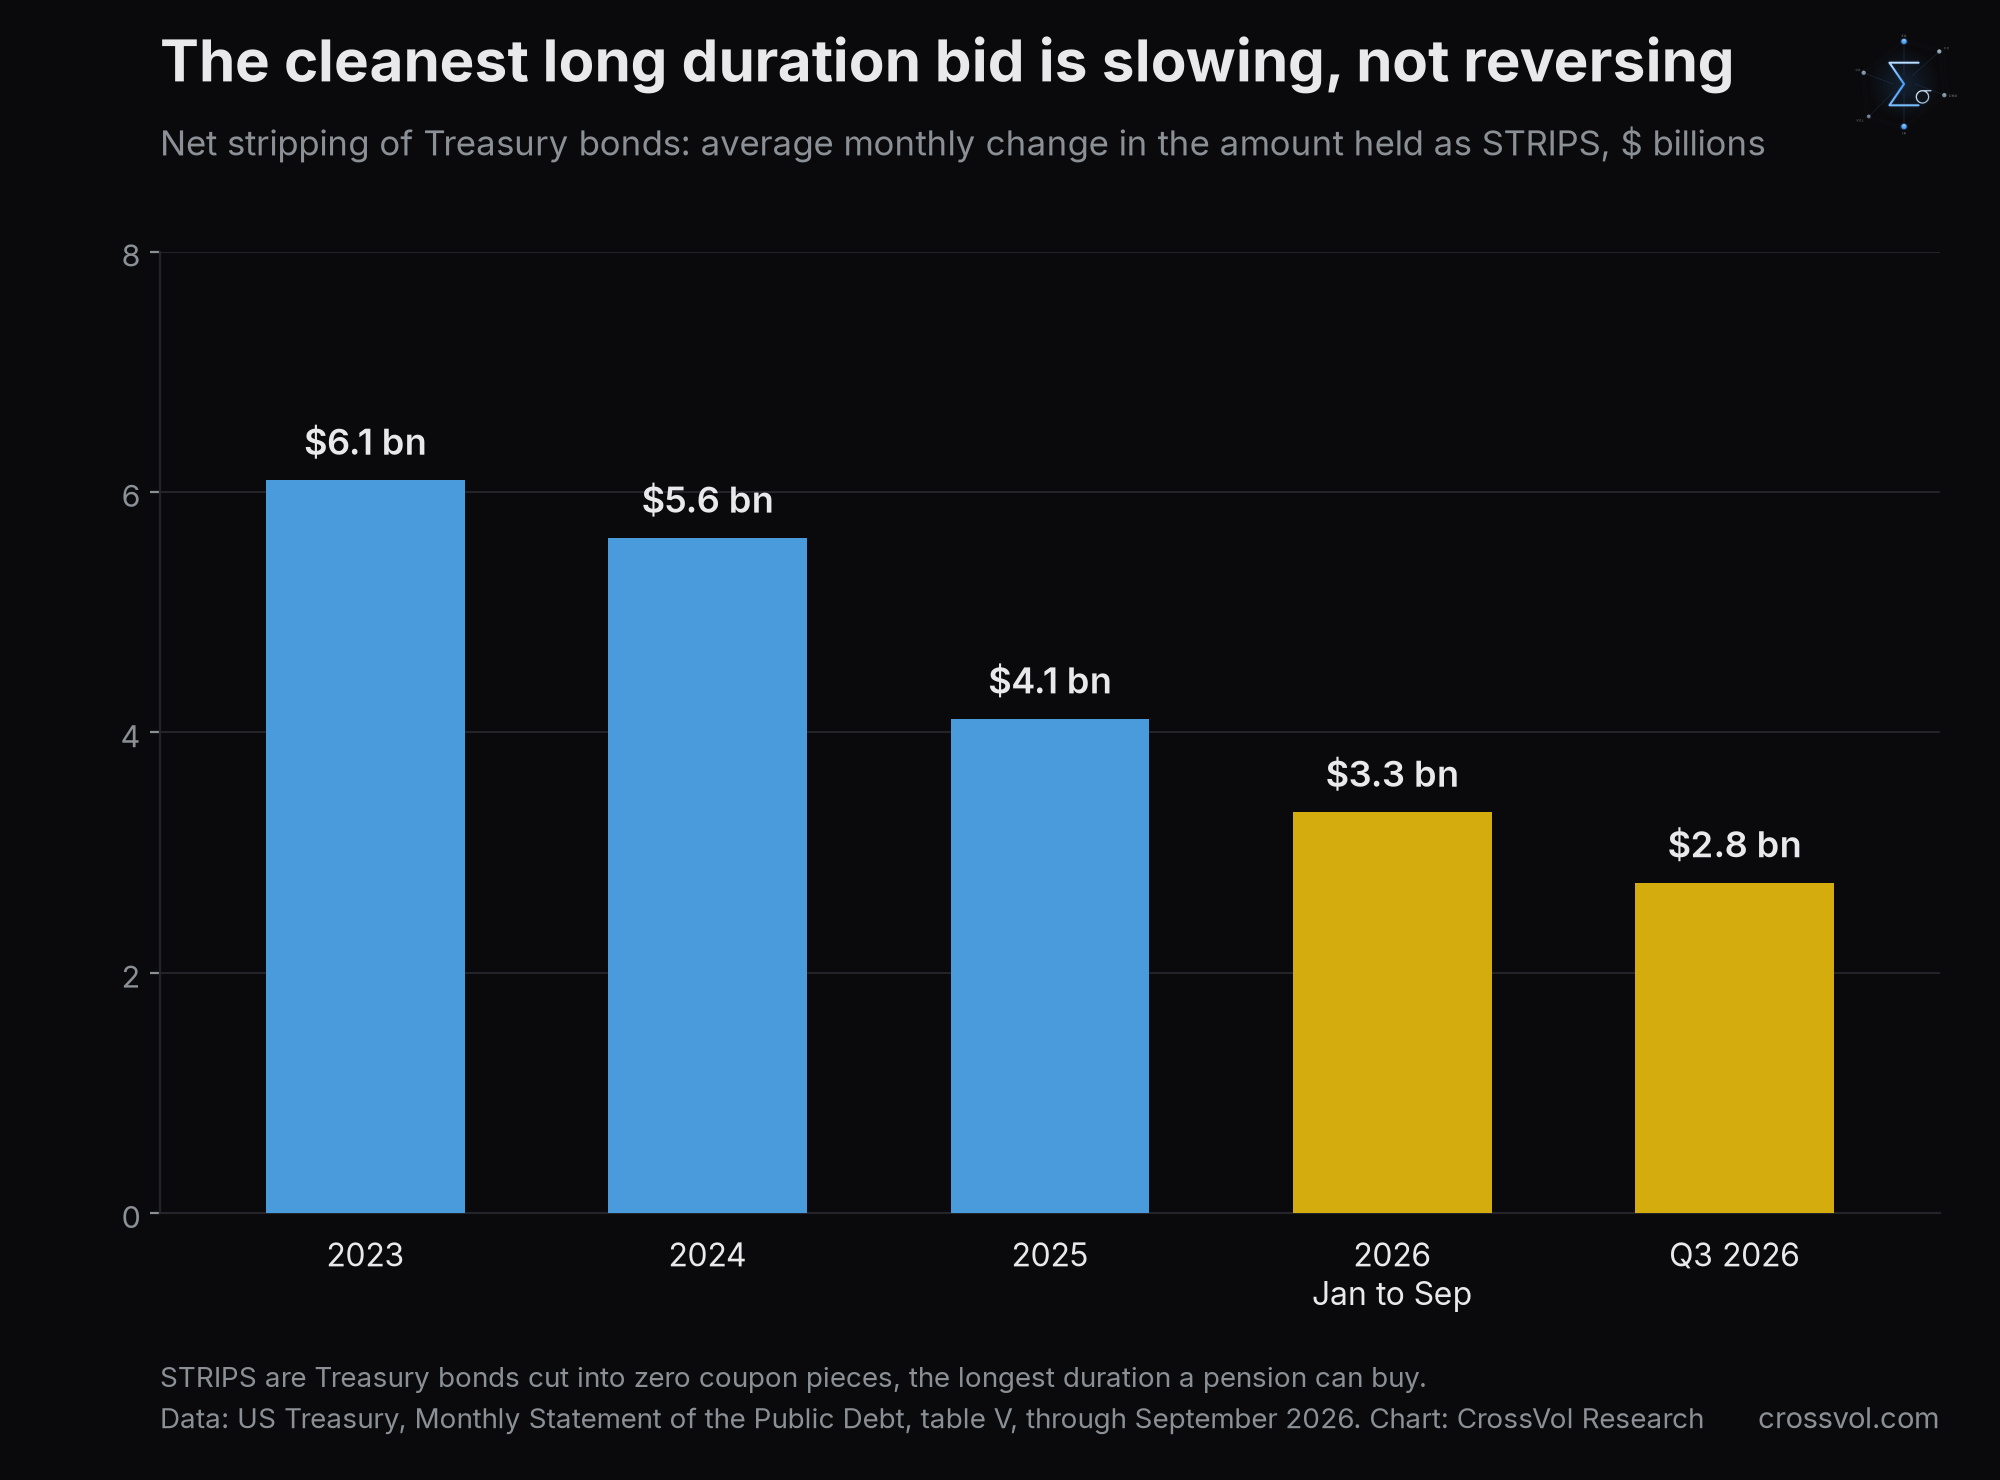
STRIPS are the cleanest gauge of pension demand for very long duration, because their main buyers are pension funds and insurers matching very long liabilities. Net stripping, the monthly change in the amount of Treasury bonds held as STRIPS, averaged 6.1 billion dollars a month in 2023 and 5.6 billion in 2024, then 4.1 billion in 2025 and 3.3 billion from January to September 2026, with 2.8 billion a month in the third quarter and 2.1 billion in September. The flow is slowing. It has not reversed, even if single months have dipped below zero, as in February and June 2025 and in April 2026. October's number will be published in early November.
What remains is the end of the glide paths for plans still short of their targets, buying on yield spikes by plans already there, and pension risk transfers. Transfers reached 48 billion dollars in 2025, according to LIMRA, the fourth year above 45 billion. The first quarter of 2026 was slow at 3.8 billion, down 47 percent on a year earlier as deals were pulled into the fourth quarter of 2025, and Bloomberg Intelligence expects 40 to 50 billion dollars for the year. At 114.5 percent, many more plans can afford a transfer, and each one hands liabilities to an insurer that buys corporate credit with the premium. Pensions and insurers already hold about 6.4 trillion dollars of US dollar investment grade credit, roughly 40 percent of the market, according to a Goldman Sachs estimate reported by Bloomberg Intelligence.
The rest is smaller than in 2023 and 2024. But it goes one way. And the plans that gained most this year have the most left to do. October Three's model plan with a traditional 60/40 mix gained 13 points of funded ratio this year to September 30, against 3 points for its model plan with 80 percent in bonds. The less a plan was hedged, the more it gained from higher rates and rising stocks, and the more derisking it now has to do.
Insurers and the rest of the world
Insurers do not run glide paths. They match their assets to their liabilities, mostly annuities and the pension promises they take over in transfers. As I wrote in September, their demand "lands in 5 to 15 year corporates, not in long Treasuries." Through transfers, part of the pension bid moves from long Treasuries to corporate credit.
Not every pension buys. In Chile, the private pension fund managers, the AFPs, are sitting on losses of about 7.7 billion dollars on swaps in which they received a fixed US rate, a bet that rates would fall, according to Bloomberg Línea, and a new rule is forcing them to cut those positions. Unwinding a bet on falling rates means selling duration. The word pension does not make every flow a bid.
And as I wrote in September, "The US is the only major market where the LDI derisking trigger is live and mechanically compelling right now." European insurers are already matched under Solvency II, the EU's insurance capital rules, the Dutch pension reform is a reallocation that can add volatility rather than a bid, and the Japanese bid is opportunistic and depends on the currency. I see nothing since that changes it.
What would prove me wrong, and what I watch
A tailwind is still not a backstop. The pension bid did not stop the 30 year from reaching 5.67 percent on October 7, its 52 week high, about 15 basis points above where it closed on October 14. At Wednesday's close, the 30 year was still 158 basis points above its three year low of 3.94 percent, set on September 16, 2024, on the Treasury's curve. Treasury supply is still a multiple of any pension flow, and after the CPI the market saw about 54 percent odds of a Fed hike on October 28. The pension bid decides which way the flows go when stocks fall. It does not cap yields.
Three things would prove me wrong. The first would be the long end failing to outperform during US hours on the next big down day for stocks, or selling off with the front end. That would make October 14 a one off. The second would be net stripping turning negative in the October data and staying negative in the months after, which would mean the cleanest long duration bid has reversed. One negative month proves nothing. April 2026 was one, and so were February and June 2025. The third would be large plans adding to equities after a fall, which would mean the ratchet is not a ratchet. A fall in funded ratios alone would not prove me wrong. A ratchet that stops climbing does not climb back down.
What I watch:
Milliman's October index and the other trackers, published in early November.
Net stripping for October, in the Treasury's monthly statement of early November.
The Fed on October 28.
The 30 year against its 5.67 percent high, and the 30 year swap spread against minus 62.75 basis points, its January high.
The long end during US hours on the days stocks fall.
If I am right, every equity rally is a chance for pensions to sell, every spike in long yields a chance for them to buy the long end, and every sell off in stocks will find them absent. The valve opens one way.
Key terms, in plain English
Basis point. One hundredth of a percentage point. 100 basis points make 1 percentage point.
Yield and price. The yield is the annual return a buyer earns by holding a bond to maturity at today's price. Price and yield move in opposite directions.
LDI, liability driven investing. Running a pension's assets so that they move like its promises to retirees, above all when rates move.
Funded ratio. Also called funded status. Plan assets divided by the present value of the pensions promised. Above 100 percent, the plan is in surplus.
Accounting discount rate. The yield of AA rated corporate bonds used under ASC 715 to value the promises in the accounts. When it rises, liabilities fall.
IRS segment rates. Corporate yields published by the IRS, as 24 month averages for minimum funding contributions and as monthly rates for PBGC premiums. Not the rate behind the reported funded ratio.
Glide path. The road map that cuts equities and adds hedging bonds each time the funded ratio crosses a preset step.
Hedge ratio. The share of the liabilities' sensitivity to rates matched by bonds or swaps on the asset side.
Duration. How much a value moves when rates move. A duration of 12 years means about 1.2 percent per 10 basis points.
STRIPS. Treasury bonds cut into separate zero coupon pieces, the longest duration a pension can buy in Treasuries.
PRT, pension risk transfer. A plan pays an insurer to take over its pension promises. The last step of derisking.
Swap spread. The swap rate minus the Treasury yield of the same maturity. Negative at 30 years for years.
SOFR. The Secured Overnight Financing Rate, the overnight rate published by the New York Fed that US dollar swaps now reference.
Bear and bull flatteners and steepeners. Bear means yields rise, bull means they fall. Flattener means the gap between long and short yields narrows, steepener that it widens. A twist is when short and long yields move in opposite directions, as they did on October 14.
Real money and fast money. Long term investors who buy to hold without leverage, such as pensions and insurers, against leveraged short horizon traders, such as hedge funds and CTAs.
CTA. A commodity trading advisor, in practice a fund that follows price trends with futures.
ZT, ZF, ZN, TN, ZB, UB and ES. CME futures on 2, 5 and 10 year Treasury notes, ultra 10 year notes, bonds and ultra bonds, and on the S&P 500.
This article is for educational purposes only. It is not investment advice, a solicitation, or an offer to buy or sell any security or derivative. Levels are as of the dates and times stated and can change quickly. Options, futures and bonds carry a high risk of loss. The funded ratio sensitivities are illustrations built on stated assumptions, not the position of any actual plan.
$SPY $TLT $LQD $CRWV
Data: Bloomberg, Milliman, US Treasury, CME, Federal Reserve, LIMRA.