


By Djellal Djouad. October 17, 2026.
Prices are settlements of Friday, October 16, 2026.
Risk warning. This article is for education only. This is not investment advice. Futures, options and spreads can lose more than the initial margin. Past prices say nothing certain about future prices.
Key takeaways
The November WTI contract rose 8.2% in five sessions, from $93.74 to $101.41 a barrel, and crossed $100 on Friday. December WTI rose 6.6%. December Brent rose 3.0%, to $109.86.
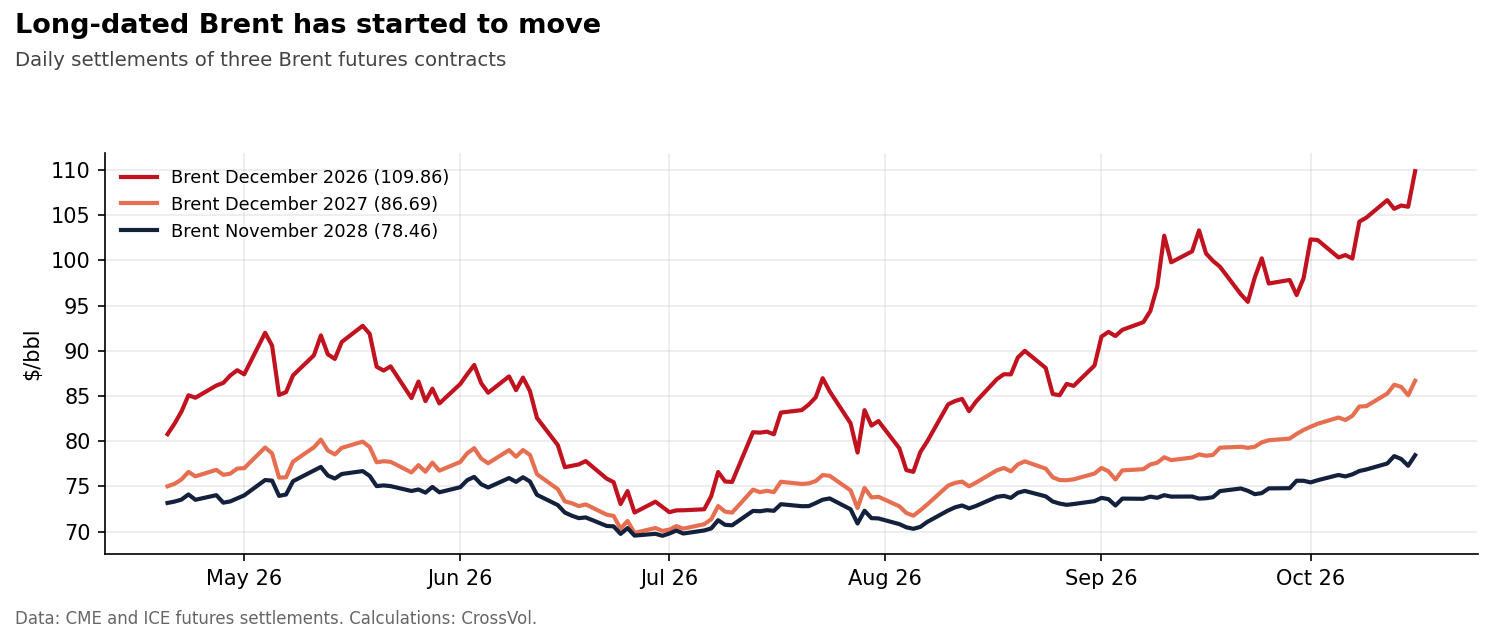
Long-dated oil has started to move. Brent for November 2028 rose 6.5% in a month, to $78.46, its highest level since April.
The geopolitical risk premium is largest in the front of the curve. December 2026 Brent trades $23.17 above December 2027, three times the gap of three months ago. December 2026 WTI trades $18.48 above December 2027.
Diesel and gasoil (ICE gasoil, the European diesel benchmark) margins peaked in mid September and have eased since, while crude kept rising. Diesel remains the tightest product: December diesel costs $198 a barrel against $110 for Brent.
Gasoline is the weak link. The gasoline margin lost more than a fifth of its value this week.
European and Asian gas cost about $29 per million British thermal units, the US benchmark $3.12. The US curve shows its smallest end-of-winter spread since April.
Energy equities outperformed while the S&P 500 had its worst week since June.
1. The week in numbers
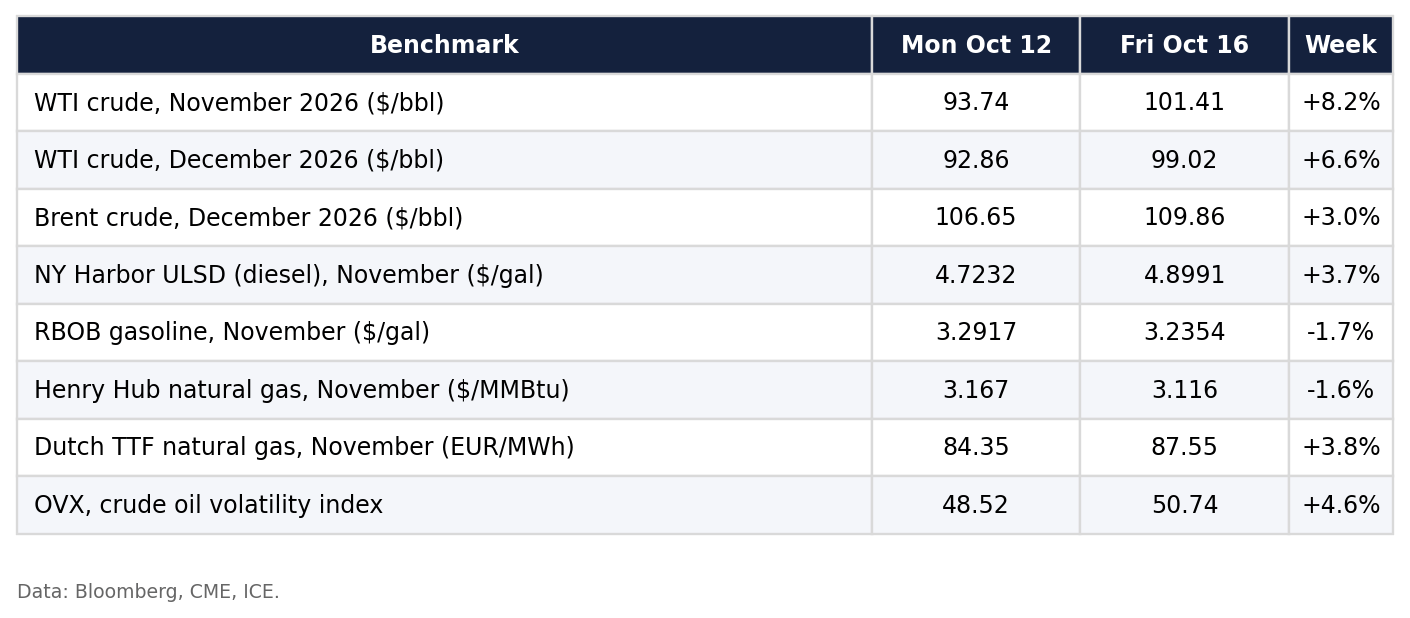
A futures contract fixes today the price of a quantity delivered in a given month. The front contract is the nearest month still trading. WTI is the US crude benchmark, delivered in Cushing, Oklahoma. Brent is the benchmark for crude shipped by sea. ULSD (ultra-low sulfur diesel) and RBOB (a gasoline blend) are the US refined product futures. Henry Hub, in Louisiana, is the US natural gas benchmark. TTF is the Dutch gas hub that sets prices for Europe. Gas prices are quoted per million British thermal units (MMBtu), a unit of energy, or per megawatt hour (MWh) in Europe.
The November WTI contract stops trading on Tuesday, October 20. A contract this close to expiry can move more than the rest of the curve, so this article also shows December. Exchange-traded funds that hold these futures follow the same markets: $USO for WTI, $BNO for Brent, $UGA for gasoline and $UNG for Henry Hub gas.
Supply risk in the Gulf dominated the news flow. A building at Saudi Aramco's headquarters in Dhahran was reported hit on October 14, according to people familiar with the matter, and the crude rally accelerated on Thursday and Friday. Further attacks were reported in Yemen on October 17, the Strait of Hormuz stayed a focus of supply risk, and fresh disruptions hit Russian refineries. OPEC trimmed its 2026 demand growth forecast on October 13, citing attacks on Gulf shipping. In the other direction, the International Energy Agency reported record UAE output of 5.3 million barrels a day in September, condensates (light liquids produced with gas) included. US crude and diesel inventories fell again in the latest government data.
2. Brent and WTI futures curves: a shock priced for one year
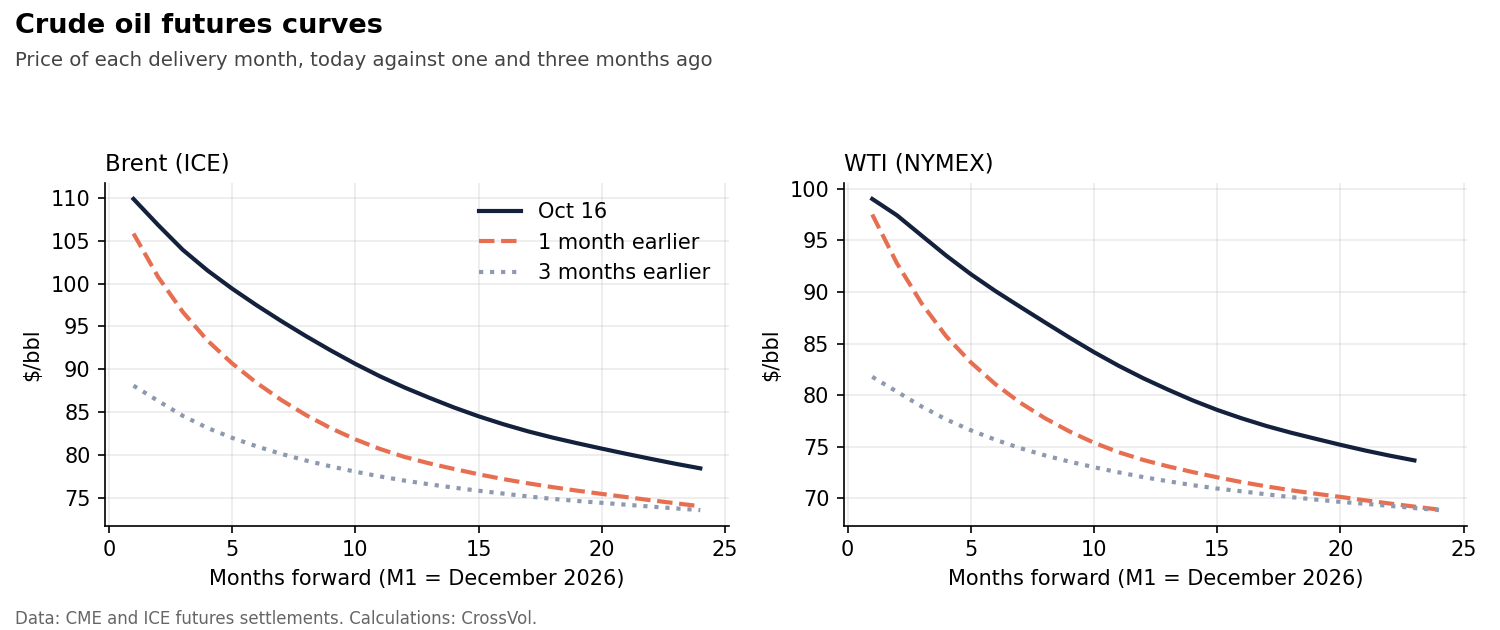
A futures curve lines up the price of every delivery month. When near months cost more than later months, the curve is in backwardation: buyers pay a premium to receive oil now rather than later. Backwardation is the usual signature of a market short of physical barrels. The opposite shape, contango, appears when supply is ample and storage pays.
Both crude curves are in steep backwardation along their whole length:
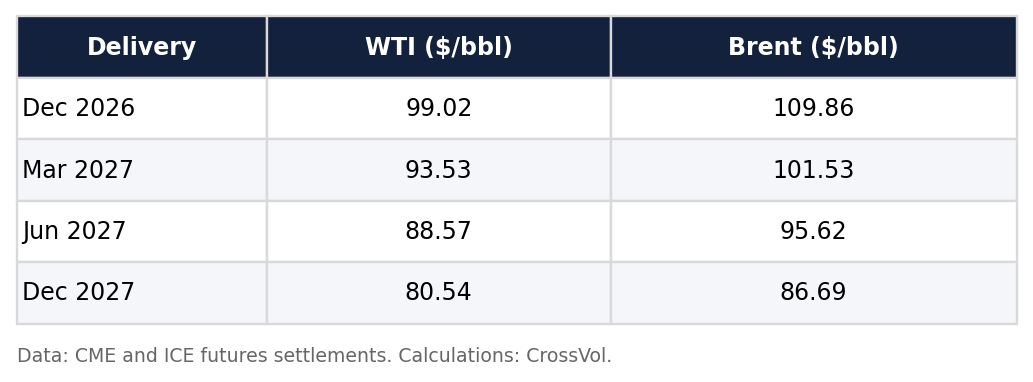
A strip is the average price of a run of delivery months, here the twelve months of a calendar year. Brent's 2027 strip averages $95.4. For 2028, the contracts quoted so far (January to November) average $81.6. Two years out, Brent futures trade between $78 and $82. That anchor is itself moving. From April to mid September, the November 2028 Brent contract traded between $69.55 and $77.16 while the front month swung between $72 and $103. In the past month it rose 6.5%, to $78.46, its highest level since April. December 2027 gained 10.6% over the same month, slightly more than December 2026 (+9.0%). When the back of the curve rises with the front, the market is repricing the long-run cost of oil as well as the next deliveries.
The slope has moved fast. Three months ago, the Brent front month traded 15% above the contract twelve months later. One month ago the gap was 34%. Today it is 27%.
3. Prompt spreads and calendar spreads: where the premium sits
Two spreads measure the backwardation:
the prompt spread compares the front month with the next one and measures the premium for barrels over the coming weeks;
the calendar spread compares two contracts further apart. December 2026 against December 2027 is the reference one-year spread for hedgers and macro funds.
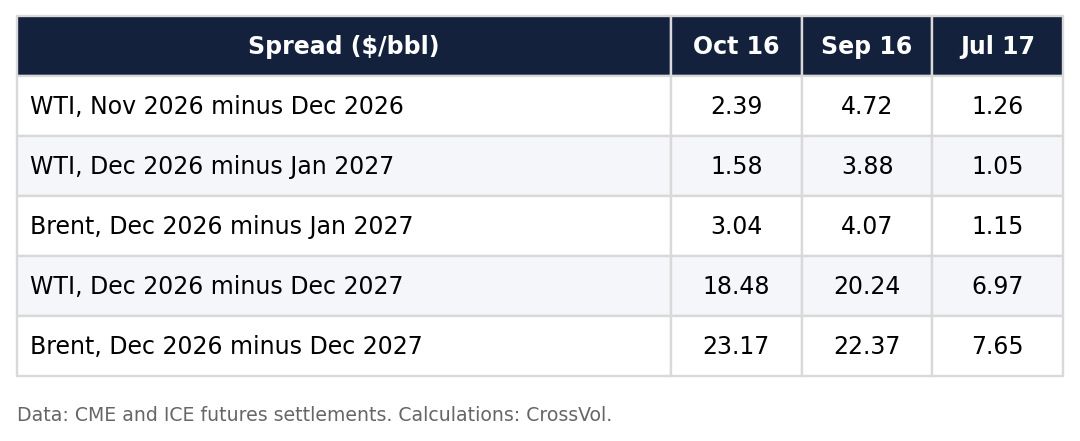
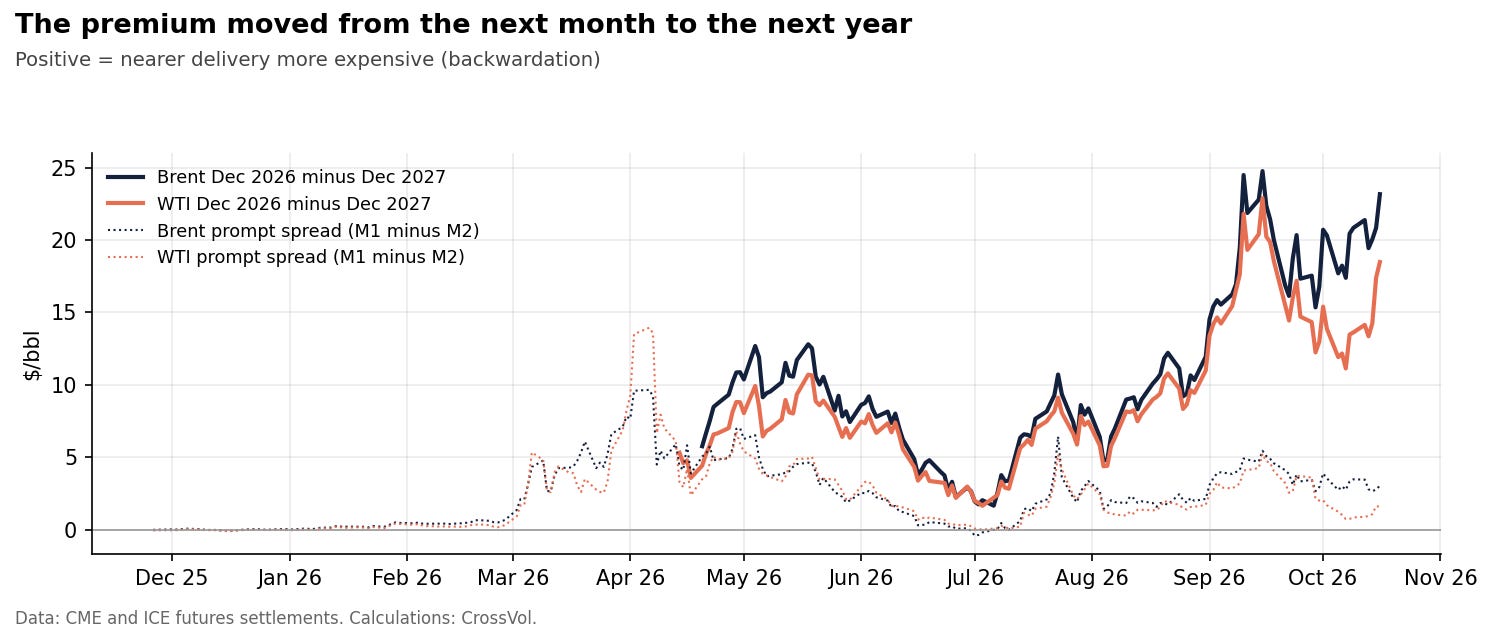
The expiring November WTI contract carried the sharpest prompt pressure: November traded $2.39 above December on Friday, against $0.88 on Monday. Buyers paid up for barrels deliverable at Cushing within weeks.
Further out, the picture is more nuanced. The December/January spreads are lower than in mid September. The one-year spreads, on the other hand, stay close to (Brent) or below (WTI) their September peaks:
the WTI December/December spread widened from $14.14 on Monday to $18.48 on Friday, after a peak of $22.89 on September 15;
the Brent December/December spread reached $23.17, close to its September 15 peak of $24.76, and in the top 2% of daily readings since April.
The premium has spread across the next twelve months. The market pays a premium for oil delivered at any point over the next year. The curve prices a supply shock concentrated in the next twelve months.
Some traders had positioned for the backwardation to narrow. In early October, options on WTI calendar spreads traded with put structures: 2,000 lots (contracts) of December/January 1x2 put spreads, which buy one put and sell two at a lower strike, with strikes at $0.50 and zero, and 500 lots of puts at -$0.50 on a January to June/July strip. A put spread on a calendar spread gains if the spread falls. The December/January spread is roughly unchanged since then, at $1.58 against $1.61 on October 2. The June/July 2027 spread rose from $1.06 to $1.50, against the bet.
4. Crack spreads: refining margins after the September peak
A refinery buys crude and sells products. The crack spread is the product price minus the crude price, both in dollars per barrel (a gallon price is multiplied by 42). It is a direct reading of the gross refining margin. The 3:2:1 crack combines them the way a typical US refinery does: two barrels of gasoline and one of diesel against three barrels of crude.
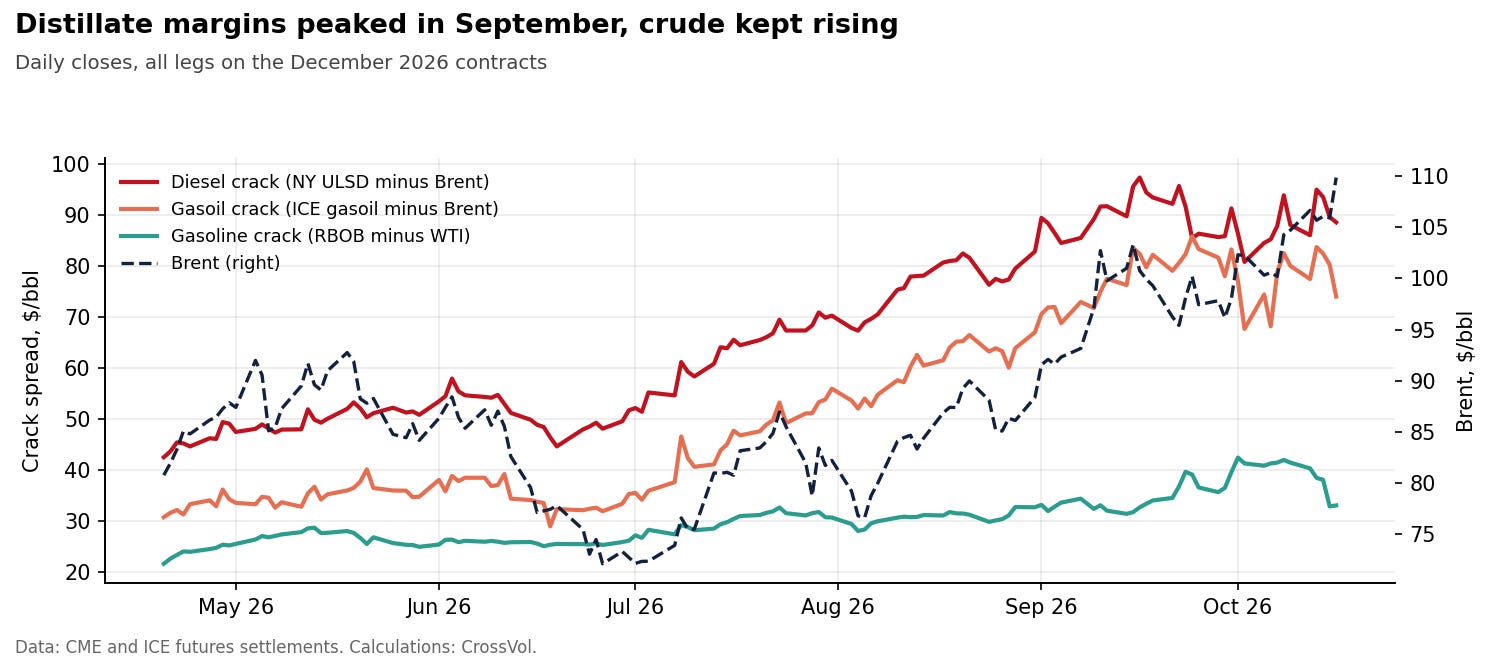
All legs on the December 2026 contracts ($/bbl):
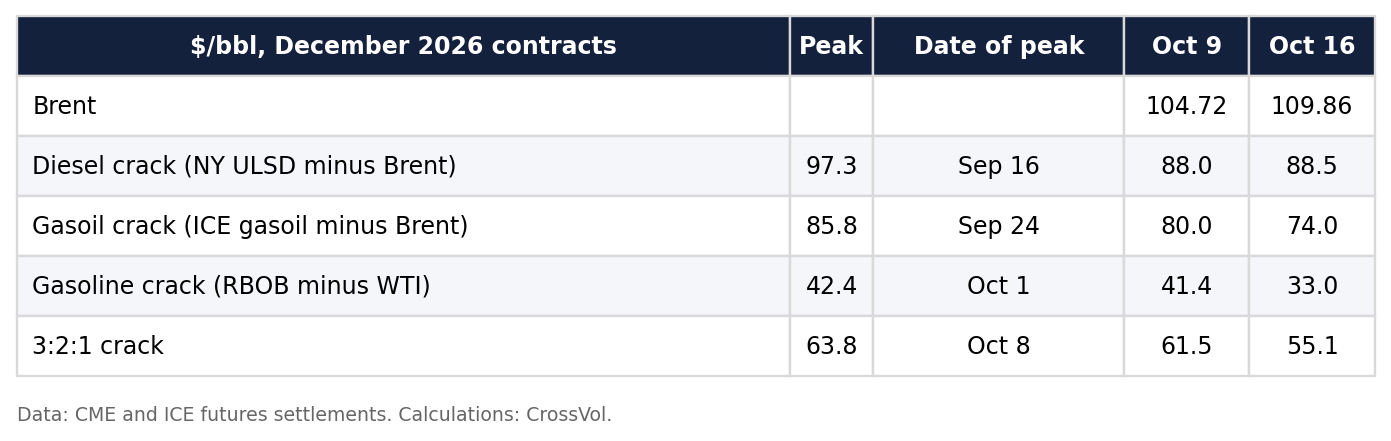
From July to mid September, products led the move. The December diesel crack rose from $52 to $97 while Brent went from $72 to $101. Since then the distillate margins (diesel and gasoil) have eased by about $9 to $12 while Brent gained another $9. Gasoline and the combined 3:2:1 margin held up until early October, then dropped this week.
The week itself split the products:
Gasoline. On the November contracts, the gasoline crack fell from $44.5 to $34.5, a loss of more than a fifth. The summer driving season is over, gasoline demand is seasonally weaker, and gasoline prices have not kept pace with crude. On December, the 3:2:1 margin fell $5.0 from Monday, and $6.4 from the previous Friday.
Diesel. Against Brent, the December diesel crack edged up, from $86.0 on Monday to $88.5 on Friday. Against WTI, the November diesel crack was flat near $104. US distillate stocks remain near historical lows, and diesel futures jumped on Tuesday before partly retracing.
Diesel stays the tightest product. December diesel costs $198 a barrel once converted from its gallon price (November: $206), nearly twice the price of Brent. The third quarter was exceptional for refiners: ExxonMobil said higher refining margins added about $4.5 billion to its third-quarter results, after $4.1 billion in the second quarter, and TotalEnergies flagged strong downstream results.
5. The forward crack curve: a slow normalization of diesel
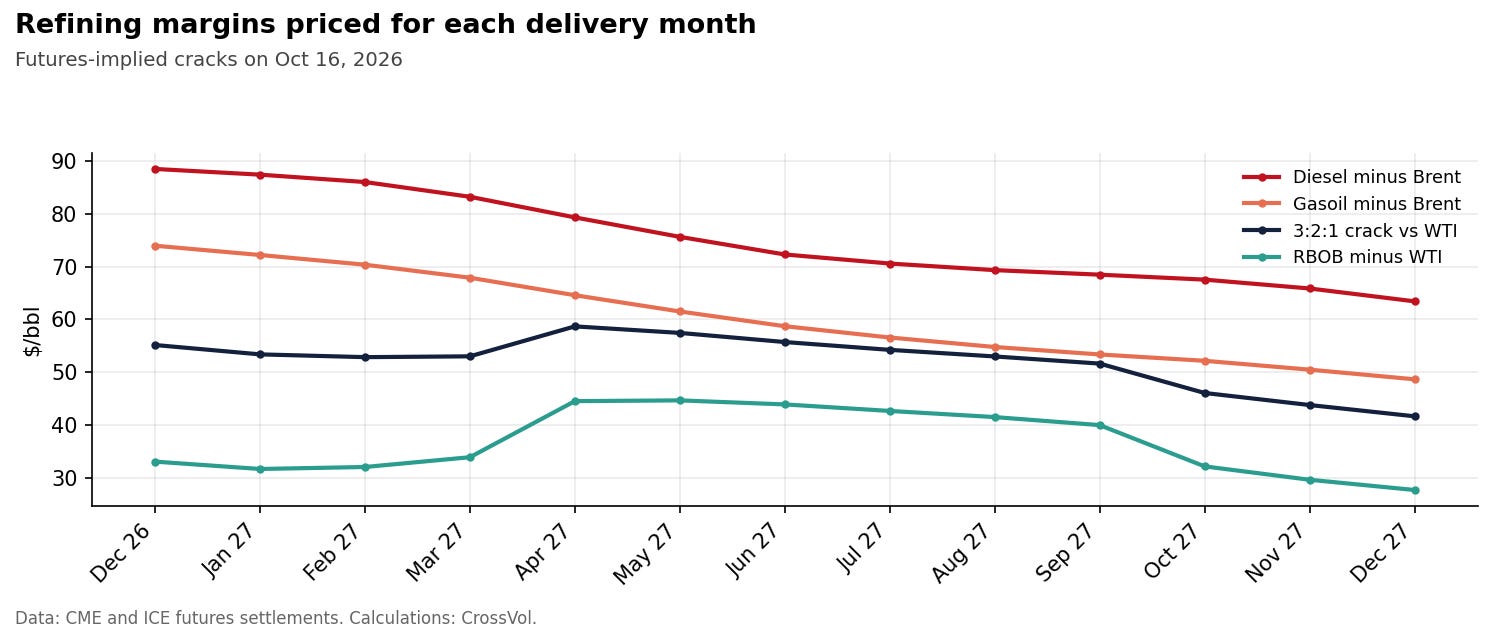
Futures also price refining margins for each delivery month. The diesel crack against Brent is priced at $83 for March 2027, $72 for June 2027 and $63 for December 2027. Gasoil follows the same path, from $74 for December 2026 to $49 a year later. Both stay above the levels of last June, when the December diesel crack traded between $45 and $58.
The gasoline crack shows its usual seasonal hump: about $33 through the winter, $40 to $45 for the April to September 2027 contracts, when summer-grade gasoline is more expensive to make and demand is higher, then $28 for December 2027.
The market therefore prices a gradual decline in diesel margins over more than a year, with no return to the spring levels before 2028.
6. Brent against WTI: the seaborne premium
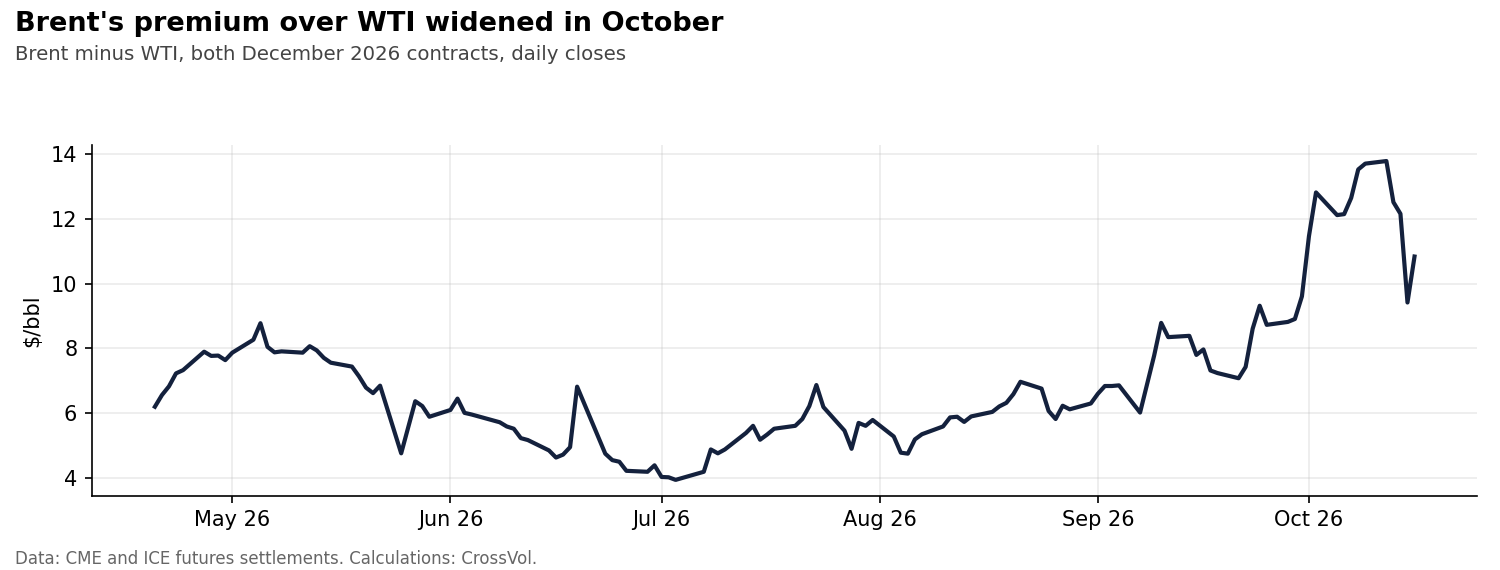
Compared on the same December delivery, Brent traded about $4 to $7 above WTI through the summer. The gap widened to $12 to $14 in early October, as attention turned to risks to seaborne crude in the Gulf, and stood at $13.79 on Monday. It closed the week at $10.84. WTI caught up part of the gap, helped by US crude and diesel inventory draws, with strength spilling over from the expiring November contract.
7. Implied volatility: the OVX above 50
Implied volatility is the size of future price moves that option prices assume, expressed as an annual percentage. The OVX, published by Cboe, measures the 30-day implied volatility of crude oil. It rose in every session except Wednesday, from 48.52 to 50.74, with the largest jump on Friday as WTI broke $100. One-month implied volatility on WTI options reached 45.1% on Thursday, its highest from Monday to Thursday.
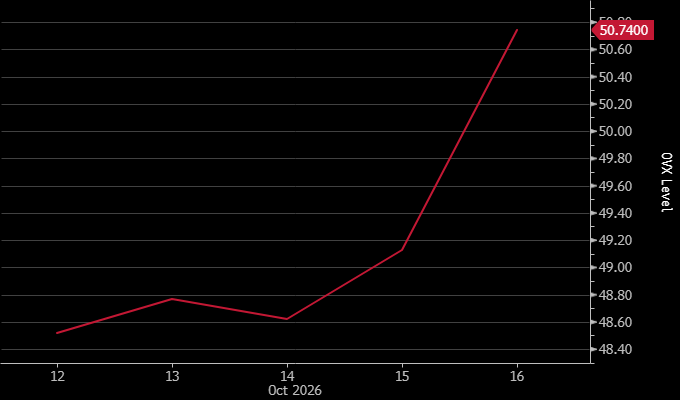
An OVX near 50 means option prices assume a typical daily move of about 3% over the next month (50% divided by the square root of 252 trading days). For comparison, the main equity volatility index usually sits between 12 and 20.
The volatility of the nearest option series appeared to fall on Thursday, from 40.1% to 35.4%. That day was the last trading day of the November WTI monthly options, so the reading moved from one option series to the next. It does not show a fall in volatility.
8. Listed options: where open interest sits
Open interest is the number of option contracts outstanding at each strike price. It shows where hedging flows can concentrate as prices move. A call gives the right to buy at the strike, a put the right to sell.
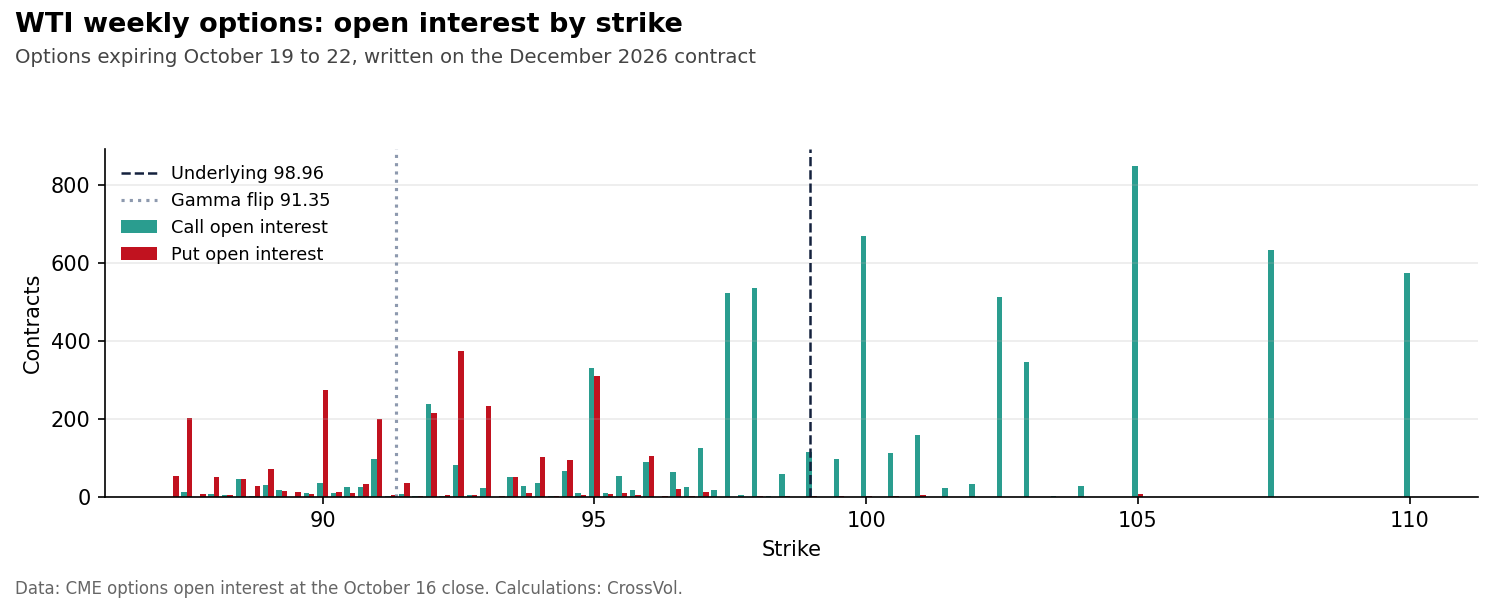
For the WTI weekly options expiring between October 19 and 22, all written on the December contract:
call open interest is largest at $105, $100, $107.5 and $110, then at $98, $97.5 and $102.5;
put open interest is largest at $92.5, $95 and $90;
puts amount to about a third of calls on the nearest expiries, a put/call ratio of 0.37: open interest leans toward calls.
Gamma measures how fast an option's sensitivity to the underlying price changes as that price moves. Option dealers hedge that sensitivity by trading futures. If dealers are long the calls and short the puts (the usual convention, and an assumption, because open interest does not show who holds what), their hedging dampens moves above a certain price and adds to them below it. The largest gamma sits at the $98 strike of the December contract. The gamma flip, the price below which dealer hedging would start to add to moves rather than absorb them, is near $91.35.
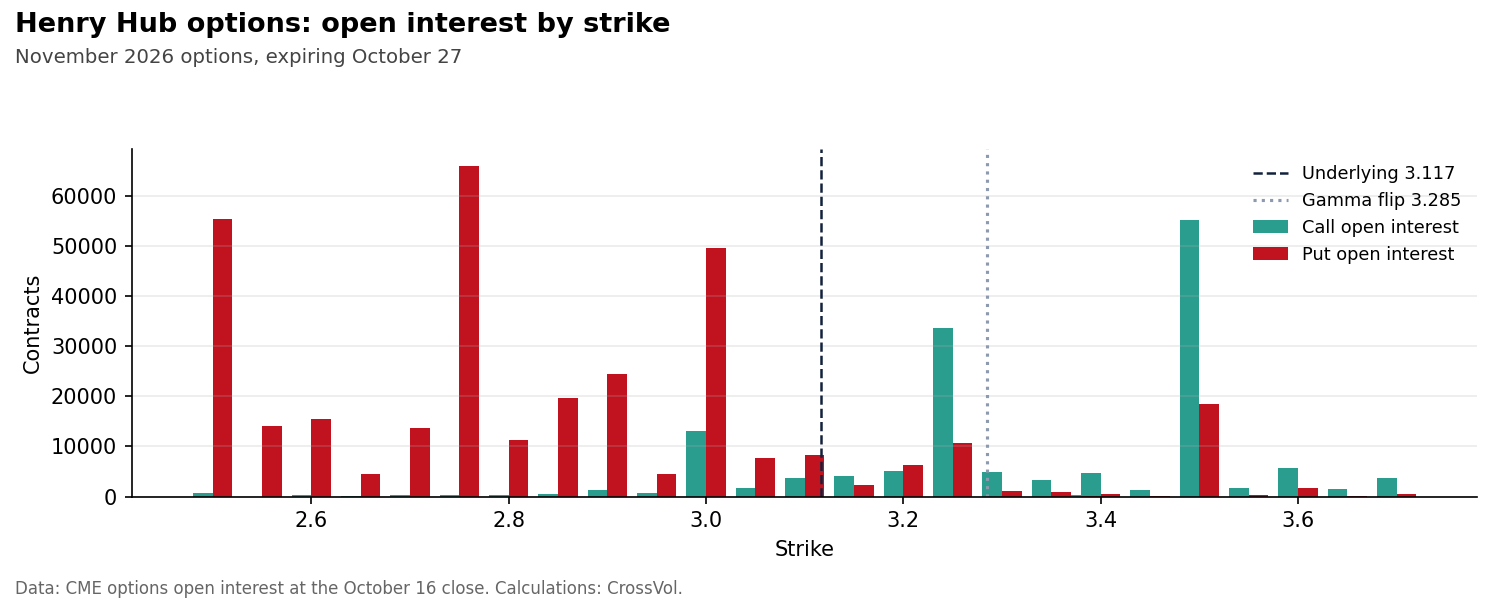
Henry Hub gas shows the opposite set-up. For the November options expiring October 27, put open interest is heaviest at $2.75, $2.50 and $3.00, and call open interest at $3.50 and $3.25. The November contract, at $3.116, trades below its estimated gamma flip of about $3.28. On the same convention, hedging there would tend to add to price moves.
On ICE, Brent options turned back toward calls earlier in October after weeks of mostly bearish flows, with 17,000 lots of March $124/$125 and 13,000 lots of February $115/$116 call spreads. A call spread buys one call and sells a higher one, a capped bet on a rise often used by producers and macro funds.
9. Over-the-counter options: large puts far below the market
Options also trade over the counter (OTC), directly between banks and their clients, outside the exchanges.
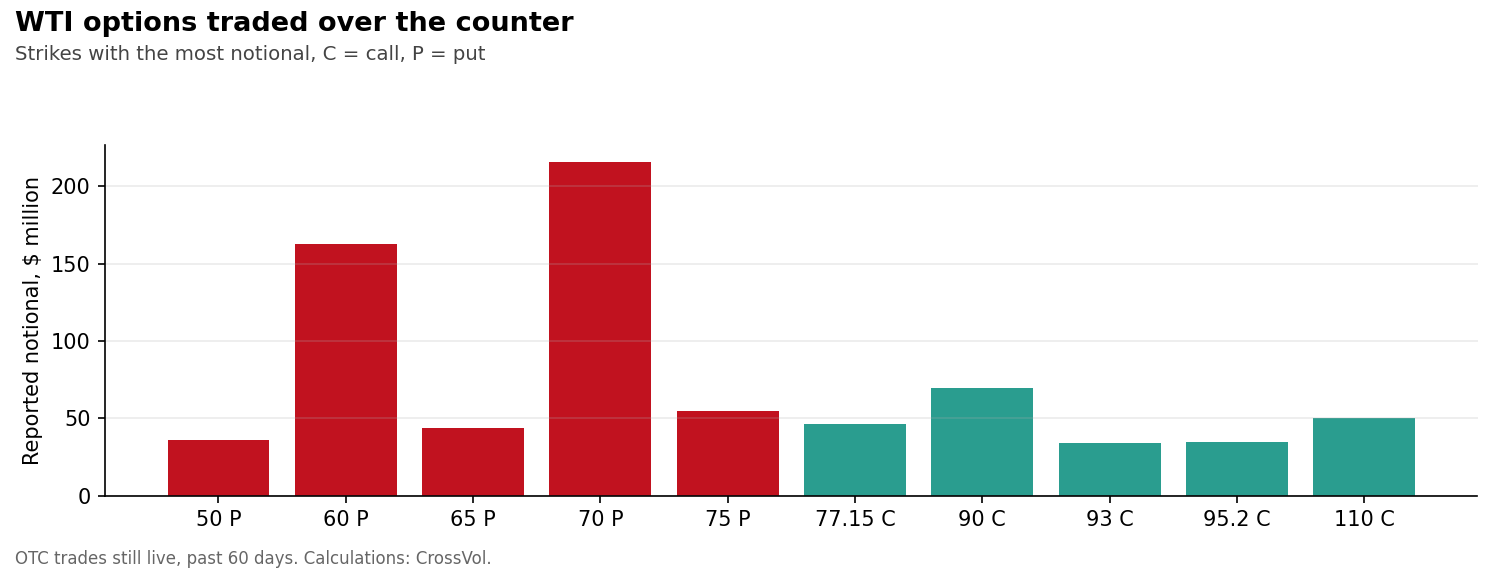
Over the past 60 days, the WTI strikes with the most notional (the face value of the barrels covered) among OTC trades still live are puts: $216 million across 44 trades at $70, and $163 million across 16 trades at $60. Large out-of-the-money puts, with strikes well below the current price, are consistent with producers hedging future output. Call notional is spread from $76 to $110, largest at $90. Brent, TTF and NBP (the UK gas hub) options trade mostly in Europe and are not covered here.
10. Positioning: managed money and CTAs
The CFTC, the US derivatives regulator, publishes each week the futures positions of broad trader groups. Managed money covers hedge funds and commodity trading advisers. Swap dealers are mostly banks hedging deals with clients. Producers, merchants, processors and users are the commercial firms that produce, trade or consume the commodity.
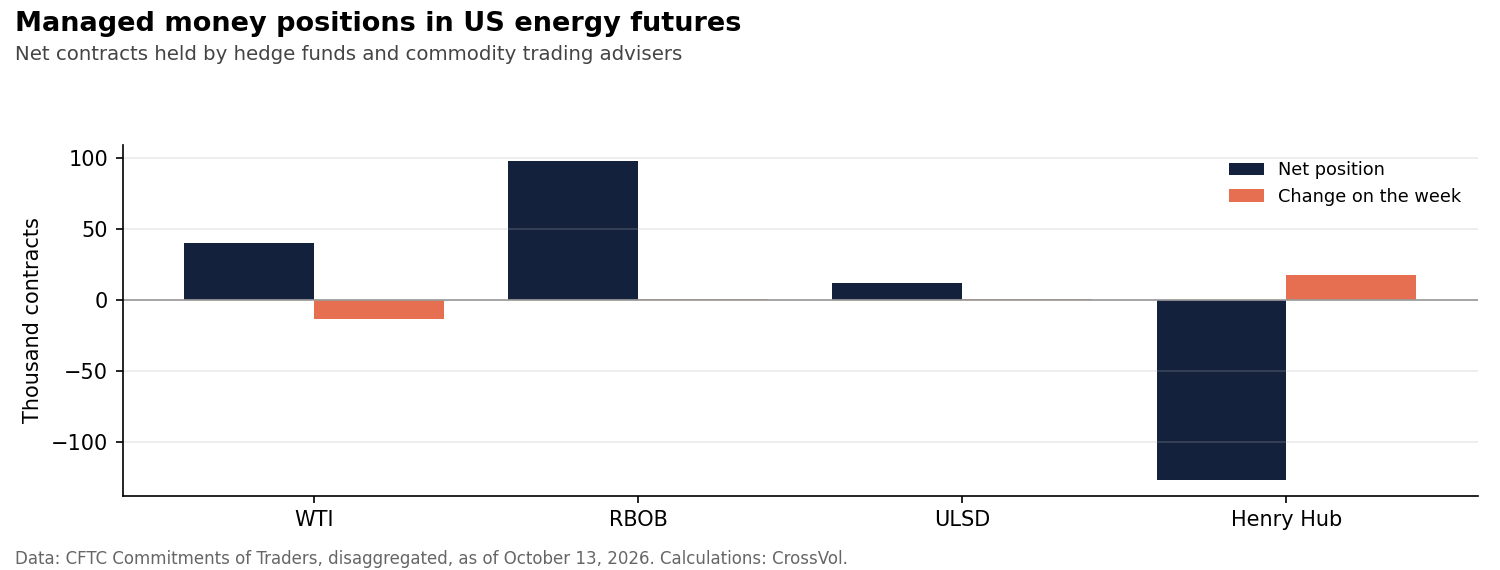

In WTI, managed money cut its net long by about 13,000 contracts in the week to October 13. Swap dealers held a net short of 478,478 contracts, and commercial producers and users a net long of 353,143.
A report on October 13 put trend-following funds (CTAs, which buy and sell on price trends) at maximum long in oil, with their nearest selling trigger far below the market. Both readings can be true at once: trend followers are one part of managed money, and other funds in that group were reducing exposure. The CFTC data stops on Tuesday, October 13, so it does not show who bought during the Thursday and Friday surge. With trend followers already at maximum long, a fresh shock finds few sellers in that group, and a reversal of trend signals would be a risk on the way down.
Gasoline stands apart: managed money is heavily long while the gasoline crack is falling. In Henry Hub, funds remain net short and covered about 18,000 contracts.
11. Natural gas: Europe and Asia pay for winter, the US much less
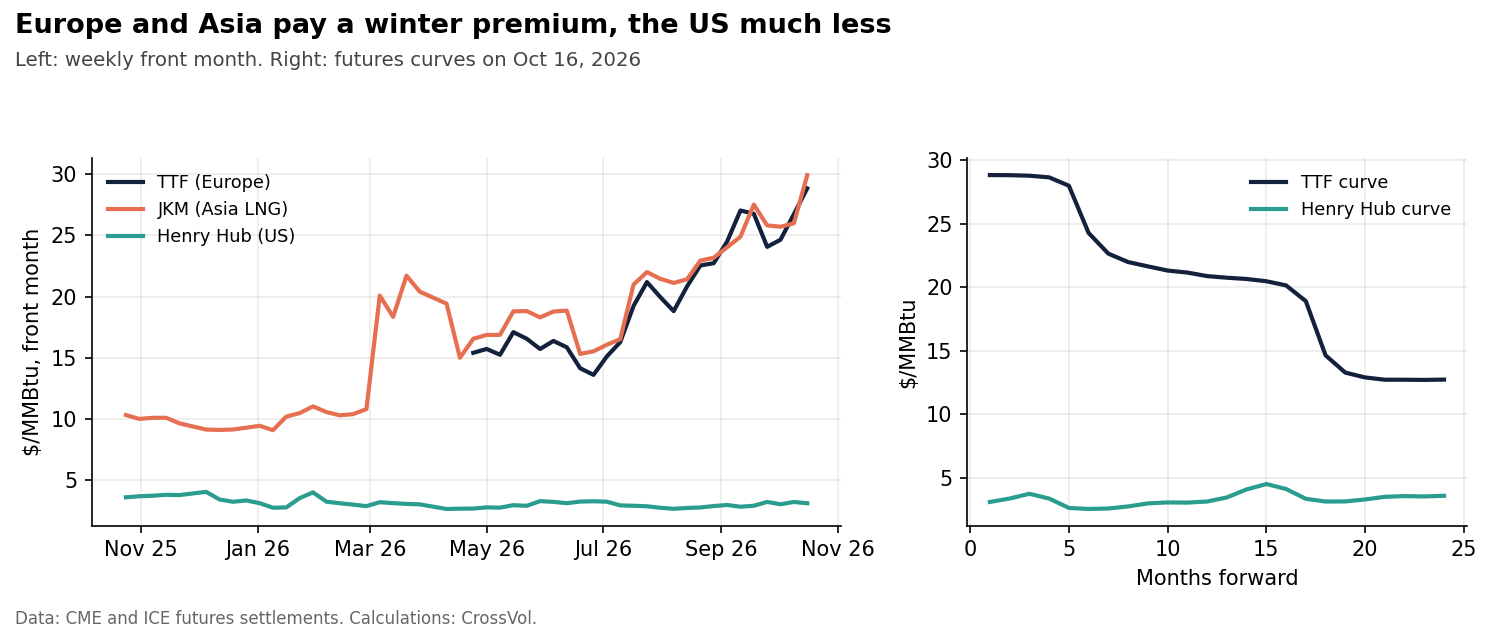
Converted into the same unit, TTF at 87.55 euros per MWh equals about $28.8 per MMBtu. JKM, the benchmark for liquefied natural gas (LNG) delivered to Japan and Korea, trades at $29.9 for December. Henry Hub trades at $3.12.
Europe and Asia. TTF more than doubled since late June, from $13.6 to $28.8 per MMBtu, and gained 3.8% this week on tighter supply and stronger heating demand expectations. In September and early October, Europe paid more than Asia on several weeks; Asia is back at a $1.10 premium. LNG contracts indexed to oil usually price at 11% to 14% of the Brent price per barrel, a ratio called the slope. Spot TTF and JKM now trade at a slope of 26% to 27%, about double: spot gas is priced well above its usual link to oil.
The European curve. TTF stays between 85 and 88 euros through March 2027, then falls with the end of winter, to 74 euros for April 2027. The 2027 strip averages 71.0 euros. The 2028 contracts quoted so far (January to October) average 45.9 euros, about 35% lower: the curve prices much cheaper gas once this winter and the next have passed. The JKM curve shows the same shape, down to $14 for May 2028.
The United States. Henry Hub fell 1.6% on the week despite a brief spike on Thursday, when TC Energy declared force majeure (a supplier's legal release from delivery obligations after an event outside its control) on its Columbia Gas Transmission system following a leak on the Mountaineer Xpress line in West Virginia. Storage stands at 3,567 billion cubic feet after a 67 billion cubic feet injection, a build below expectations. The Henry Hub curve does carry a winter rise, from $3.12 for November to $3.76 for January. The seasonal spreads are small, though. The March/April 2027 spread, a classic bet on a cold end of winter nicknamed the widowmaker, trades at $0.08, its lowest level since April. US gas is abundant while Europe and Asia pay for winter.
12. Freight
The Baltic Dry Index, a gauge of the cost of shipping dry bulk cargo such as grains, coal and ore, fell 12% on the week. Rate indices for VLCC and Suezmax vessels (very large and mid-size crude tankers) were unchanged. The split is consistent with weaker dry bulk demand and with tankers kept busy by rerouted voyages.
13. Equities and rates
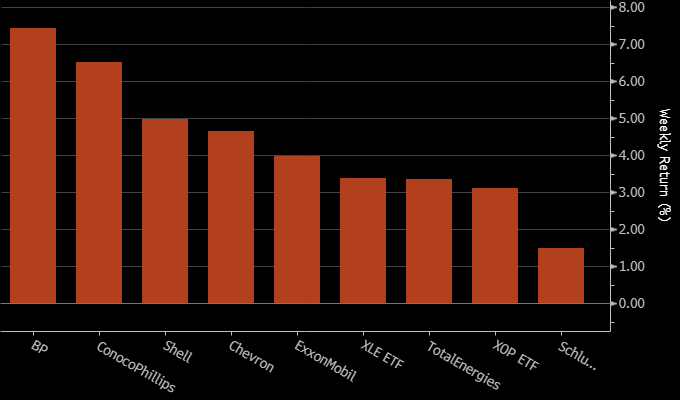
Energy stocks led: BP ($BP) +7.5%, ConocoPhillips ($COP) +6.5%, Shell ($SHEL) +5.0%, Chevron ($CVX) +4.7%, ExxonMobil ($XOM) +4.0%, TotalEnergies ($TTE) +3.4%, the energy sector fund $XLE +3.4% and the exploration and production fund $XOP +3.1%. Oil-field services lagged, with SLB ($SLB) up 1.5%. Options activity in the sector was heavily tilted to calls: on October 16, Occidental Petroleum ($OXY) traded 96,282 calls against 8,330 puts.
The S&P 500 had its worst week since June, with chipmakers down for an eighth session in a row, their longest losing streak since 2008. Higher fuel costs are feeding into prices: September consumer and producer prices both surprised to the upside, reinforcing expectations of further Federal Reserve rate increases. Long-dated Treasury yields rose more than short-dated ones on Friday, a steepening of the yield curve.
14. My read
The commodities strategist Jeff Currie wrote this week that "the macro repricing of energy is now underway", pointing to the move in long-dated oil. My reading of the curves is close to his.
For most of this year, the back of the oil curve ignored the front. Between April and mid September, December 2026 Brent swung across a $31 range while the November 2028 contract stayed within $7.6. A market that sees a temporary shock behaves exactly like that: it pays up for prompt barrels and leaves the long-run price alone. That changed over the past month. The November 2028 Brent contract broke above its range, and the December 2027 contract rose faster than December 2026 in percentage terms. When the whole curve lifts, the market is raising its estimate of what oil costs over the next several years, beyond the few missing cargoes of the moment.
The reasons are visible in the data of this article. Refining capacity disrupted in the Gulf and in Russia keeps diesel near twice the price of crude, and the forward diesel cracks stay above last June's levels into early 2028. Gas in Europe and Asia trades at double its usual link to oil. Hedgers and investors who need energy two and three years out are paying more for it, and they are typically the ones who move the long end.
I therefore see energy settling on a higher plateau: the spike in the front may fade, and the floor under it has moved up. The front of the curve can give back part of its premium, through calmer headlines or the expiry of crowded contracts, without changing that view. The signal I watch is the back end. If the 2028 contracts hold above their old range of $70 to $77 while the front corrects, the repricing is real. If they fall back into that range, the market will have treated this year as a shock after all.
Glossary
Backwardation / contango: a futures curve where near months are more / less expensive than later months.
Prompt spread: front-month price minus second-month price.
Calendar spread: price difference between two delivery months, for example December 2026 minus December 2027.
Strip: average price of a series of delivery months, often a calendar year.
Crack spread: price of a refined product minus the price of crude, in dollars per barrel.
3:2:1 crack: margin of two barrels of gasoline and one of diesel against three barrels of crude.
Implied volatility: expected size of price moves embedded in option prices, as an annual percentage.
OVX: Cboe index of 30-day implied volatility on crude oil.
Open interest: number of contracts outstanding.
Gamma / gamma flip: rate of change of an option's sensitivity to the underlying price; the flip is the price where dealer hedging would switch from absorbing to adding to moves.
Managed money / CTA: hedge funds and commodity trading advisers / trend-following funds.
MMBtu: million British thermal units, the unit of energy used to price natural gas.
TTF / JKM / Henry Hub: gas benchmarks for Europe, Northeast Asia LNG and the United States.
Further reading
Will Trump Strike Iran After the Midterms? A Brent Options Case Study
The Volatility Risk Premium Explained: Why Implied Beats Realized
Risk warning. This article is for education only. This is not investment advice. Futures, options and spreads can lose more than the initial margin. Past prices say nothing certain about future prices.
Data: CME, ICE, CFTC, EIA and Bloomberg. Calculations: CrossVol.