


By Djellal Djouad
Setup: Three Forces Meeting on One Name
The European oil majors are trading at the intersection of three forces that rarely align, and almost never with this intensity. The first is a genuine physical supply shock: the Saudi East-West pipeline outage stacked on top of Hormuz tension has taken roughly 15% of a name like TotalEnergies offline in output terms at the peak of the disruption, and pushed Brent to 103.87. The second is a French sovereign stress episode that will not quiet down, with the OAT-Bund 10Y spread at 104.6bp after a Scope downgrade and an admission on the deficit that the market read as confirmation rather than surprise. The third, and the one that matters most for how vol is priced, is a market that has already decided the first force is temporary. European oil and gas is down roughly 9% since the June 12 ceasefire despite the disruptions, and the option surface has begun to fade the shock premium almost as fast as the cash market.
For a vol desk, that combination is not noise. It is a structural setup where the same underlying, TotalEnergies (TTE), can serve as a hedge against French political risk, as the anchor of an energy relative-value book, and as the cleanest single-name expression of a normalization trade. This note builds the case around TTE, using the SX5E energy peer group (ENI, Equinor / EQNR, BP, Shell / SHEL, Repsol / REP) for relative value, and argues that the front-end skew on TTE is underpricing the most likely path for Brent from here. Barclays, UBS, Mizuho and Bloomberg Intelligence all feed into the picture, and where the numbers come from a house we name it.
TotalEnergies as a Natural Hedge to OAT-Bund
Start with the counterintuitive claim, because it drives the sizing on everything that follows. Over the window June 1 to September 18, 2026 (80 observations), TTE carries a positive beta to the OAT-Bund spread of +0.144, with an R-squared of 4.6%. Read literally, that says TTE tends to hold or rise as French sovereign risk widens. That is the opposite of what a naive French-domiciled large-cap should do, and it is exactly why the relationship is useful. But it is conditional, and the conditionality is the whole point. TTE is a hedge to OAT-Bund only when the common driver of both is the oil supply shock. When the widening is purely political, the hedge decays. The R-squared of 4.6% is the honest guide to how much of that hedge you can bank.
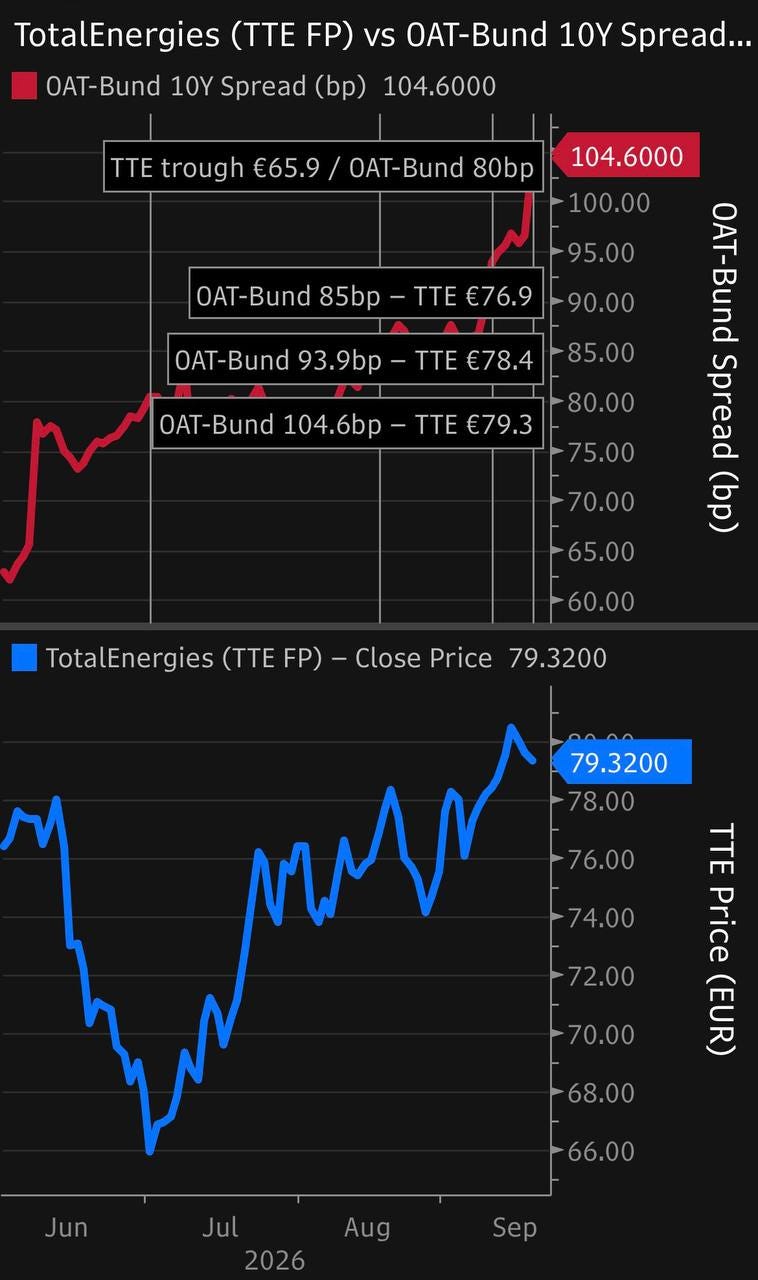
The window splits cleanly into three phases, and each teaches something different. In Phase 1, June 1 to July 1, the relationship was inverse. OAT-Bund widened from 62bp to 80bp while TTE fell from 76.4 to 65.9. Oil was falling into the ceasefire, and the oil leg dominated everything: TTE tracked crude down while the French spread crept wider on its own domestic dynamic. There was no common driver, so the two moved apart. This is the regime where TTE is not a hedge, and it is the low-left cluster of the scatter, the noisy, inverse, oil-down regime that anyone building the hedge has to mentally exclude.
Phase 2, July 1 to August 21, is where the positive beta was born. The Saudi pipeline shock hit, oil surged, and TTE rallied from 65.9 to 77.4, a gain of 17.4%. Over the same stretch OAT-Bund widened from 79bp to 87.5bp. Now the two are moving together, both pushed by the same supply shock: the oil bid lifts the major while the risk-off tone that accompanies a physical energy disruption leans on the periphery spread. This is the clean, high-right cluster, and it is where the +0.144 beta lives.
Phase 3, August 21 to September 18, is the proof. This is the most violent leg of the sovereign move, OAT-Bund from 87.5bp to 104.6bp, roughly 17bp of widening driven by the Scope downgrade and the deficit admission. If TTE were a normal French large-cap, this is where it should have bled. Instead it held, finishing +2.4% at 79.3. The major absorbed the sovereign leg because the oil supply shock was still the dominant common driver, and the energy exposure of the name overwhelmed its French domicile. That is the hedge working in real time, in the exact regime, energy-driven widening, where the model says it should work best.
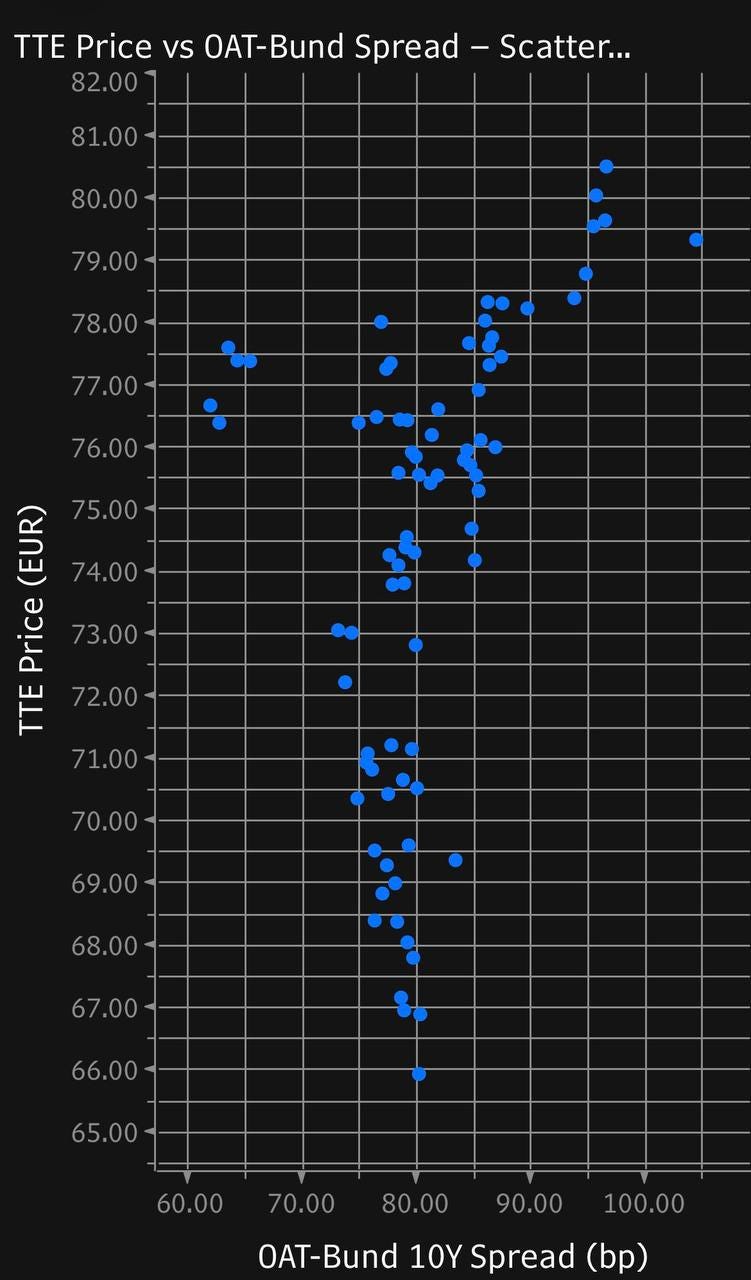
The scatter makes the two regimes visible. There is a low-left cloud, roughly 62bp to 80bp on the x-axis and 65 to 78 EUR on the y-axis, that is noisy and inverse, the Phase 1 oil-down world. And there is a high-right cloud, roughly 85bp to 105bp and 74 to 81 EUR, where the positive beta is clean. The practical implication for the book is precise. The hedge is strongest when OAT-Bund is widening on an energy catalyst, which is the current regime. If the next leg of French widening is purely political (a no-confidence vote, a Le Pen poll shock, a budget failure) with no accompanying oil catalyst, the hedge diminishes toward zero. That is why the 4.6% R-squared is not a footnote, it is the sizing input. It tells you to run TTE long-variance at roughly 100% to 120% of index weight as a sovereign hedge overlay, not as a full offset. You are buying a conditional hedge, and you size it for the fraction of the variance it actually explains.
Energy Vol Relative Value: Who Is Rich, Who Is Cheap
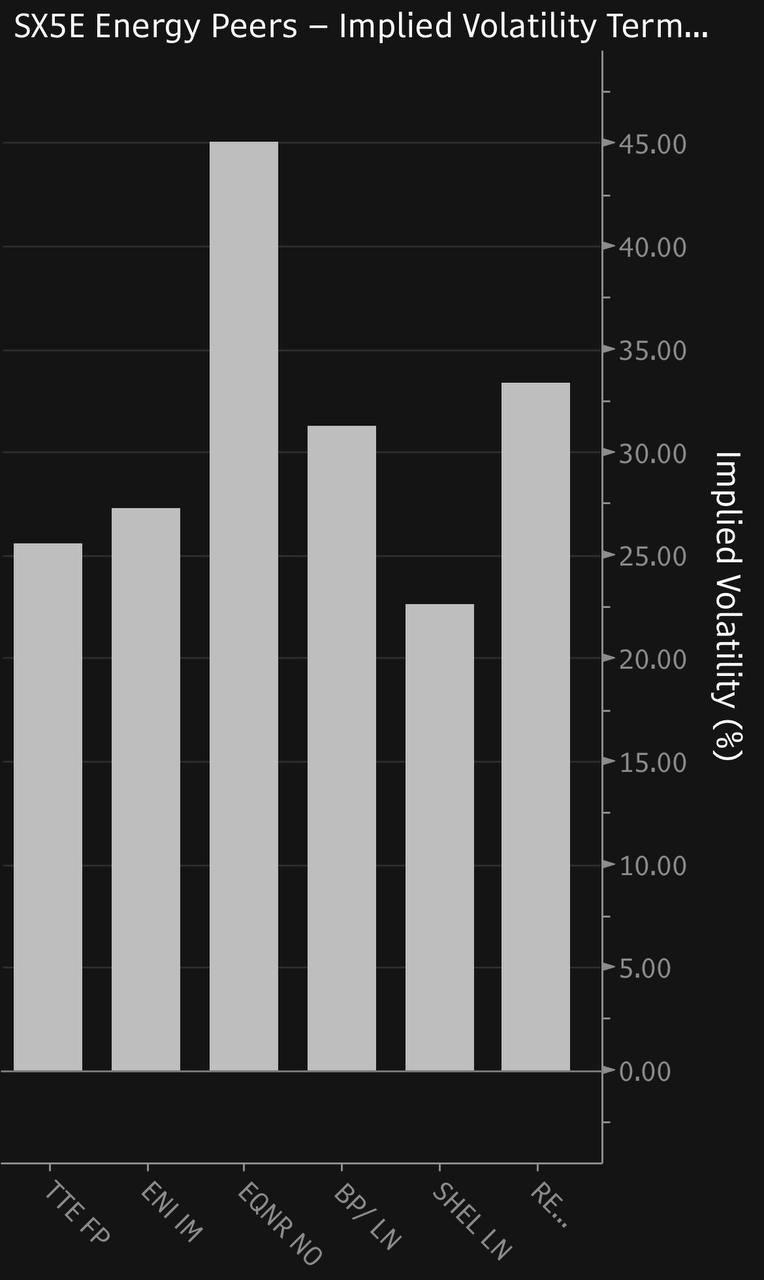
Before the skew, the level. The dispersion of implied vol across the peer group is wide enough to be a trade in itself. TTE sits at roughly 25.5, ENI at 27, BP at 31.5, Repsol at 33.5, Shell at 22.5 as the calmest name in the group, and Equinor at 45 as the clear outlier. That is a 22.5 to 45 vol point range inside a single sector, and Equinor's premium is not a data error, it reflects a name with a genuinely different vol regime that we will return to when we get to skew.
Level tells you what vol costs. The vol risk premium, implied minus realized, tells you whether it is worth paying, and here the term structure is the story. Across the group the VRP is positive at the front and decays with tenor, and one name breaks the pattern. Taking 30D / 60D / 90D VRP in vol points: Equinor runs roughly +20.5 / +12.8 / +10.8, the richest premium at every tenor. Repsol is next at roughly +7 / +6.3 / +4.8. TTE sits at +6.2 / +4.4 / +3.0. Shell is thinner at +4.3 / +3.1 / +1.8. BP is thinner still at +3.6 / +1.6 / +0.9. And ENI is the only name that goes negative in the back end: +2.77 at 30D, then minus 1.36 at 60D and minus 2.48 at 90D.
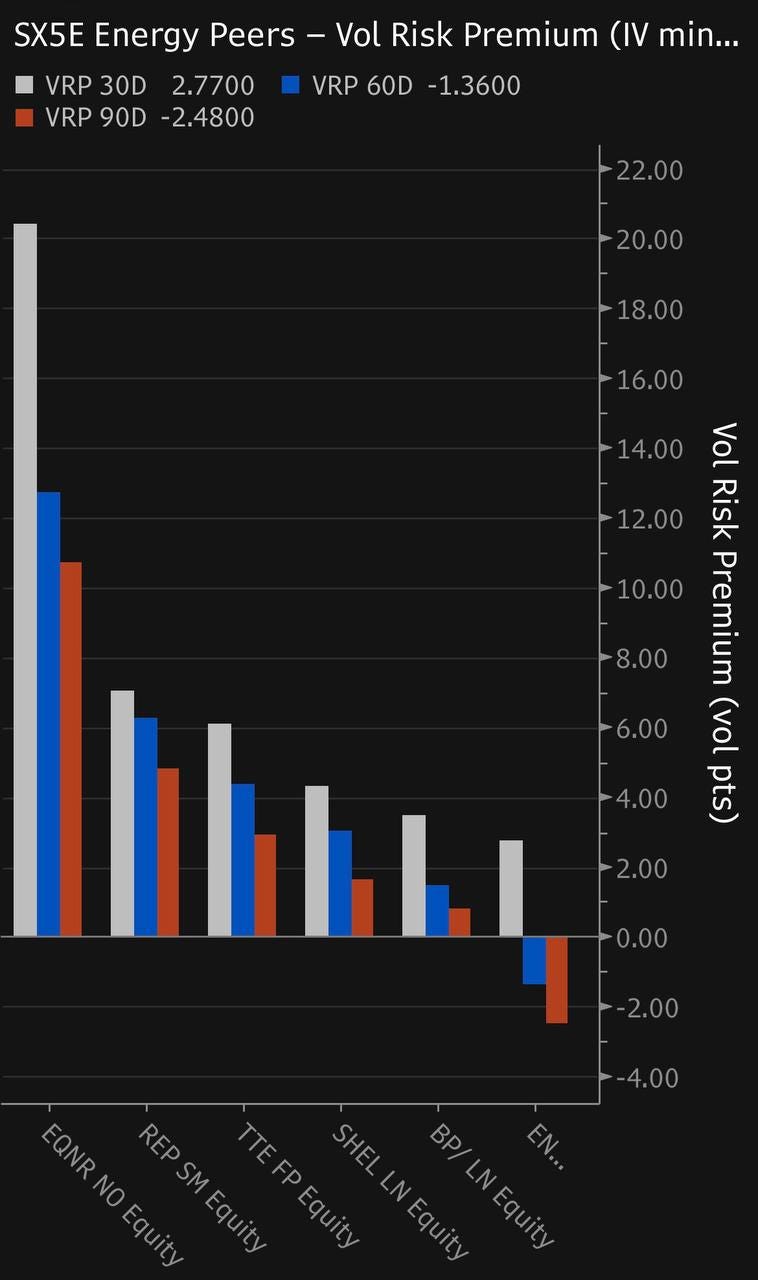
Two things fall out of this. First, the term structure of VRP is decreasing everywhere, 30D greater than 60D greater than 90D across all six names. That is the classic post-shock signature: the market pays up for near-dated protection while the physical disruption is live, and is unwilling to pay the same premium for a tenor that reaches past the expected resolution. Selling front-end energy vol is being paid; owning back-end energy vol is not. Second, ENI's negative back-end VRP is the single cleanest signal in the table. At 60D and 90D, ENI implied is trading below realized, which means owning ENI vol at those tenors has a negative expected carry against the recent realized path. Long vol simply does not pay in the back of the ENI curve. This dovetails with the TTE story: the name that gives you a positive front-end VRP and a conditional sovereign hedge is a more efficient place to hold energy variance than a peer whose back end is already inverted.
The TTE Skew Surface
Now the surface. The full skew table below is the spine of the trade, quoted as Put IV / ATM / Call IV / Risk Reversal at 30D, 90D and 180D, with the risk reversal expressed as 25-delta call minus put so that a negative number is put-rich.
TTE FP: 30D 26.85 / 25.57 / 26.14 / RR minus 0.71; 90D 26.06 / 24.82 / 24.17 / RR minus 1.90; 180D 24.95 / 23.37 / 22.80 / RR minus 2.15.
ENI IM: 30D 28.53 / 25.77 / 27.13 / RR minus 1.39; 90D 28.01 / 26.31 / 26.33 / RR minus 1.68; 180D 26.93 / 25.98 / 25.94 / RR minus 0.99.
EQNR NO: 30D 33.60 / 45.01 / 38.86 / RR plus 5.26; 90D 32.76 / 41.02 / 38.94 / RR plus 6.19; 180D 33.92 / 36.49 / 35.55 / RR plus 1.63.
BP LN: 30D 32.85 / 30.78 / 30.80 / RR minus 2.05; 90D 32.92 / 31.23 / 31.24 / RR minus 1.68; 180D 32.85 / 30.85 / 30.56 / RR minus 2.28.
SHEL LN: 30D 23.90 / 22.50 / 22.73 / RR minus 1.17; 90D 23.48 / 22.32 / 21.92 / RR minus 1.57; 180D 23.53 / 22.15 / 22.08 / RR minus 1.45.
REP SM: 30D 33.87 / 32.74 / 32.18 / RR minus 1.70; 90D and 180D not available.
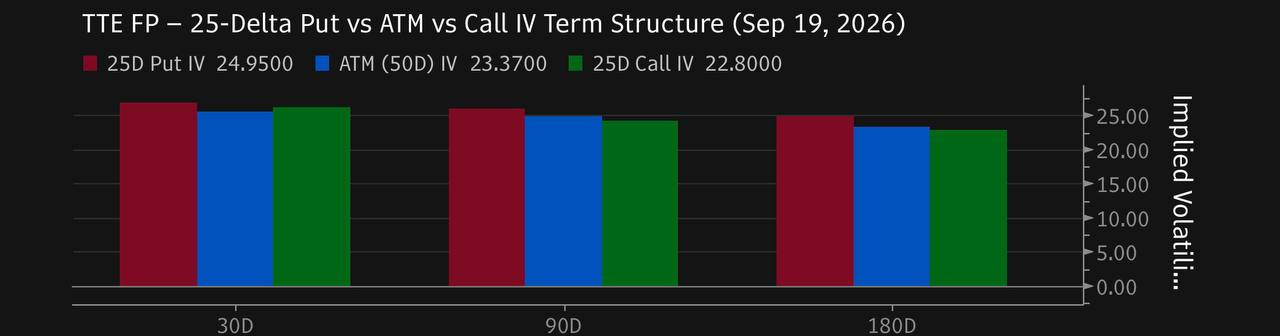
Five structural observations come out of that table, and each is a piece of the trade.
First, TTE has the shallowest put skew in a put-rich group. At 30D the risk reversal is only minus 0.71, with a put skew (put minus ATM) of +1.28. In a sector where every other put-rich name carries a deeper front-end skew, TTE's is the flattest. That is an anomaly given what the name is living through: roughly 15% output shut-in and a cash-flow sensitivity on the order of $2.8bn of CFO per $10 of Brent. The market is charging TTE the least for downside protection precisely when the fundamental downside from an oil reversal is largest.
Second, and this is the observation that makes the trade tenor-specific, TTE skew steepens into the back end. The risk reversal goes from minus 0.71 at 30D to minus 1.90 at 90D to minus 2.15 at 180D, a 144bp steepening from front to back. That is unique in the group. BP's skew is flat across tenors, Shell's is flat, and ENI's actively flattens. TTE is the only name where the market pays progressively more for downside the further out you go. The surface is encoding a specific belief: the near-dated shock resolves, so front puts are cheap, but the medium-term normalization risk is priced more aggressively, so back puts are rich. The surface itself is telling you that the market thinks the oil spike is temporary.
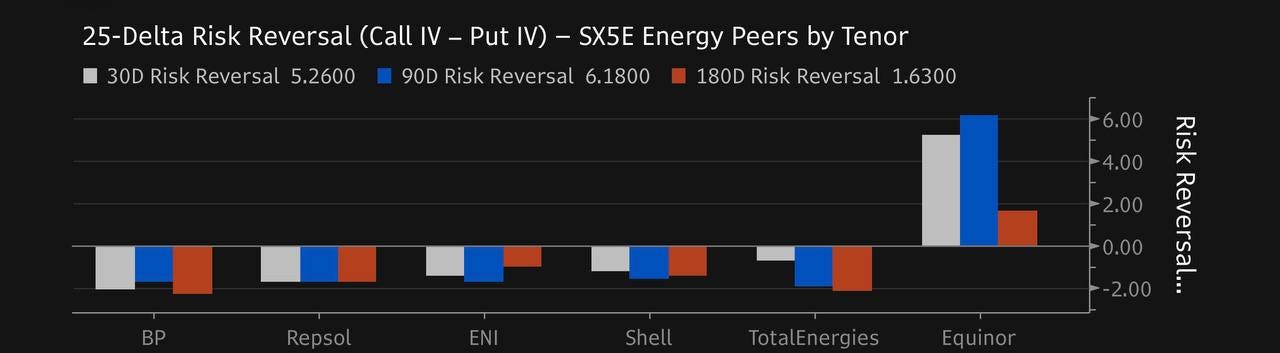
Third, Equinor is the only call-rich name in the sector, and it is call-rich at every tenor: RR plus 5.26 at 30D, plus 6.19 at 90D, plus 1.63 at 180D. The market prices asymmetric upside in EQNR, and there is a fundamental reason. Norwegian state ownership provides an effective floor, and the absence of a large downstream business means the name behaves more like a levered crude call than a diversified major. In a dispersion book, EQNR is the natural inverse of its peers: where you sell puts and buy calls on everyone else, EQNR is where you do the opposite, and where the richest call skew in the group makes selling upside the paid side of the trade.
Fourth, BP carries the deepest and flattest put skew: RR minus 2.05 / minus 1.68 / minus 2.28, with put IV essentially constant near 32.85 across tenors. That is the signature of structural, persistent downside rather than event risk. BP's skew is not steepening into a resolution because BP's downside is not about the oil shock, it is a standing feature of the name. You do not buy BP puts to express normalization; the market already owns that view at every tenor, flat.
Fifth, ENI's back-end skew collapses. At 180D the risk reversal is only minus 0.99, with put IV at 26.93 barely above call IV at 25.94. Those are the cheapest 180D puts in the group. Combined with ENI's negative back-end VRP, this makes ENI's 60D to 90D vol the clearest outright buy in the sector: the back end is cheap in both premium and skew.
Where Minus 0.71 Sits: TTE Historical Skew
A single risk-reversal print means little without the distribution behind it, and TTE's 30D risk reversal has been anything but stable this year. Over March to September 2026 the range runs from minus 3.79, the most put-rich print, set on June 16, to plus 5.33, the most call-rich, set on June 15. Read those two dates again: the surface swung 9.12 vol points in a single day across June 15 to 16. That is the raw sensitivity of this name's skew to oil headlines, and it is why any static reading of TTE skew has to be held loosely.
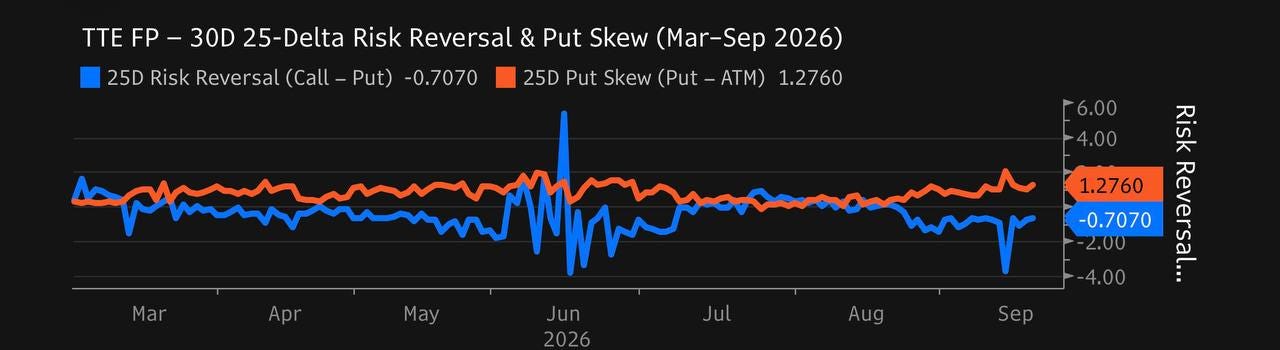
Against that range, the current minus 0.71 sits squarely in the middle, tilted to the call-rich side of neutral. In other words, after everything (the shock, the rally, the sovereign leg) the market has TTE's front-end skew back near the center of its own annual distribution, leaning slightly toward upside. The more telling number is the put skew path. It peaked at plus 2.08 on September 14, the height of the Saudi pipeline panic, and has since compressed to plus 1.28. That is 0.80 of a vol point of put premium bled out in five days. The market has already faded the shock premium in the skew, not just in the level. The cash market says the same thing: European oil and gas down roughly 9% since the June 12 ceasefire despite live disruptions is a market that is pricing rapid normalization, and the skew has followed the cash.
Does the Skew Price Normalization? The Verdict by Tenor
Here is the crux. Brent is 103.87. The normalization path that most of the sell side is underwriting takes it back toward 75 to 80. The question for the vol desk is whether TTE's skew, tenor by tenor, is charging enough for that path. The single most useful cross-check is what the equity is implying about oil. On Mizuho's work, TTE equity is pricing an implied Brent of roughly $73.26. That is above the peer average of $65.82 and close to the F2028 strip near $74.03. The reading is unambiguous: TTE equity is more richly priced to oil than its peers, which makes it more vulnerable, not less, to a normalization back toward the mid-70s and below. The name with the most equity exposure to a reversal is the name whose front-end downside is priced cheapest.
Take the verdict tenor by tenor. At 30D, RR minus 0.71 with put skew +1.28 is underpriced against the normalization risk. The skew has compressed off the September 14 peak, and the near-term normalization path is simply not reflected in the front-end downside charge. This is the sweet spot of the trade. At 90D, RR minus 1.90 with put skew +1.24 is fairly priced, consistent with an oil path toward $85 to $90 over that horizon. There is no obvious edge at 90D; the market has this tenor about right. At 180D, RR minus 2.15 with put skew +1.58 is adequately priced. This is the steepest point on the TTE surface, and it captures a genuine 6-month normalization scenario. The 180D put functions as a structural hedge against the elevated implied Brent embedded in the equity, and it is priced as such.
So the surface is internally coherent in a way that itself creates the opportunity. The back end already prices normalization; the front end does not. The steepening from minus 0.71 to minus 2.15 is the market saying "the shock resolves slowly," while the compression of front-end put skew from plus 2.08 to plus 1.28 is the market saying "the shock is already over." Both cannot be fully right. If normalization is real and near, the front end is too cheap. If the shock persists, the front end is fine but then the 9% sector selloff and the equity's rich implied Brent are the mispriced legs. Either way, the asymmetry points at owning TTE front-end downside.
Relative Value and the Pair Trade
Translating the surface into a book, the relative-value map is straightforward. On TTE, buy 30D 25-delta puts as the primary expression and sell 180D calls to finance, monetizing the steep, adequately priced back end against the cheap front. On ENI, buy 180D puts, the cheapest downside in the group with a collapsed back-end skew and a negative back-end VRP. On EQNR, sell calls and buy puts: the only call-rich name, where the richest upside skew in the sector makes selling the call the paid side and where puts are the natural normalization hedge. BP is neutral, its downside is structural and flat, offering no tenor edge. Shell is a mild sell of 30D puts given its thin front-end VRP. Repsol is neutral on one tenor of data.
The cleanest single trade in that map is the pair. Go long TTE 30D 25-delta puts against short EQNR 30D 25-delta puts. The logic is direct. TTE has the cheapest front-end normalization hedge in the group, a minus 0.71 risk reversal on a name whose equity implies a rich $73.26 Brent and whose cash flow swings $2.8bn per $10 of crude. EQNR has the richest call skew and, by extension, expensive puts relative to its own upside-priced surface, on a name with a state-ownership floor that dampens the downside the put is supposed to capture. You are buying the cheapest downside in the sector and selling the most expensive, on two names whose sensitivities to the actual level of oil are broadly offsetting. The pair is close to neutral on oil direction and long the specific thing that is mispriced: the front-end normalization skew differential between the most vulnerable major and the most floored one.
Conclusion and Risk
The through-line of this note is that TotalEnergies is one name doing three jobs, and each job reinforces the others. It is a conditional hedge to French sovereign risk, valid at roughly 100% to 120% of index weight in long variance while the OAT-Bund widening stays energy-driven. It sits in the middle of the energy VRP distribution with a positive front-end premium, a better place to hold variance than a peer like ENI whose back end has already inverted. And it carries the cheapest front-end normalization skew in a put-rich sector, on the equity most richly priced to oil, which is the actionable edge: buy the 30D 25-delta puts, and pair them short against EQNR 30D 25-delta puts for a near oil-neutral expression of the mispricing.
The risk is the same conditionality that makes the sovereign hedge work. Everything here leans on the oil supply shock remaining the common driver. If the next leg of French widening is purely political, with no oil catalyst, the OAT-Bund hedge decays toward the 4.6% R-squared that already warns you not to bank more than a fraction of it, and the correlation regime that held TTE up through Phase 3 can break. And the skew is fast: a name that swung 9.12 vol points in a single session across June 15 to 16 can reprice the front end violently on a single Hormuz or pipeline headline. The trade is a view that the market's own back end is right and its front end is lagging, that normalization is nearer than the compressing front-end skew admits. Size it as a skew trade, not a directional oil bet, keep the pair leg on to neutralize the crude beta, and respect that the same shock that created the opportunity is the thing that can unwind it fastest.
Related reading
Risk Reversal Skew Explained: reading put vs call IV
The Volatility Risk Premium Explained
CrossVol: dealer gamma and GEX
Djellal Djouad
Further reading