


By Djellal Djouad
There are two ways to be wrong in a dispersion book. The first is to pay too much for the trade, to enter when implied correlation is already elevated and index volatility is expensive, so that the spread between what you own and what you are short offers no room. That is the mistake most desks fear because it is legible: you can see it on the screen, you can measure it, and you can decline the trade. The second way is subtler and far more expensive. You enter the trade correctly, at a good level, with cheap index volatility and rich single-stock dispersion, and then the thing that was supposed to be independent stops being independent. Correlation runs to one, your single names all move together, your short index leg detonates, and the idiosyncratic offsets you were counting on never arrive. This week the US tape offers the first setup in near-textbook form and the second risk in a form that is quietly building underneath it. In Europe the same architecture presents itself, but with a specifically French wrinkle that most dispersion books are not sizing for: the OAT-Bund spread has become a common factor sitting inside the CAC-heavy names of the Euro Stoxx 50, and if you are short the index against a basket of French single names you are, whether you meant to or not, running a duration-flavored political bet on France. This note is about both legs, and about the framework that lets you separate the volatility you want to own from the macro factor you have accidentally doubled up on.
What a Dispersion Trade Earns and What It Loses
Strip a dispersion trade to its mechanics and it is almost embarrassingly simple. You are long single-name volatility and short index volatility. The P&L, to first order, is the realized idiosyncratic dispersion of the constituents minus the implied dispersion you paid for, scaled by your vega, minus the cost of carrying the short index-volatility leg. You win when the names move around independently while the index itself stays calm, because the variance of a basket is the sum of constituent variances plus all the pairwise covariance terms, and when correlation is low those covariance terms are small. The index sits still while the components thrash. That gap, single-name realized variance running hot against a sleepy index, is your edge, and it is monetized through the delta-hedging of the two legs.
The identity that matters is the one hiding in the covariance terms. Index variance equals the weighted average of single-name variances multiplied by an average correlation coefficient. Hold the single-name vols fixed and the entire behavior of the index leg is governed by that correlation number. When it is low, index variance is far below the average of the parts, and the short index leg is cheap to carry because it barely moves. When correlation rises, index variance inflates toward the average of the parts, the short leg gains value against you, and the single-name legs you are long do not offset because they are now all moving in the same direction. This is why a correlated move is the kill. It is not merely a bad day. It is the specific event that turns the structural logic of the trade against you, because the short index-volatility leg blows out precisely when the singles fail to disperse. Dispersion is short correlation, full stop, and every other framing is decoration. You are being paid to bet that names stay independent, and you are exposed, in the tail, to the moment they stop.
The US Snapshot: Cheap Index Vol, a Fat Single-Stock Premium
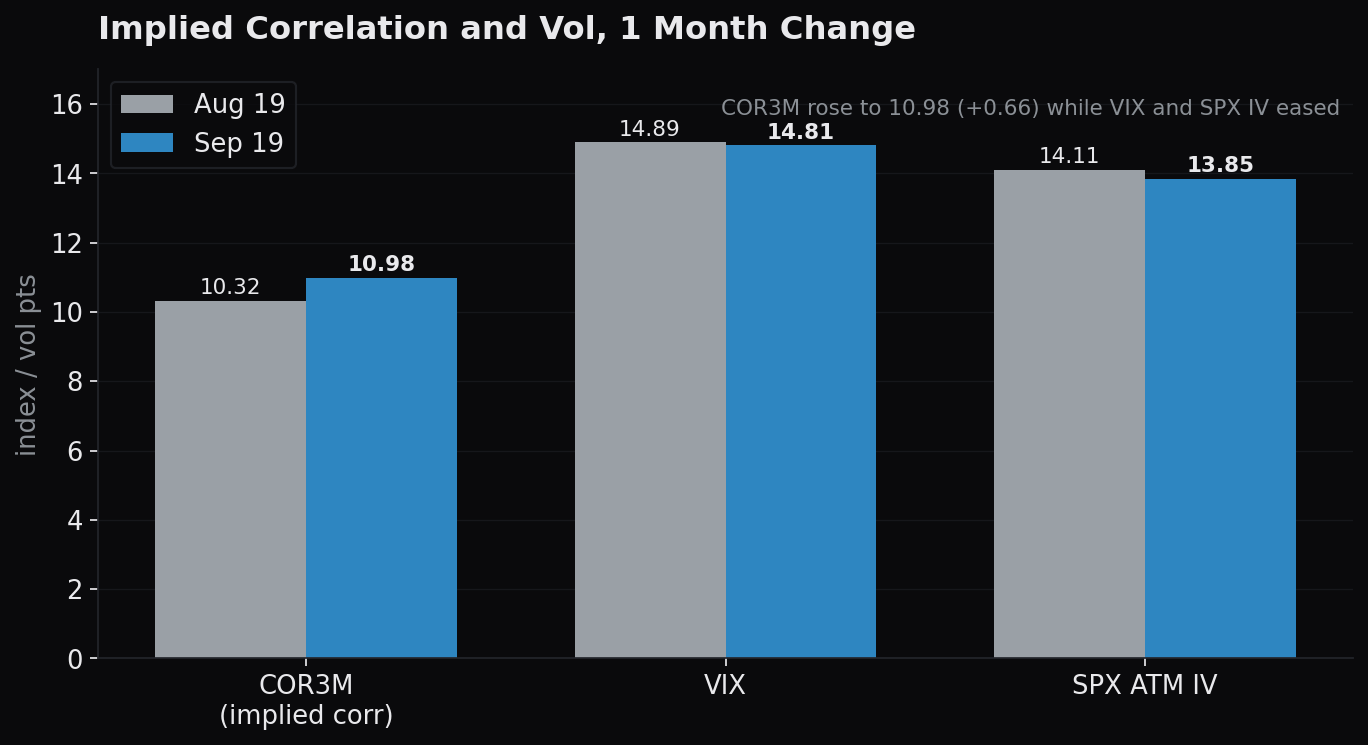
The entry conditions in the US this week are close to ideal on the surface. Three-month implied correlation, COR3M, sits at 10.98, up 0.66 from 10.32 a month ago but still historically depressed. The VIX is 14.81, essentially flat on the month at minus 0.08. SPX at-the-money implied volatility is 13.85, down 0.26. Against that placid index backdrop, the average single-stock implied volatility across the S&P 500 membership is 34.82. The median ratio of single-stock implied vol to SPX implied vol is roughly 2.32 times. That number is the whole trade in one figure. You are being offered single-name volatility at more than twice the level of index volatility, and the implied correlation that reconciles the two is sitting near the floor. Cheap index vol, rich constituent vol, a low correlation coefficient stitching them together. On the screen, this is exactly the configuration a dispersion desk waits for.
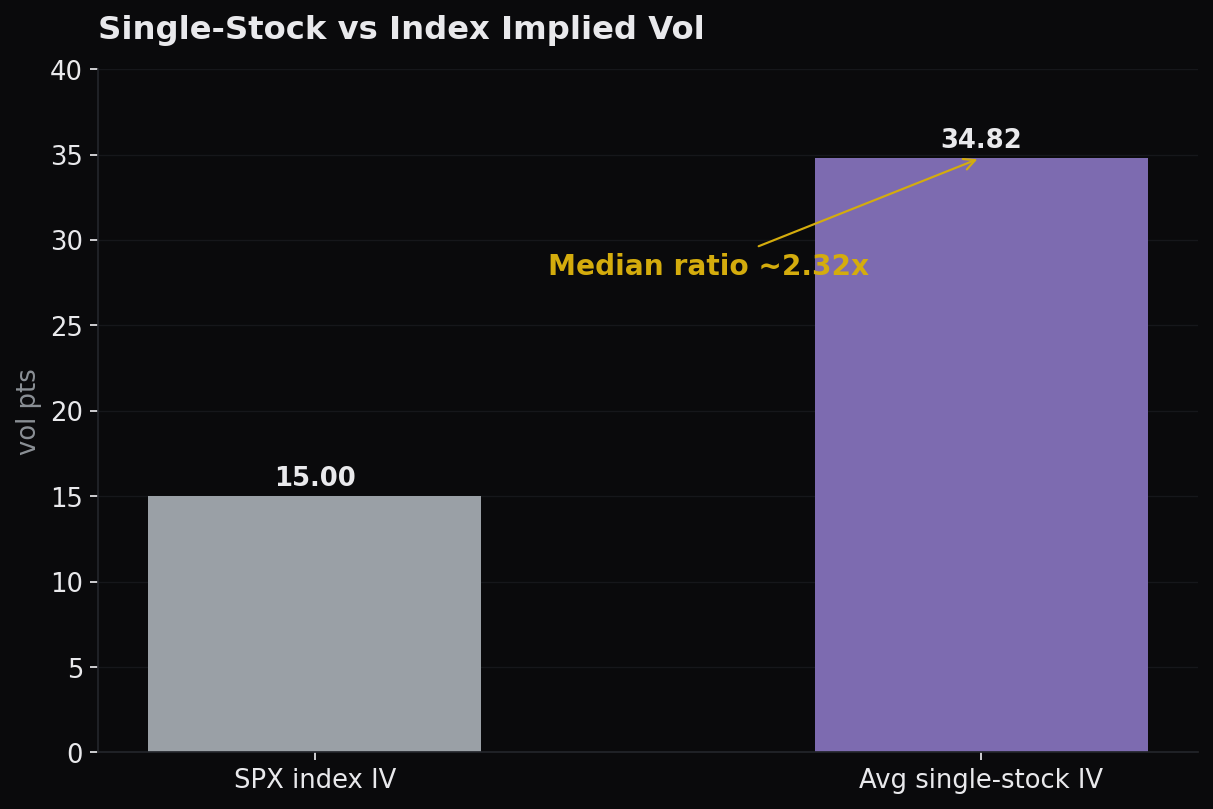
The single-stock vol premium is not evenly distributed, and that matters for how you build the long leg. The dispersion between the top and bottom of the membership by implied vol is wide, and the richest single-name vols cluster in exactly the names where the market is pricing genuine idiosyncratic uncertainty rather than beta. The 2.32 times median is a summary statistic that conceals a distribution with a long right tail, and the art of the long leg is choosing the names whose implied vol reflects real name-specific risk rather than a repriced market factor wearing a single-stock label. That distinction, idiosyncratic vol you want to own versus factor vol you are being tricked into buying, is the same distinction that the European section of this note will make quantitative through a regression. For now, hold the observation: the US offers a well-paid entry, and the question is not whether the trade is cheap but whether it is protected.
The Barbell: Idiosyncratic Dispersion Up, Systematic Correlation Up
It is not protected uniformly, and the reason is that correlation is not one number moving in one direction. It is a barbell. At one end, idiosyncratic dispersion is rising, and this is the tailwind. The pairwise correlation among the Magnificent Seven excluding Tesla is falling, target dispersion across the AI complex is widening, and the names that dominate index weight are, at the single-stock level, telling genuinely different stories about capital expenditure, monetization, and competitive position. That is real dispersion, and it is the fuel for the long single-name leg. If you were sizing a book purely off this end of the barbell you would lever into it, because AI-driven single-name dispersion is the most legitimate source of idiosyncratic variance the equity market has offered in years.
At the other end sits the problem. Systematic correlation is also rising, and rising faster in the places that matter. The correlation between technology-sector volatility and SPX volatility is now around 0.9, against roughly 0.7 in 2023 and 2024. When a handful of mega-cap technology names both dominate index weight and move in lockstep with index volatility, the "independence" you are counting on in the long leg is partly illusory. The names disperse on idiosyncratic news, yes, but their volatility co-moves with the index volatility you are short, and in a stress event that co-movement is what fattens the crash tail. The systematic end of the barbell is the enemy of dispersion because it is the channel through which correlation runs to one.
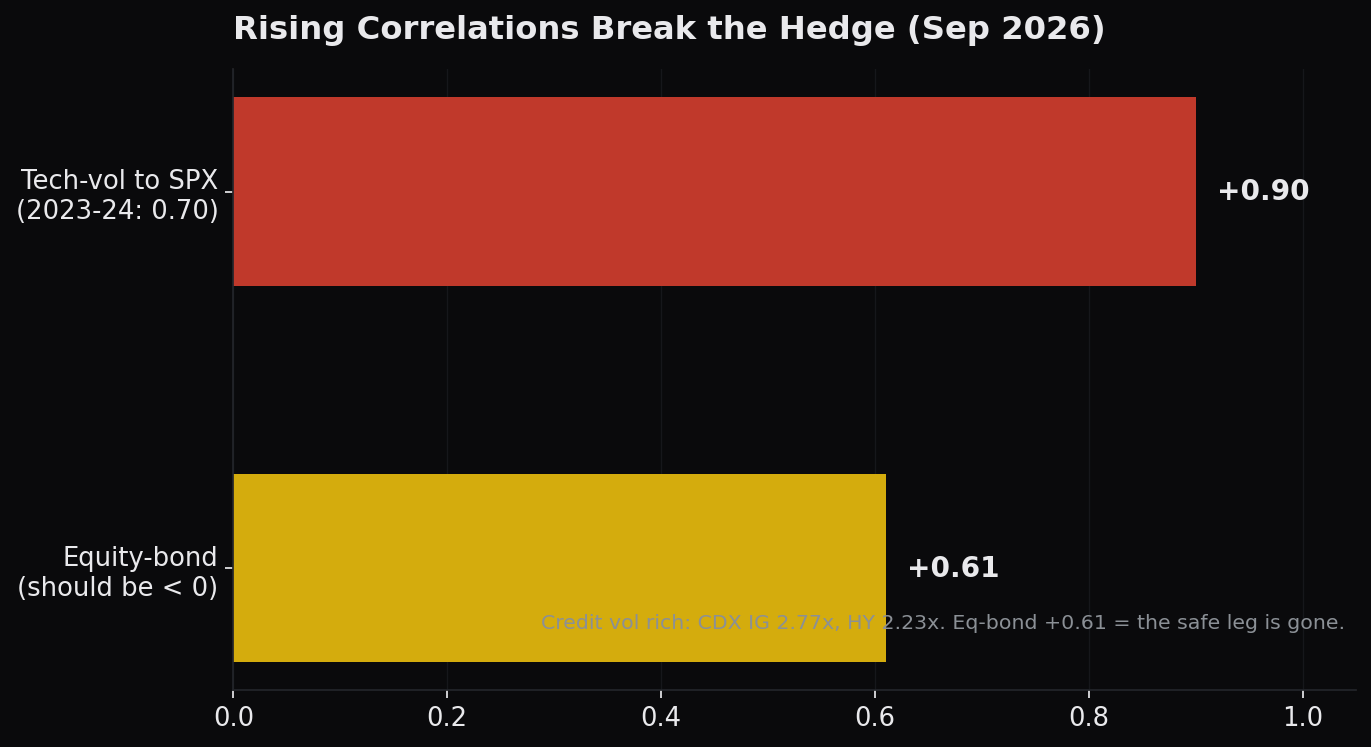
The third leg of the barbell is the one that should worry a desk most, because it removes the hedge you were relying on to survive the tail. Cross-asset correlation, specifically the correlation between equities and bonds, is +0.6071 and rising, and it has been rising since 2022. In a normal regime that number is negative: bonds rally when equities fall, and a long-Treasury position hedges an equity book. At +0.61 that relationship is broken. "De-risk into Treasuries" is a hedge that no longer hedges, because Treasuries now sell off alongside equities in the exact scenario where you need them to rally. The implied vol backdrop makes this easy to ignore. Volatility has been crushed, the VIX printed its largest single-day drop in ten years earlier in the cycle, and the ratio of realized to peak stress metrics sits near 1.37 against a peak near 10.95. Everything on the surface says calm. The barbell says otherwise: idiosyncratic dispersion is real and rising, systematic and cross-asset correlation are also rising, and the bond hedge that would have cushioned a correlation spike is not functional. Credit volatility, incidentally, is rich by the same logic, with CDX IG volatility multiples near 2.77 times and HY near 2.23 times, another market pricing calm in the body and paying up quietly for the tail.
The verdict is not "correlation is rising" or "dispersion is rising." Both are true, at different ends of the distribution, and the net is a barbell. You are well paid at entry because index vol is crushed and AI dispersion is rich. You are poorly protected in the tail because systematic correlation near 0.9 and equity-bond correlation at +0.61 mean a correlated move both blows the short leg and removes the hedge. This is the pennies-in-front-of-the-steamroller geometry, and the correct response is not to decline the trade but to build it as a barbell too: favor concentrated AI-basket dispersion over broad-market dispersion, because the 0.9 systematic correlation dominates the broad index and contaminates a wide book far more than a tight one, and size the short index-volatility leg for a correlation-to-one event that is not the base case but is the thing that ends the strategy. A companion note covers the basis and carry side of this same tail, because the dispersion book and the funding-basis book share one blow-up mechanism, correlation to one and liquidity to zero, seen from two desks. This note stays on the equity-volatility side.
The European Leg: SX5E Constituent Vol Against the Index
Europe presents the same architecture with different numbers and one additional factor that does not exist in the US book. Start with the raw dispersion picture. The Euro Stoxx 50 at-the-money implied volatility sits at 15.69%. The constituents span roughly 18% to 53%, with a couple of outliers in the low-50s in the zone occupied by names like Eni. That is a wide constituent distribution against a contained index level, structurally the same setup as the US: index vol low, single-name vol high, an implied correlation coefficient reconciling the two that a dispersion desk can sell.
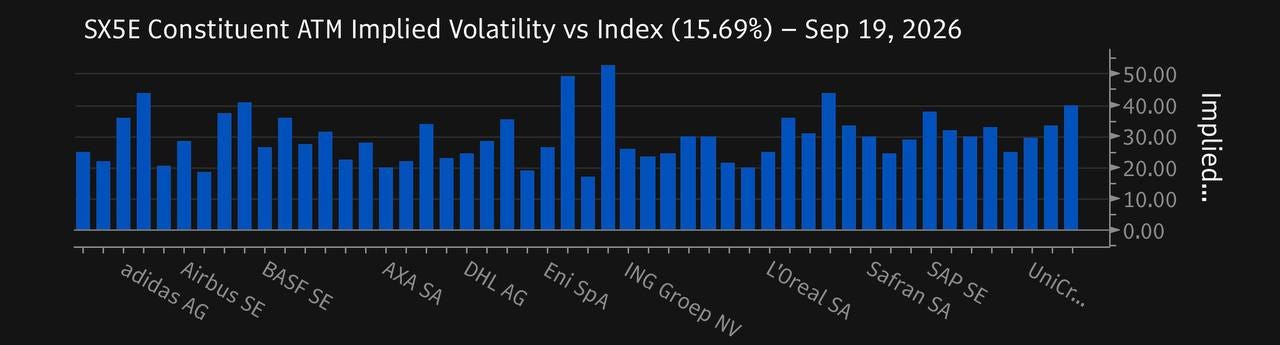
But the European index carries a factor the US index does not, and it is the reason a naive translation of the US trade into European names is dangerous. France is roughly 34% of the SX5E weight, and France in 2026 is a live sovereign-credit story. The OAT-Bund spread, the yield differential between French and German ten-year government bonds, has widened 41.8 basis points over the summer, from 62.8bp on June 1 to 104.6bp on September 18. With the French deficit projected above 5% of GDP in both 2026 and 2027, this is not a transient risk-off wobble. It is a structural repricing of French sovereign risk, and it transmits into French equities through cost of capital, domestic activity, and confidence. When you build a European dispersion book that is long French single-name vol and short SX5E vol, you have unknowingly embedded a bet on that spread on both legs, and unless you measure the exposure you cannot size it.
The OAT-Bund Beta Framework
This is the core of the note. Rather than treat "French political risk" as a qualitative overlay, measure it. The construction is a regression of each SX5E constituent's daily return on the daily change in the OAT-Bund spread, run over 79 trading days from June 1 to September 18, 2026, the window over which the spread widened its 41.8 basis points. The coefficient, the beta, tells you how much a name moves for a given change in the spread. A negative beta means the stock falls when the spread widens, which is the intuitive sign for a name that suffers when French sovereign risk is repricing higher. The magnitude tells you how much of that risk is loaded into the name. And critically, the R-squared of each regression tells you how much of the name's daily variance the OAT-Bund factor actually explains. That R-squared is the quality filter. A large negative beta with a trivial R-squared is noise: the name happened to co-move with the spread over the window but the factor does not govern it. A large negative beta with a high R-squared is signal: the OAT-Bund channel is a genuine driver of that name's returns, and if you are long its vol against a short index you are running that macro factor twice.
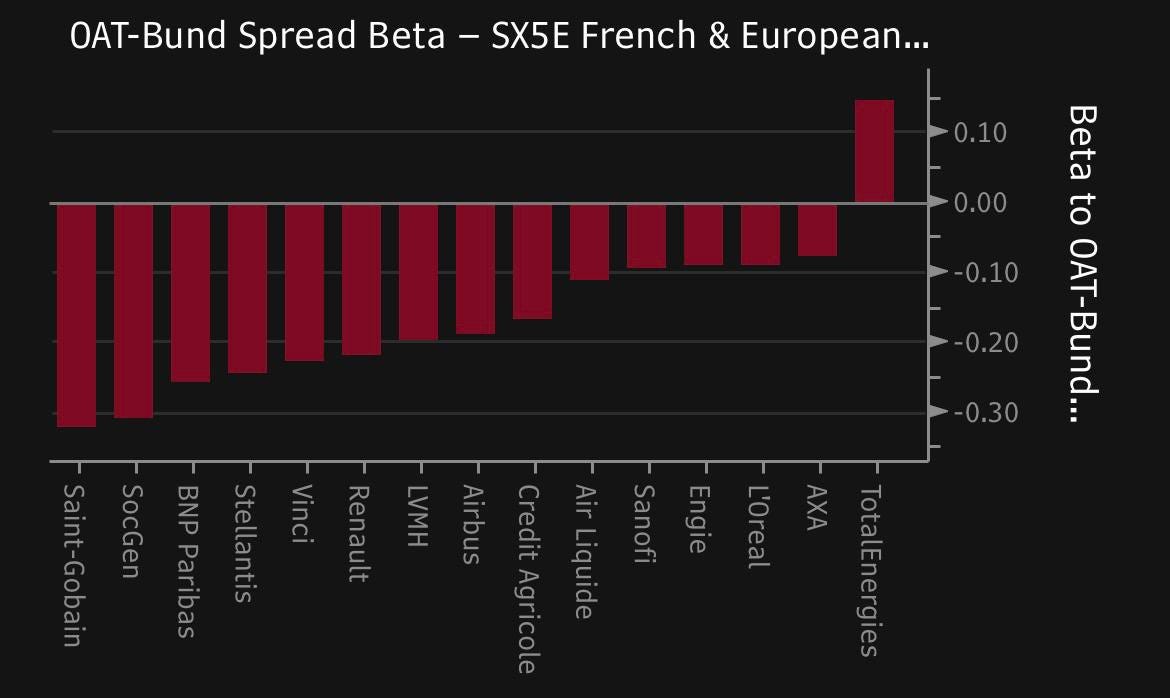
The ranked table, most negative beta to most positive:
Saint-Gobain (SGO FP), industrials and materials, beta -0.323, R-squared 12.8%, Tier 1 core. Societe Generale (GLE FP), financials, beta -0.310, R-squared 12.0%, Tier 1 core. BNP Paribas (BNP FP), financials, beta -0.259, R-squared 13.8%, Tier 1 core and the highest R-squared in the entire set. Stellantis (STLAM IM), consumer discretionary, beta -0.243, R-squared 3.9%, Tier 2 noisy. Vinci (DG FP), industrials, beta -0.228, R-squared 12.9%, Tier 1 core. Renault (RNO FP), consumer discretionary, beta -0.219, R-squared 4.3%, Tier 2 noisy. LVMH (MC FP), consumer discretionary, beta -0.196, R-squared 5.9%, Tier 2 noisy. Airbus (AIR FP), industrials, beta -0.188, R-squared 5.6%, Tier 2 noisy. Credit Agricole (ACA FP), financials, beta -0.170, R-squared 9.7%, Tier 1 core. Air Liquide (AI FP), materials, beta -0.113, R-squared 4.9%, Tier 3 low. Sanofi (SAN FP), health care, beta -0.096, R-squared 1.5%, Tier 3 low. Engie (ENGI FP), utilities, beta -0.091, R-squared 2.0%, Tier 3 low. L'Oreal (OR FP), staples, beta -0.091, R-squared 2.4%, Tier 3 low. AXA (CS FP), financials, beta -0.080, R-squared 3.6%, Tier 3 low but flagged latent. TotalEnergies (TTE FP), energy, beta +0.144, R-squared 4.6%, the natural hedge.
Read the R-squared column before the beta column. The four names where the OAT-Bund factor genuinely bites, ranked by explanatory power, are BNP at 13.8%, Vinci at 12.9%, Saint-Gobain at 12.8%, and Societe Generale at 12.0%. These are the names where a dispersion desk that is long single-name vol and short index vol is unambiguously running the French sovereign factor twice, once explicitly through the name and once through the France weight in the short index leg.
The transmission channels differ by sector, and understanding them is what turns a regression into a trade. The banks, Societe Generale, BNP, and Credit Agricole, transmit the spread through cost of equity and, for the domestic-heavy franchises, through the value of their sovereign holdings and domestic loan books. Societe Generale runs roughly 35% French retail exposure, which is why its beta is large and negative. The bank channel is important but tends to be mean-reverting: cost-of-equity repricing swings hard on sovereign headlines and then partially retraces as the market recalibrates. The industrials, Saint-Gobain and Vinci, transmit the spread through domestic activity, construction, infrastructure, and public-works exposure, and this channel is more structural and persistent. Saint-Gobain's position at the top of the ranking, the single most negative beta with a high R-squared, is precisely because its business is a leveraged read on French and European domestic construction, exactly the activity that a sovereign-credit repricing and a widening deficit path threaten. Vinci sits right alongside for the same reason: concessions and public-works exposure tie it to the domestic fiscal state. Consumer discretionary, Stellantis, Renault, LVMH, transmits through a mix of confidence and, for the autos, a contagion channel where domestic demand and financing conditions compound, but the low R-squareds tell you the OAT-Bund factor is not what actually drives these names day to day. Their volatility is idiosyncratic, autos on their own cycle, LVMH on global luxury demand, and the negative beta is more coincidence over the window than mechanism.
Then there is TotalEnergies, the one positive beta in the set at +0.144. This is the natural hedge, and the mechanism is clean: the scenarios that widen the OAT-Bund spread, broad risk-off, energy or geopolitical shocks, tend to coincide with higher oil, and TotalEnergies is a beneficiary of the oil move. The oil shock offsets the sovereign channel, so the name rises when the spread widens rather than falling with it. In a French dispersion book, TotalEnergies is not just another long single-name leg. It is a structural offset to the OAT-Bund factor loaded into the rest of the French complex.
Finally, the AXA anomaly, which is the reason you run the regression rather than trusting priors. Barclays European Equity Strategy has historically flagged AXA, Air Liquide, and Renault as the France-sensitive names, the ones a strategist would name if asked which SX5E constituents carry French political risk. The regression puts AXA near the bottom of the ranking, beta -0.080 with a low R-squared of 3.6%. The resolution is that AXA's sensitivity is real but currently masked. As an insurer, AXA has been carried by the rate tailwind, up roughly 13% since June, because higher rates improve the economics of its liability book, and that positive rate sensitivity has offset the negative sovereign-spread sensitivity over this particular window. The OAT-Bund beta is latent, not absent. If the rate tailwind fades or reverses, or if the spread widens in a scenario that does not lift rates the same way, AXA's underlying France sensitivity re-emerges. This is exactly the kind of masked exposure that a qualitative overlay gets wrong in both directions: it flags AXA as high-risk on priors when the current data says low, and it would miss the latency if it trusted only the current beta. The regression plus the sector logic together give you the answer the strategist's list and the raw coefficient each get half right.
Weighting the Dispersion Book by Tier
The framework restructures how each French name is sized in the book, and the organizing principle is straightforward: the macro factor is already in your short index leg, so you do not want to double-load it through the long single-name legs. Where the OAT-Bund factor is strong and well-explained, reduce the single-name weight, because the France weight in the short SX5E leg is already giving you that exposure and stacking it explicitly turns your dispersion trade into a concentrated short on French political risk. Where the factor is weak, overweight, because those are the cleanest sources of the idiosyncratic vol you actually want to own.
Tier 1 core, the high-beta high-R-squared names, Saint-Gobain, Societe Generale, BNP, Vinci, and Credit Agricole: reduce to 40% to 60% of index weight. The macro factor is already captured in the short index leg, and doubling the short of French political risk through these names is not dispersion, it is a directional macro bet wearing a dispersion costume. Relative-value within the bank cluster, Societe Generale against BNP against Credit Agricole, remains a legitimate expression because there the shared OAT-Bund factor nets out and you are left trading the idiosyncratic spread between the franchises.
Tier 2 noisy, the low-R-squared names where idiosyncratic vol dominates, Stellantis, Renault, LVMH, and Airbus: hold at 100% to 120% of index weight. The OAT-Bund factor barely explains these names, so the vol you buy is genuinely idiosyncratic, autos on their cycle, luxury on global demand, Airbus on the order book and production ramp. This is dispersion doing what it is supposed to do.
Tier 3 low, the cleanest idiosyncratic names, Sanofi, Engie, L'Oreal, and AXA: overweight to 130% to 150%. Sanofi's health-care vol, Engie's utility and regulatory vol, L'Oreal's staples vol, and AXA's insurance vol are the least contaminated by the French sovereign factor over this window, which makes them the purest long-vol legs in the book. AXA sits here with the explicit caveat that its OAT-Bund beta is latent, so treat the 130% to 150% overweight as conditional on the rate tailwind persisting and be ready to cut if the sovereign channel re-emerges.
TotalEnergies, the positive-beta natural hedge: hold at 100% to 120% as a structural offset. Owning its vol partially neutralizes the residual OAT-Bund factor that leaks through the rest of the book, and the positive beta means it pulls against the French complex when the spread widens.
The short index leg is where the OAT-beta adjustment becomes explicit. Run the short SX5E leg at 85% to 90% of neutral notional rather than the full neutral size. The reasoning: the France weight in the index, roughly 34% of the SX5E with the Tier 1 core names alone at 12% to 15%, already carries substantial OAT-Bund exposure. Shorting the full neutral notional of the index while also holding French single-name longs stacks the sovereign factor in a way you cannot easily see, and trimming the short leg to 85% to 90% builds in a buffer against the OAT-beta you are otherwise doubling. For a desk that wants precision, consider substituting CAC exposure for part of the SX5E short leg, because the CAC has a higher OAT-Bund beta than the broad SX5E and lets you target the French factor deliberately rather than absorbing it as a side effect. The point of the whole exercise is control: you decide how much French sovereign risk sits in the book, rather than discovering it in the tail.
Risk Management: Sizing for Correlation to One
Everything above assumes the base case holds, names disperse, the index stays contained, the OAT-Bund factor stays a manageable overlay. The job of risk management is to survive the case where it does not, and both legs of this note point at the same failure mode. In the US book it is systematic correlation near 0.9 and equity-bond correlation at +0.61: a correlated move blows the short index-vol leg while the bond hedge fails to rally. In the European book it is the OAT-Bund spread gapping wider in a disorderly way, which would drive all the French names down together, collapse the intra-book dispersion you were long, and hit the short index leg through the France weight from the other side. The common enemy is correlation to one and liquidity to zero, and the defensive posture is the same on both sides: cap the short index-volatility leg for a correlation spike that is not your base case but is the event that ends the strategy, prefer concentrated AI-basket dispersion in the US over broad-market dispersion because the 0.9 systematic correlation contaminates a wide book more than a tight one, keep OTM convexity because the equity-bond hedge is non-functional at +0.61, and in Europe run the short leg at the 85% to 90% buffer with the tier weights that keep the French sovereign factor from stacking.
The calendar next week supplies the triggers. A Trump-Xi summit whose outcome is binary, roughly $173bn of Treasury auctions that could shock the front end and, through the equity-bond correlation, feed straight back into the equity tail, and a run of Fed speakers who can move the rate path and with it the AXA-style rate tailwind that is currently masking latent exposures. The single number to watch above all others is the equity-bond correlation itself. At +0.61 the hedge is already broken, and if it climbs further the "de-risk into Treasuries" reflex most books rely on becomes actively harmful, selling equities into a Treasury position that is falling with them. It is the variable that tells you whether the tail this note describes is approaching or receding.
Conclusion
The dispersion trade this week is well paid to enter and poorly protected in the tail, and the correct response to that asymmetry is not to decline it but to build it as a barbell that mirrors the correlation structure itself. In the US, that means owning concentrated AI-basket dispersion where the idiosyncratic story is real, at a 2.32 times single-stock to index vol premium against a COR3M of 10.98 and a VIX of 14.81, while sizing the short index-vol leg for the correlation-to-one event that the 0.9 tech-SPX correlation and the +0.61 equity-bond correlation are quietly making more likely. In Europe, it means refusing to treat French political risk as a vibe and instead measuring it: the OAT-Bund beta regression turns "France is 34% of the index and the deficit is above 5% of GDP" into a sizing grid, reduce the Tier 1 core names to 40% to 60% because the short index leg already carries their macro factor, hold the Tier 2 noisy names at index weight for their clean idiosyncratic vol, overweight the Tier 3 low names to 130% to 150% as the purest long-vol legs, hold TotalEnergies as the positive-beta hedge, and run the short index leg at 85% to 90% with a possible CAC substitution to control the sovereign exposure deliberately. Saint-Gobain at -0.323 with a 12.8% R-squared and BNP at -0.259 with the highest R-squared in the set are not the same kind of long as Sanofi at -0.096 with a 1.5% R-squared, and a book that sizes them identically is running a macro bet it did not choose. The OAT-Bund at 104.6bp is a structural repricing, not a headline, and the dispersion desk that measures its transmission name by name is the one that will still be in the trade when the ones who did not are explaining a correlated move to their risk committee.
Related reading
Dispersion Trading Explained: implied correlation and single-stock vol
Implied Correlation (COR3M) Explained
Djellal Djouad
Further reading