


By Djellal Djouad
Implied correlation is the market's forward-looking estimate of how tightly the stocks inside an index will move together, backed out from option prices. COR3M is the CBOE 3-month implied correlation index, and reading it tells you whether the market is pricing a herd that moves as one or a crowd of stocks going their separate ways.
If you trade dispersion, hedge a book, or simply want to know why a low-VIX tape can still be fragile, implied correlation is the single number that connects index volatility to single-stock volatility. Below we define it, show how it is derived, read a live level, and explain why it sits at the center of the dispersion trade.
What Is Implied Correlation
Implied correlation is the average pairwise correlation between an index's constituent stocks that the options market is currently pricing in. It is not measured from past returns. It is solved for from present option prices, which makes it a forward-looking gauge rather than a rearview mirror.
COR3M is the CBOE implied correlation index with a roughly 3-month horizon. CBOE also publishes shorter and longer tenors, but the 3-month reading is the workhorse because it lines up with the most liquid listed options and with the typical holding period of a dispersion book. The index is quoted on a scale where higher means the market expects stocks to move more in lockstep, and lower means it expects them to move more independently.
The intuition is simple. An index is a basket. If every stock in the basket zigs and zags at the same time, the basket swings hard. If the stocks move on their own idiosyncratic news, their moves partly cancel and the basket is calmer than its parts. Implied correlation is the number that quantifies exactly how much cancellation the market is pricing.
How Implied Correlation Is Calculated
Start with a fact about variance. The variance of an index is not just the average variance of its members. It also depends on how those members co-move. Index variance is built from single-stock variances plus every pairwise covariance between the stocks. Covariance is correlation scaled by the two volatilities, so correlation is baked directly into the index number.
Rearrange that relationship and you can solve for the one unknown. You observe index implied variance from index options. You observe single-stock implied variances from single-stock options. The only piece left is the average pairwise correlation, so you back it out. In plain terms:
Implied correlation is approximately equal to index variance divided by the weighted sum of single-stock variances.
That is the whole engine. When index implied volatility is high relative to the average single-stock implied volatility, the ratio is high and implied correlation is high. When index volatility is low relative to expensive single-stock volatility, the ratio is low and implied correlation is low. The number is bounded conceptually between zero and one, though the index scale expresses it in points.
This is why implied correlation is often called the missing link. Index vol and single-stock vol are both observable. Correlation is the hidden variable that reconciles them, and COR3M makes it observable too.
Reading the Level: What COR3M at 10.98 Tells You
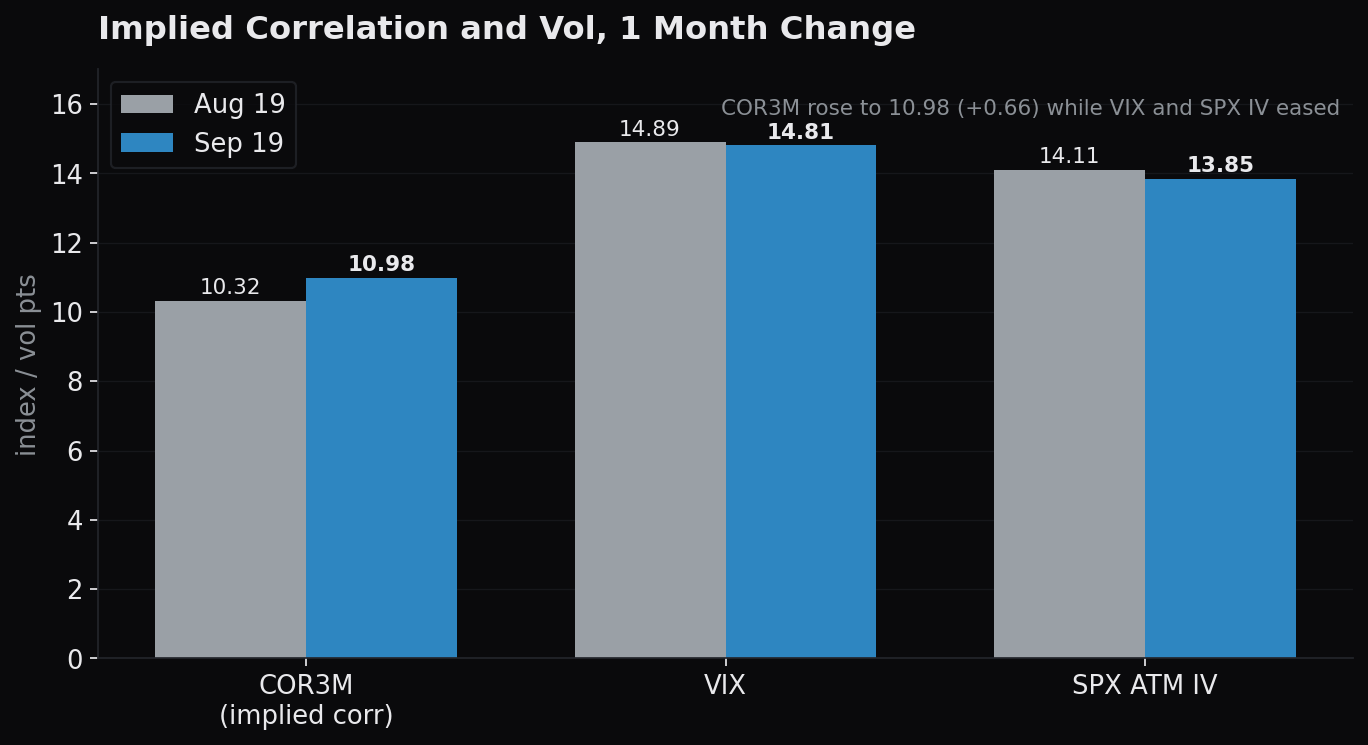
Put real numbers on it. COR3M sits near 10.98, up from about 10.32 a month earlier. VIX is around 14.81. SPX at-the-money implied volatility is roughly 13.85. The average single-stock implied volatility across the large caps is about 34.82.
Look at the gap. Single stocks are pricing volatility near 35 while the index is pricing volatility near 14. That enormous spread is only possible if the market expects a lot of single-stock moves to cancel out inside the basket. In other words, low implied correlation is what lets a basket of 35-vol stocks trade like a 14-vol index. The 10.98 reading is a low-correlation regime. Stocks are being priced as if idiosyncratic stories, earnings, and single-name flow will dominate, not a common macro driver dragging everything the same direction.
Now read the change. COR3M rising from 10.32 to 10.98 is a small but real tick up. Correlation is creeping higher even as the absolute level stays low. That is the early tell dispersion traders watch. When correlation is cheap and starts to firm, the index becomes relatively more expensive versus its parts, and the payoff profile of a long-dispersion position starts to compress.
A high-correlation regime looks different. In stress, single names stop trading on their own news and start trading on one factor, risk-on or risk-off. Correlation snaps toward one, index vol catches up to single-stock vol, and the calming effect of diversification evaporates. That is the regime a COR3M reading near 10.98 is not in, yet, which is exactly why the level and its drift both matter.
Why Traders Watch It
The dispersion trade lives and dies on this number. The classic structure is short index volatility and long single-stock volatility, or the reverse. You are not betting on direction. You are betting on the spread between the basket and its parts, which is a bet on correlation. Low implied correlation makes long dispersion attractive because you are effectively selling the expensive index vol and buying cheaper relative single-stock vol. When COR3M is low and expected to rise, that edge narrows.
Beyond dispersion, correlation is a risk factor in its own right. A portfolio that looks diversified at a correlation of 0.2 is a very different animal at a correlation of 0.8. The correlation-to-one tail is the scenario every risk manager fears. It is the moment when every hedge that relied on things moving differently fails at the same time, because everything is suddenly moving together.
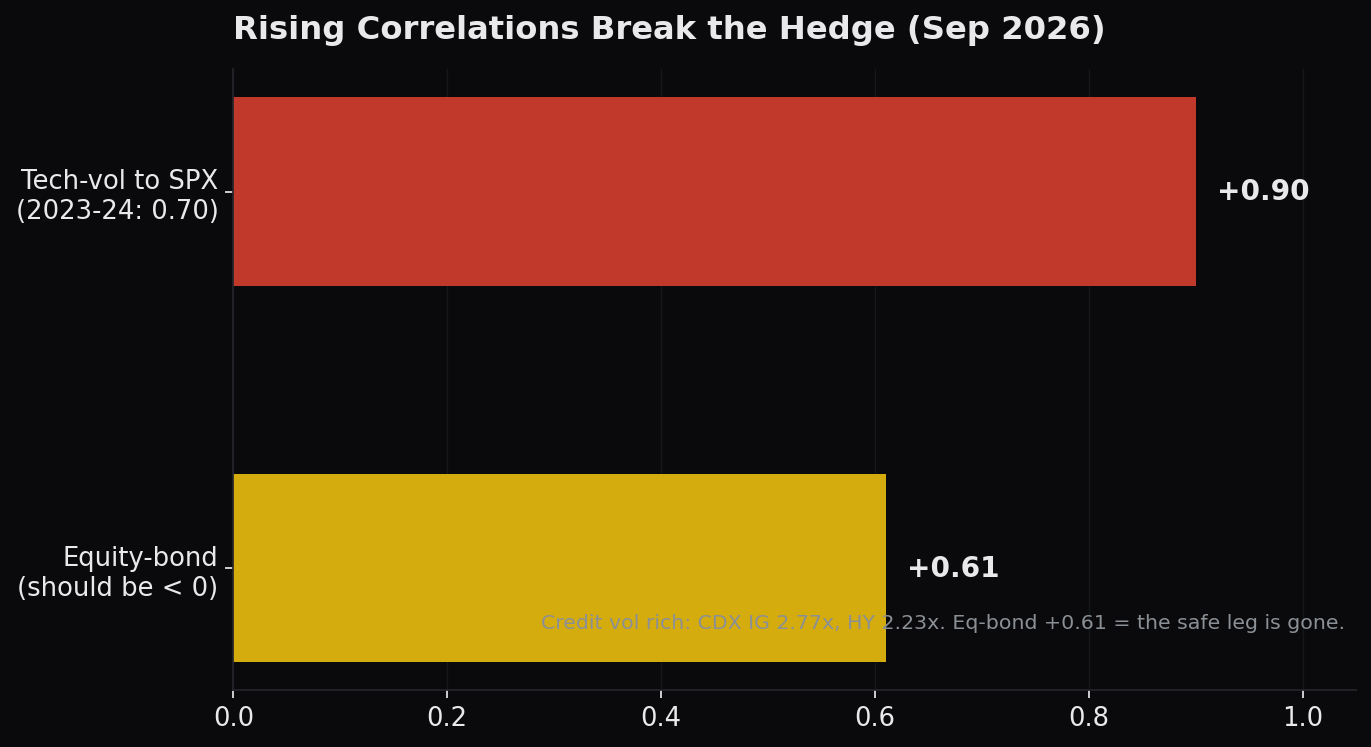
The cross-asset version of this is just as dangerous. The equity-bond hedge, the reflex that bonds rally when stocks fall, breaks when their correlation flips positive. At a positive reading around +0.61, stocks and bonds are falling together, and the classic 60/40 diversification stops working precisely when it is needed. Watching correlation across and within asset classes is how you see that fragility building before price confirms it.
Related CrossVol Research
For a live worked example of correlation as a tradable channel across assets, see Dispersion and the OAT-Bund channel, which walks through how correlation spreads move between related markets and where the dispersion edge sits.
To connect implied correlation to the dealer-positioning picture that often drives it, our gamma exposure and GEX research shows how index-level options flow shapes the very index volatility that feeds the COR3M calculation.
FAQ
What is implied correlation? Implied correlation is the forward-looking average correlation between the stocks in an index, solved from option prices rather than measured from history. It tells you how much the market expects index members to move together over the coming period, which drives how index volatility relates to single-stock volatility.
What does COR3M measure? COR3M is the CBOE 3-month implied correlation index. It measures the average pairwise correlation the options market is pricing across major index constituents on a roughly three-month horizon. Higher readings mean stocks are expected to move in lockstep, lower readings mean more independent, idiosyncratic movement.
What is a normal implied correlation level? There is no single normal, but readings in the low teens on the COR3M scale reflect a calm, low-correlation regime where single-stock stories dominate. A print near 10.98 is low. Stress regimes push correlation sharply higher as names start trading on one common macro factor.
How do you trade implied correlation? Most directly through dispersion trades: short index volatility versus long single-stock volatility, or the reverse. You are betting on the spread between basket and constituents, which is a bet on correlation rising or falling rather than on market direction. Correlation swaps offer a cleaner, more direct expression.
Djellal Djouad
Further reading