


By Djellal Djouad
Dispersion trading is a volatility strategy that sells index options and buys options on the individual stocks inside that index, betting the components will move more independently than the index price implies. In practice you go short index volatility (short SPX straddles or variance) and long single-stock volatility (long straddles or variance on the members), harvesting the persistent gap between what the index charges for vol and what its parts charge. The position is really a trade on implied correlation: it profits when realized correlation stays low and bleeds or breaks when everything crashes together.
What Is Dispersion Trading
Dispersion trading is the practice of being short index volatility and long the volatility of the index's individual constituents, in order to profit when single stocks move more than the index does. Index volatility is structurally cheaper than the average single-stock volatility because index moves are dampened by diversification: when one name rips higher and another sells off, they partly cancel at the index level. Options dealers price that dampening through an implied correlation number. When that implied correlation is rich (high), a dispersion book sells the expensive index vol, buys the relatively cheap basket of single-stock vol, and collects the spread as long as the stocks keep behaving like a crowd of individuals rather than a single herd.
The Mechanics: Index Vol vs the Sum of Its Parts
The whole trade rests on one identity. Index variance is not the average of single-stock variances. It is the weighted sum of single-stock variances scaled down by how correlated the names are. Approximately:
sigma_index^2 = rho (sum of w_i sigma_i)^2
where sigma_index is index volatility, w_i and sigma_i are each stock's index weight and volatility, and rho is the average pairwise correlation. Rearranging gives the number dealers actually quote, implied correlation:
rho_implied = sigma_index^2 / (sum of w_i * sigma_i)^2
That single ratio is the price of the trade. Because rho is bounded below (stocks are never perfectly independent) and above at 1 (a full crash), the index can never be more volatile than its weighted parts and rarely much less than a floor. A dispersion trade is short that rho: you sell index straddles or index variance, buy a weighted basket of single-stock straddles or variance, and delta-hedge both legs. The payoff at expiry is proportional to (realized single-stock variance) minus (realized index variance), which mechanically resolves to a bet that realized correlation lands below the implied correlation you sold. Low realized correlation, meaning stocks dispersing around the index, pays you. High realized correlation, meaning everything moving in lockstep, is the loss.
A Worked Example
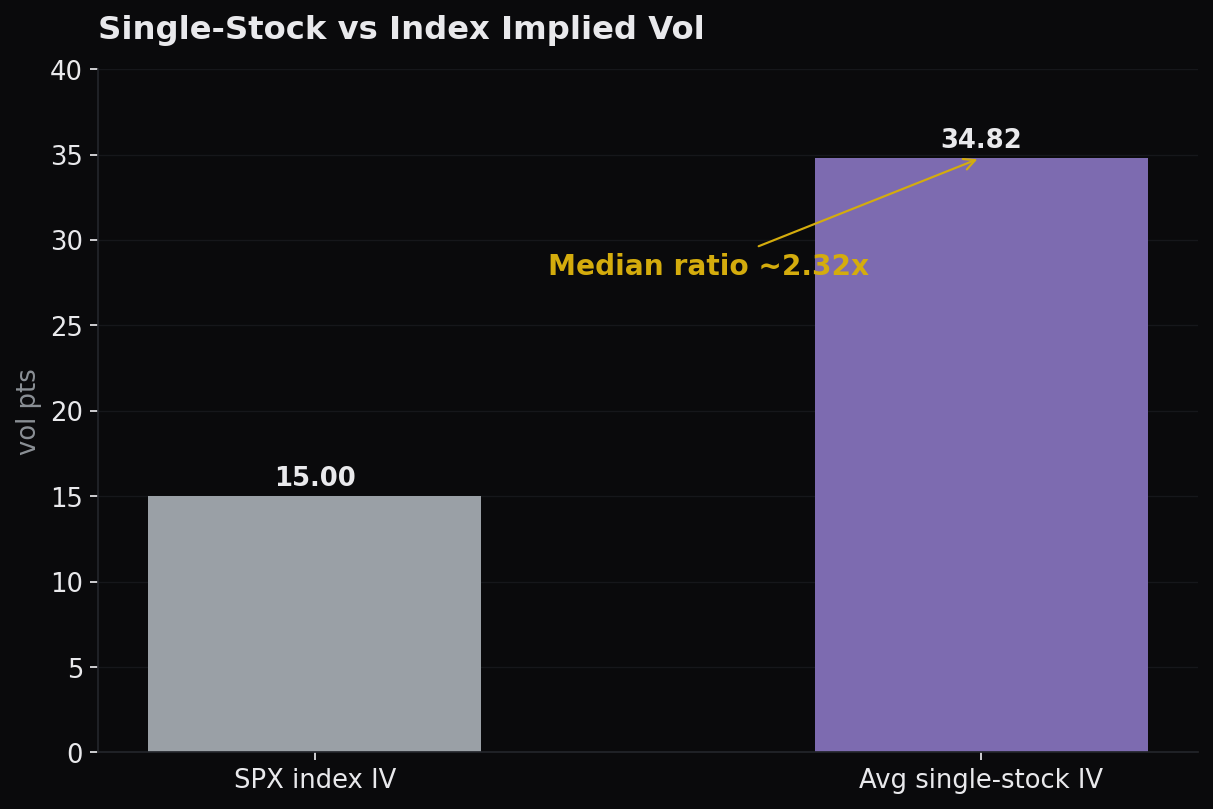
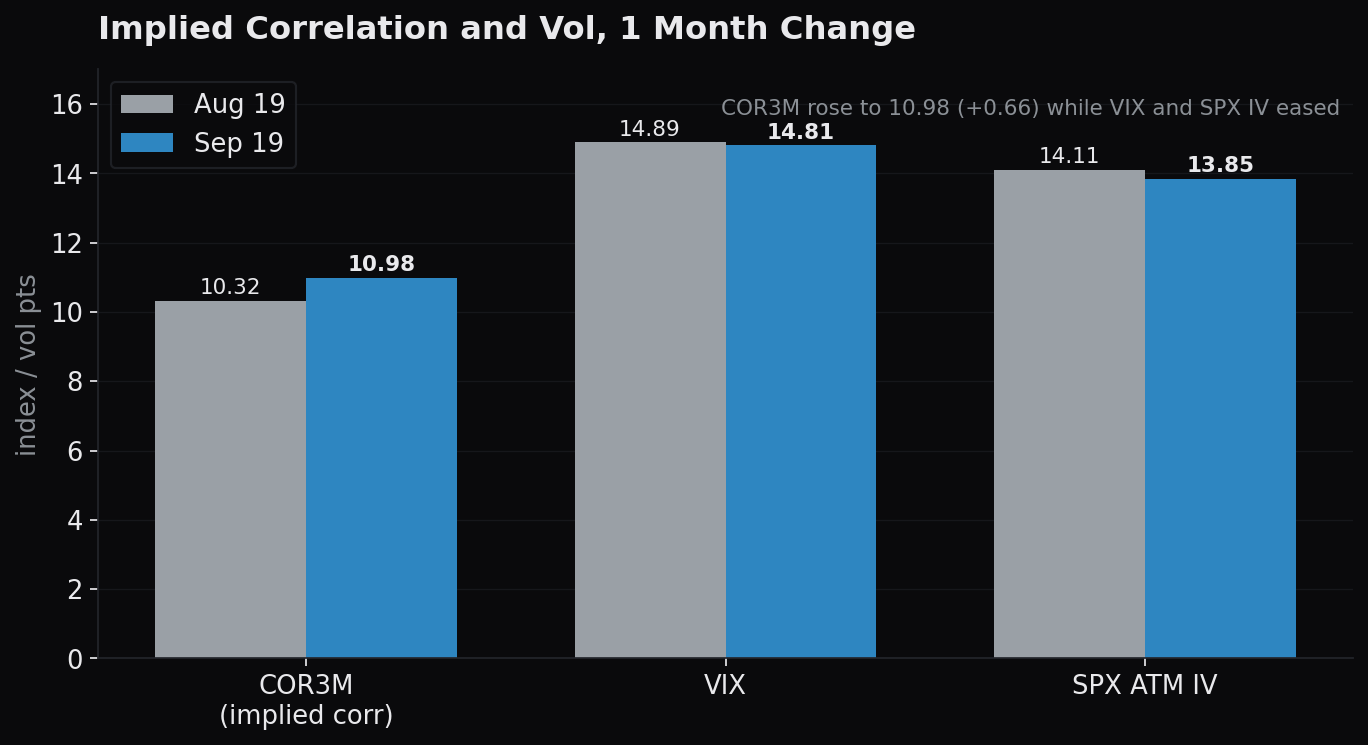
Take current numbers. SPX at-the-money implied volatility sits near 13.85. The average single-stock implied vol across the large members is about 34.82. The median single-stock to index IV ratio is roughly 2.32x, meaning the typical name carries more than double the index's vol. Three-month implied correlation, the COR3M index, reads about 10.98.
Plug that into the identity. If the weighted basket of single-stock vol is around 34.82 and the index is 13.85, the implied correlation is (13.85 / 34.82)^2, which is about 0.158, in the same low neighborhood as the quoted COR3M near 11 (the exact figure depends on weighting and which basket you use). The point is that implied correlation is sitting near the bottom of its historical range, roughly 10 to 15, versus a long-run center closer to 30 to 40 and crisis prints above 70.
Here is where the edge and the risk sit. Selling index vol at 13.85 and buying single-stock vol averaging 34.82 looks like you are paying up for the long leg, but you are buying it in a world where the index has already priced correlation at rock bottom. The edge is carry and convexity: if stocks keep dispersing (earnings, idiosyncratic single-name moves, sector rotation), realized single-stock variance overwhelms realized index variance and the book prints. The risk is that low COR3M means the market has already discounted a calm, uncorrelated regime. You are not being paid much to be short correlation. If correlation snaps from 11 back toward 40, the short index leg detonates faster than the long single-stock legs can compensate, because in a crash single-stock vols rise but index vol rises more as rho races to 1.
Why It Matters: The Correlation Tail
Every dispersion book is short one specific thing: a correlated crash. In normal conditions stocks disperse, the index is the calm weighted average of noisy parts, and the short-index, long-single-stock structure earns steadily. The kill is a systematic shock. In a real risk-off event, correlation does not drift, it gaps. Names that were trading on their own earnings suddenly trade on one macro factor: rates, liquidity, or a growth scare. Realized correlation spikes toward 1, index volatility explodes, and the short index straddle you sold at a 13.85 vol reprices violently, while the long single-stock legs, though also up, cannot keep pace because they were never the cheap leg. The convexity is against you exactly when liquidity is worst.
This matters more now because the old shock absorber is unreliable. The equity-bond hedge, the assumption that Treasuries rally when stocks fall, broke down repeatedly across the 2022 to 2025 inflation regime, when bonds and equities sold off together. When bonds stop cushioning equity drawdowns, cross-asset correlation and within-equity correlation both climb, and dispersion sellers lose their natural offset. Cheap implied correlation near 11 is attractive precisely because it is cheap, but cheap correlation is also the market telling you it sees no systematic risk, which is the setup where a surprise correlation spike does the most damage. Size the short-correlation exposure to survive rho going to 1, not to the calm you see today.
Related CrossVol Research
For a live case study of correlation regimes bleeding across markets, read Dispersion and the OAT-Bund Channel, which walks through how sovereign spread stress transmits into equity correlation and why the dispersion book is really a cross-asset correlation position. To see where dealer positioning amplifies the index moves that punish a short-index leg, study the live dealer gamma exposure (GEX) map, which shows the gamma pins and flip levels that govern how violently index volatility can accelerate in a selloff.
FAQ
What is dispersion trading? Dispersion trading is a volatility strategy that sells index options and buys options on the index's individual stocks. It profits when single stocks move more independently than the index implies, meaning realized correlation stays low. Structurally it is a short position on implied correlation harvested through variance or straddles.
How do you trade dispersion? You sell index volatility (SPX straddles or variance swaps) and buy a weighted basket of single-stock volatility on the members, then delta-hedge both legs. The weights and vol-notionals are set so the net position is close to correlation-neutral at inception, isolating your bet that realized correlation lands below implied.
Is dispersion trading profitable? It carries positively most of the time because index vol is persistently cheaper than average single-stock vol, so the book earns steadily in calm, dispersed markets. But profitability is regime-dependent. Years of quiet gains can be erased in one correlated crash, so risk-adjusted returns depend entirely on sizing and tail hedging.
What kills a dispersion trade? A correlated crash kills it. When a systematic shock hits, realized correlation gaps toward 1, index volatility explodes, and the short index leg reprices far faster than the long single-stock legs can offset. Entering when implied correlation is already near record lows, around 11, magnifies that tail risk.
Djellal Djouad
Further reading
🔥