


By Djellal Djouad
On Wednesday, September 23, the Treasury market delivered the kind of move that usually shows up everywhere at once. The 10 year yield rose 15.9 basis points to 5.125%, which Bloomberg puts at a 3.39 sigma day against its own 30 day realized volatility. The 5 year rose 17.2 basis points. Brent traded above $102, Fed Governor Barr signaled that further tightening is likely needed, and equities reversed lower. Stocks and bonds sold off together. The VIX rose 0.75 to 14.96. That last number is the story. Index volatility registered the shock the way a sleeping market registers a noise, with a flinch, and the reason it can afford to stay that calm is the same reason the calm is fragile. Implied correlation across the S&P 500 sits near its lows, large cap single stocks have become about as volatile as small caps, dealers were last reported short vega on the downside, and the bond hedge that would normally cushion an equity drawdown has not worked since March. This note walks through the equity vol complex first, then the correlation channel that connects it to today's rates shock, and ends with a one page risk map.
The VIX Rose, Quietly
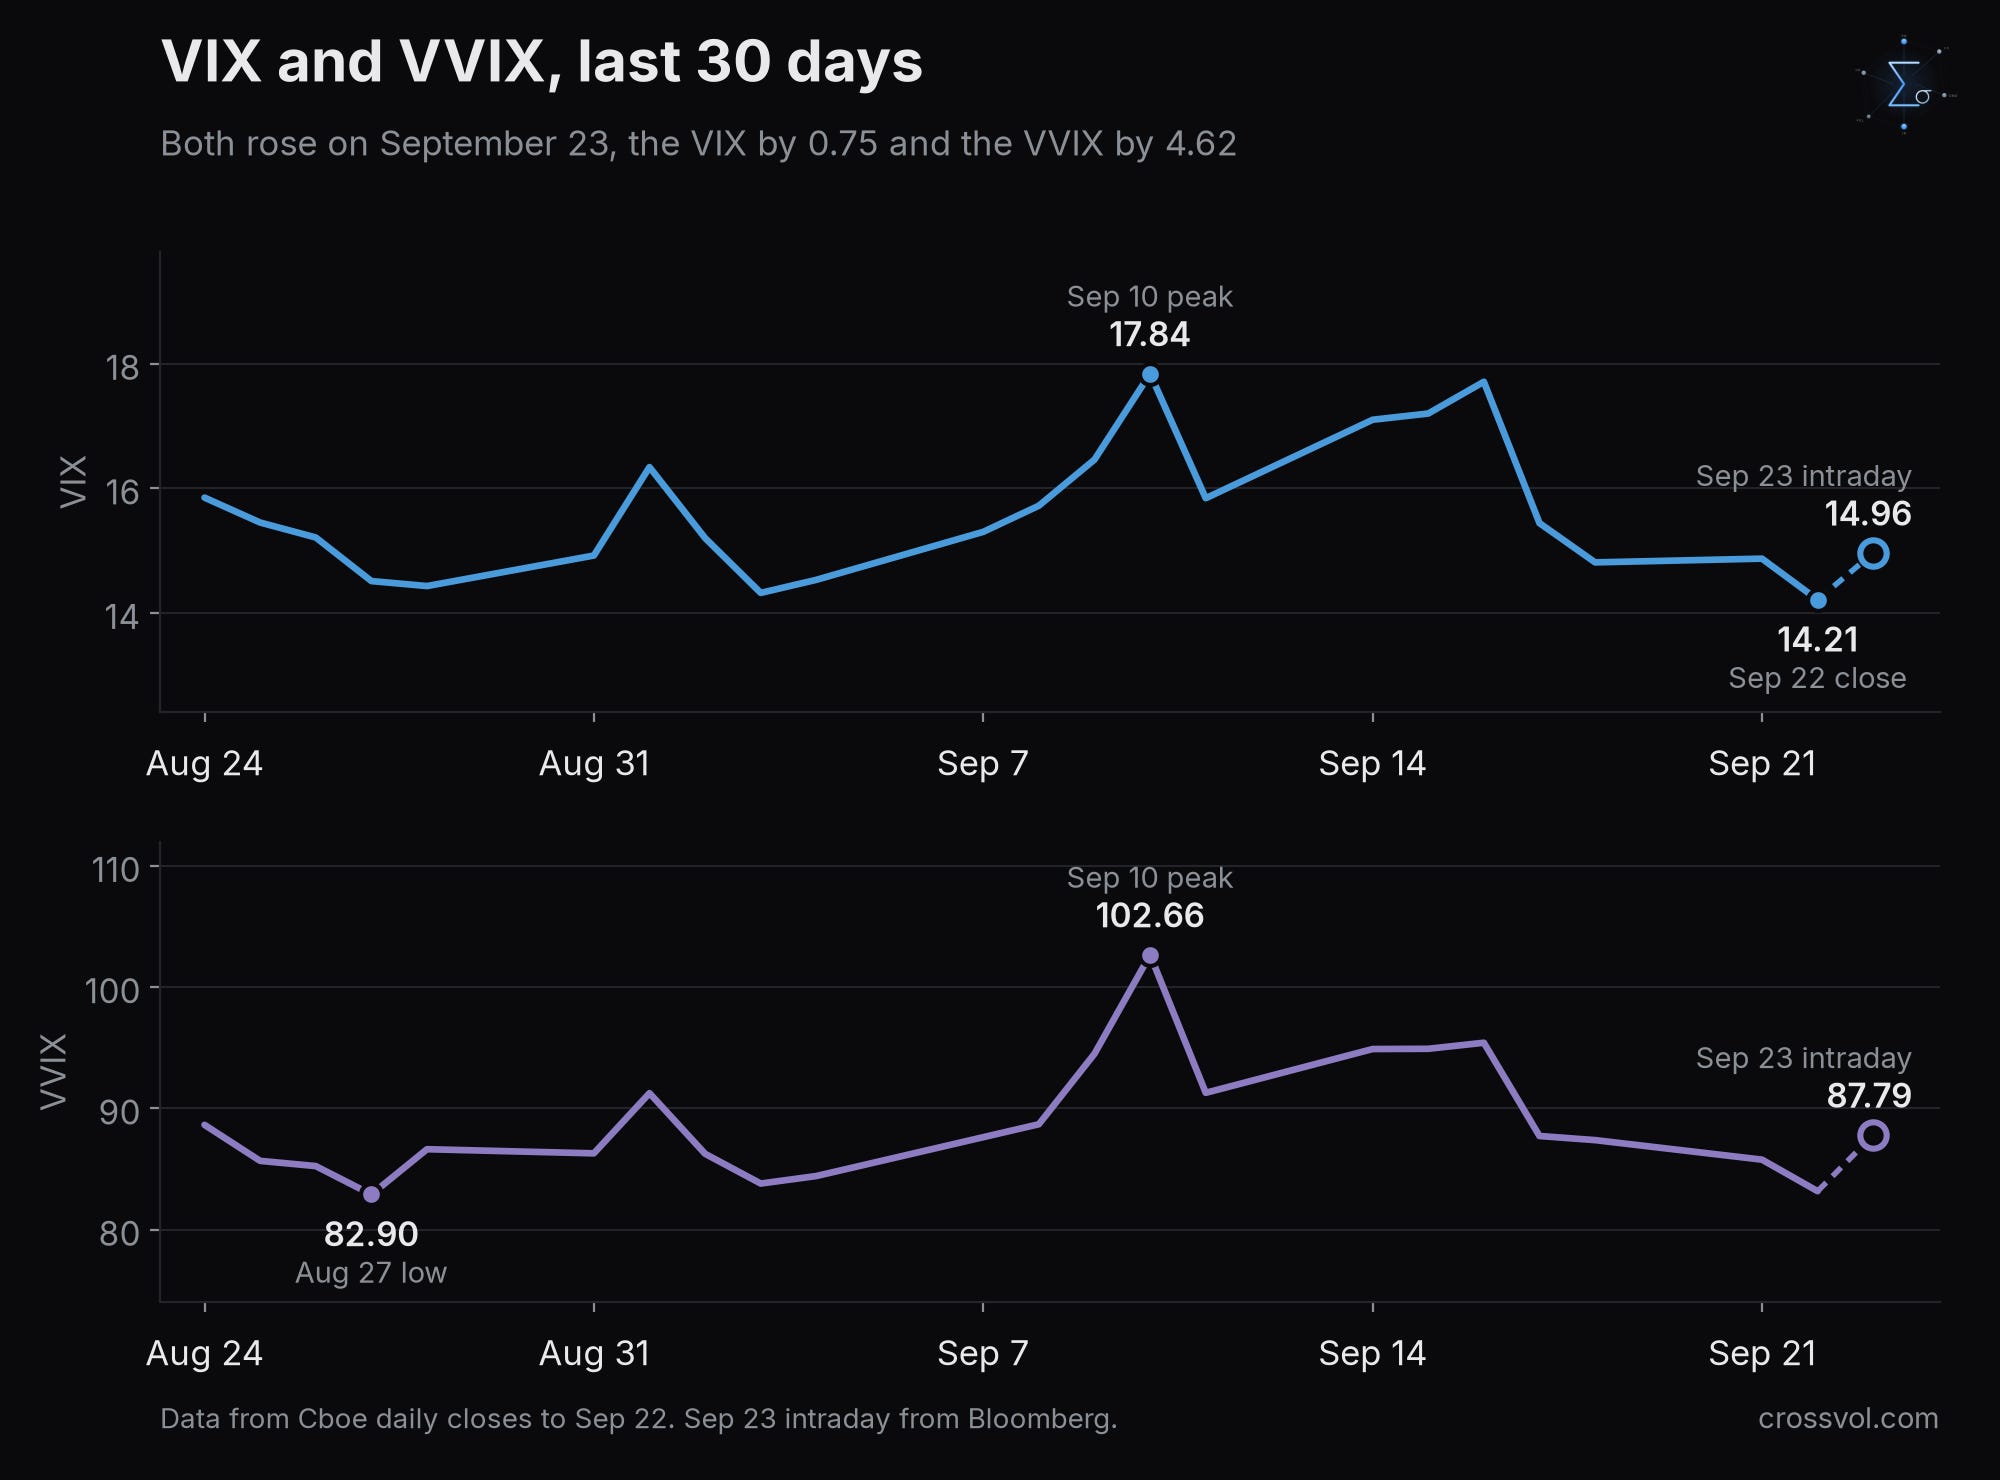
The move in spot VIX needs to be read against where it came from. The index peaked at 17.84 on September 10, its highest close since late July, printed 17.71 on September 16 and then collapsed. It lost 3.50 points in four sessions to close at 14.21 on Tuesday, September 22, about two thirds of it on Thursday, September 17, the day before the September 18 triple witching expiry. Today it rose to 14.96, up 0.75, or a little over 5%. For a three standard deviation day in the 10 year, that is a muted response, but it is about what the VIX usually does when the S&P 500 slips by less than 1%, which is all stocks have given up so far. Index vol is tracking spot, and it is the equity market that has barely priced the rates shock. The rest of the complex explains why that can change quickly.
The VVIX, the implied volatility of the VIX itself, rose from 83.17 to 87.79, in step with spot. The more telling number is where it started. The VVIX peaked at 102.66 on September 10 alongside the VIX, then fell to 83.17 on Tuesday, only 0.27 above its August low of 82.90, set on August 27, and its third lowest close of the past year. Protection on the VIX itself is cheap by the standards of the past year, which fits a market that is calm on the surface. Vol of vol often turns before spot vol at inflection points, so the level to watch is the floor near 83. A VVIX that keeps climbing from here would be the options market saying it no longer trusts the calm.
Tail Demand Is Still There
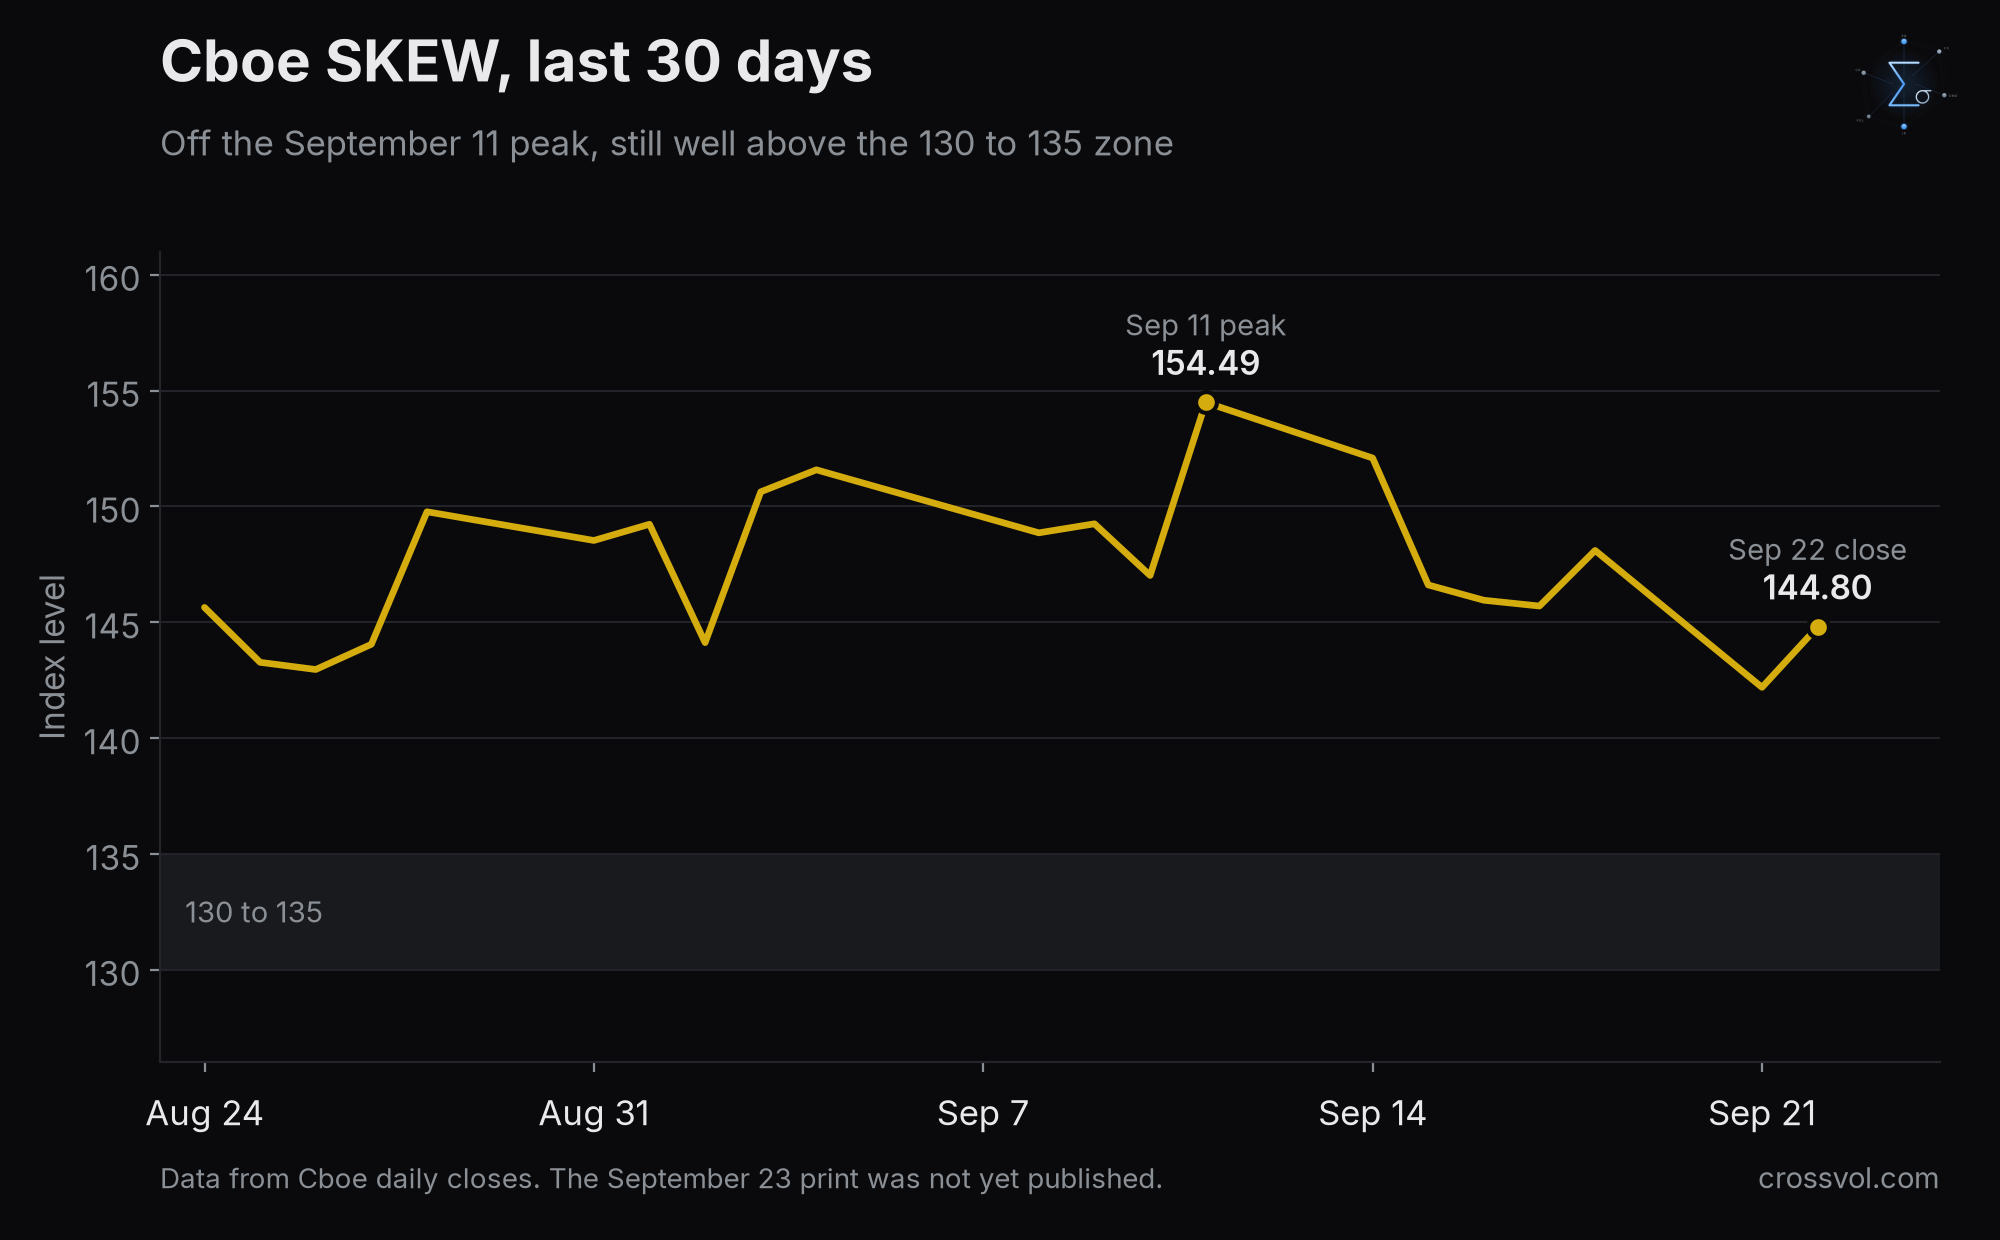
SKEW closed at 144.80 on September 22, and the September 23 print was not yet published at the time of writing. It peaked at 154.49 on September 11, its highest close since early July, and has since fallen back to about its median of the past year, near 144. That is still well above the 130 to 135 area that would describe a relaxed tail market, and SKEW was at or below 135 on five sessions in August. A SKEW in the mid 140s means the market is still paying up for deep out of the money puts relative to at the money options. Put that next to a VIX that spent the previous week falling and you get the familiar signature of complacency in the at the money strip with residual fear in the wings.
The Curve Is Steep, and the Front End Just Moved
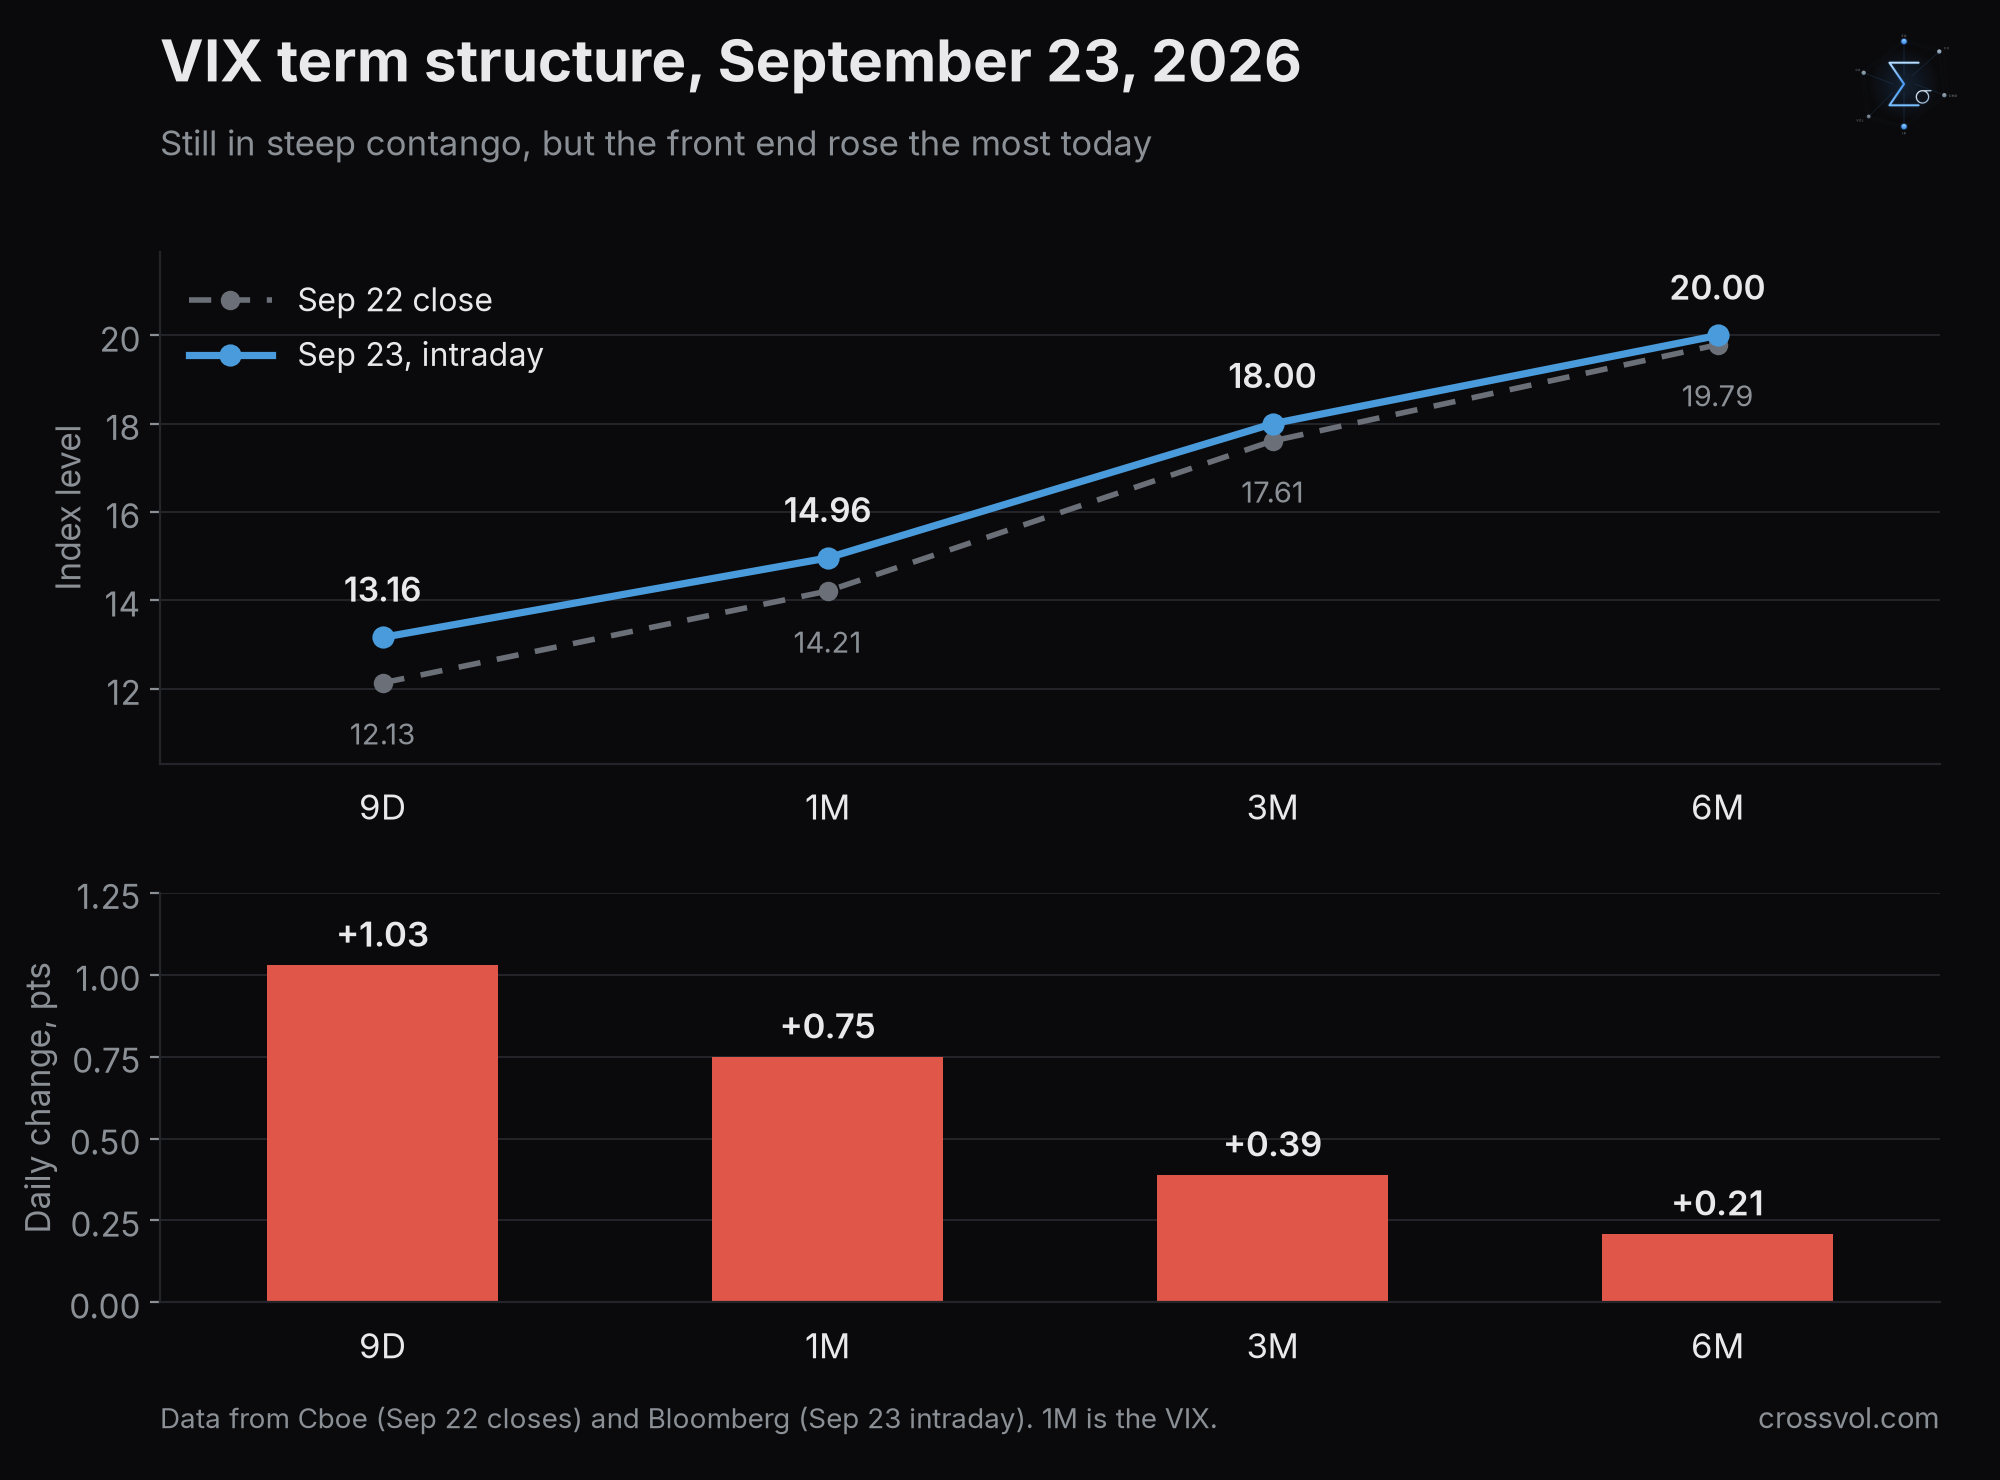
The VIX term structure is in steep contango. On Bloomberg's intraday prints, the 9 day VIX sits at 13.16, the 30 day VIX at 14.96, the 3 month at 18.00 and the 6 month at 20.00, a spread of 6.84 points from 9 days to 6 months. Near dated implied volatility collapsed into the expiry, with the 9 day VIX down 4.01 points on September 17 alone, while the 6 month index, at 20, sits near its lowest level of the past year and right on its median since 2012. The curve is steep because the front end is depressed.
The detail that matters today is how the curve moved. At Tuesday's close the same four points stood at 12.13, 14.21, 17.61 and 19.79. The 9 day rose 1.03, the VIX 0.75, the 3 month 0.39 and the 6 month 0.21, and the spread from 9 days to 6 months narrowed from 7.66 to 6.84 points in a single session. Contango is still steep. The front end rises the most on almost every day the VIX rises, so the flattening on its own is ordinary. The confirmation of stress would be a 9 day VIX trading above the 30 day, which last happened on September 15.
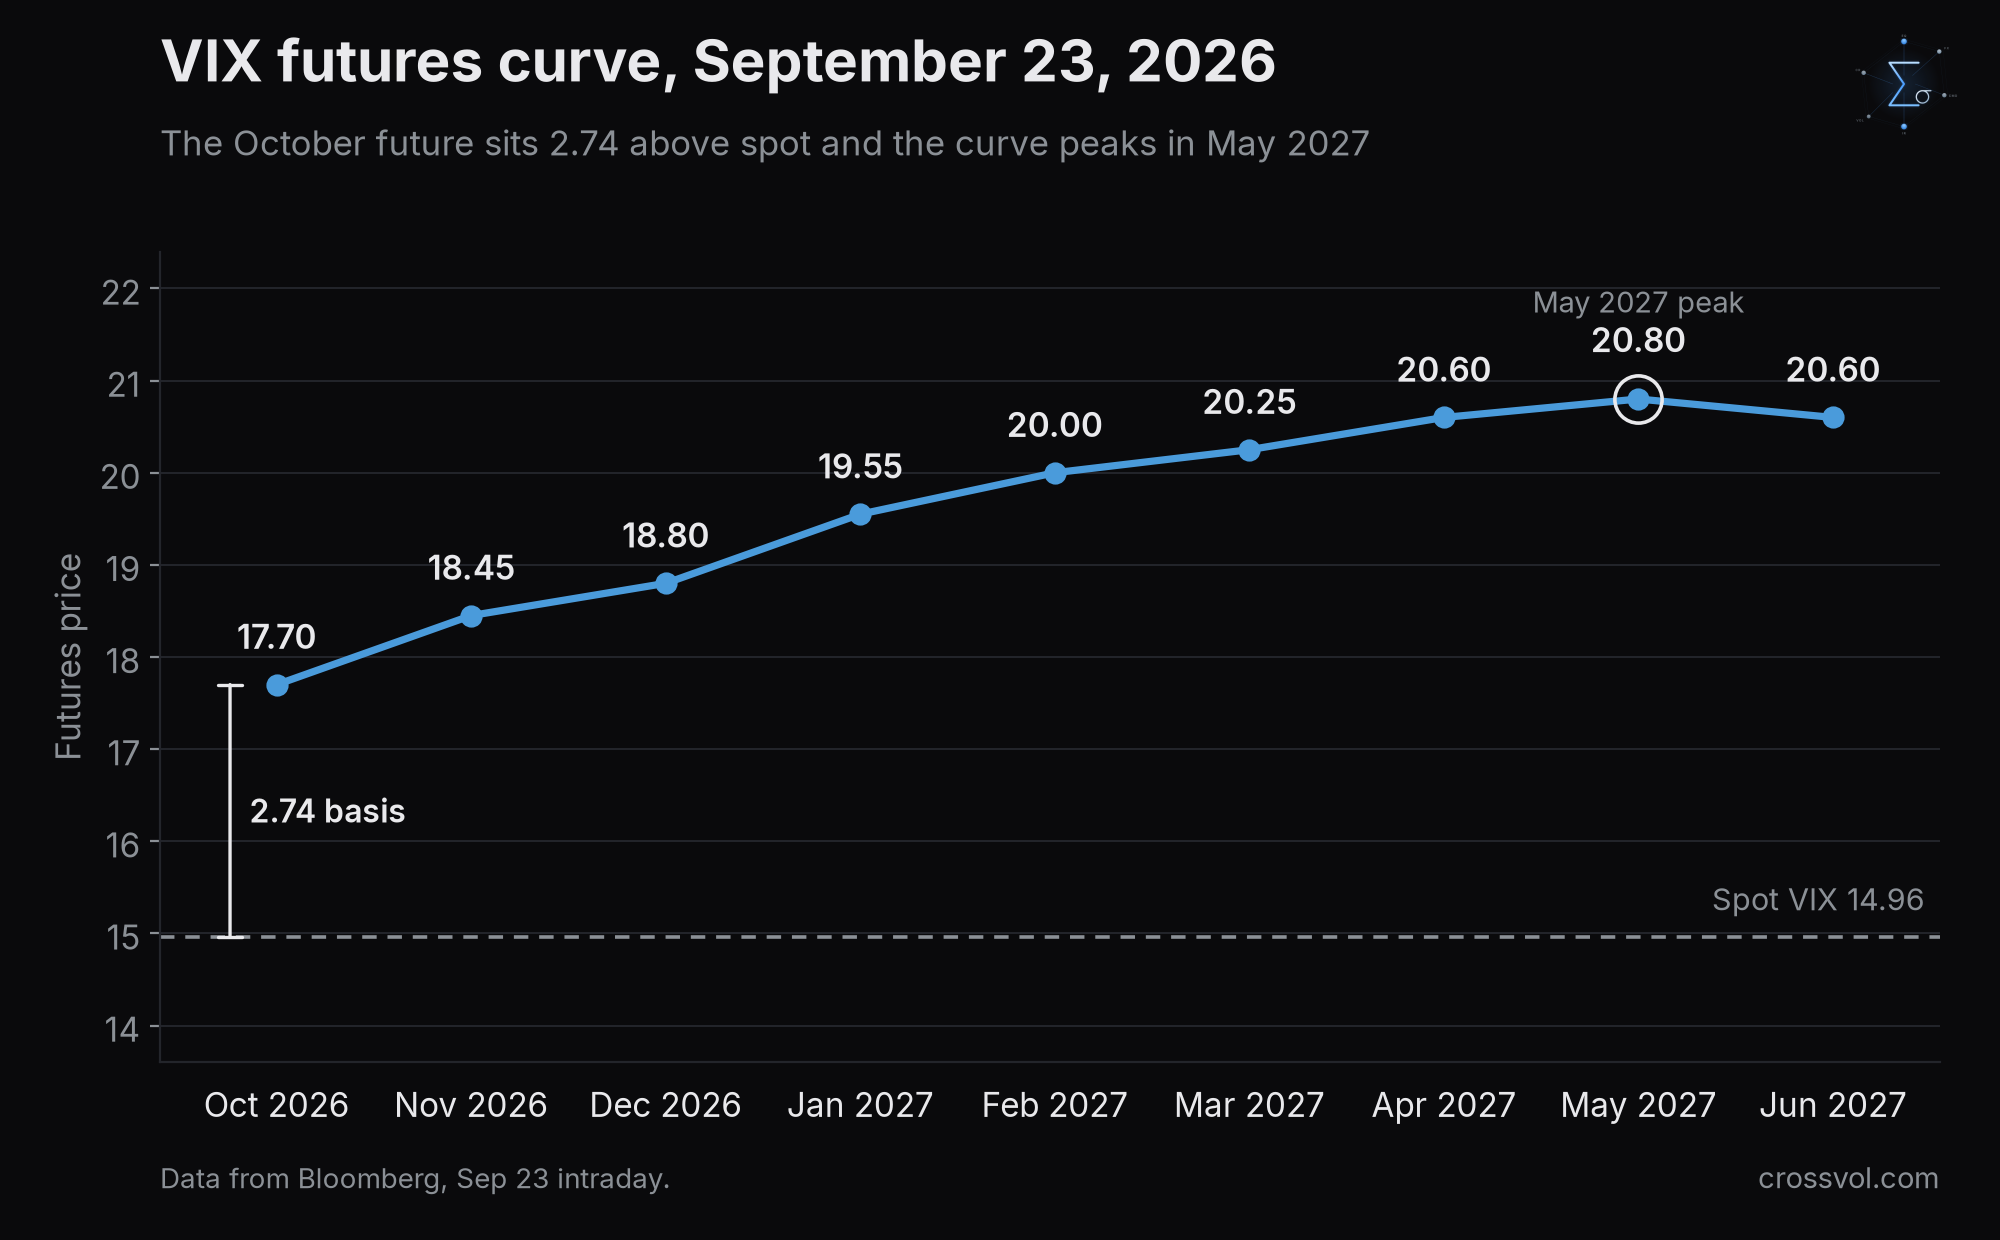
The futures curve puts a price on the same shape. The October contract trades at 17.70 against spot at 14.96, a basis of 2.74 points. November is at 18.45, December 18.80, January 19.55, February 20.00, March 20.25, April 20.60 and May 20.80, the high of the curve, before June dips back to 20.60. The back months sit within about a point of each other, so the 0.20 dip from May to June says little about when uncertainty peaks. The basis has two readings. For anyone long volatility through futures, it is a steep carry cost, since the October contract converges to wherever the VIX sits at its October 21 expiry. For anyone short volatility through futures, it is income, collected in exchange for exposure to exactly the kind of spike that a rates shock can trigger. Either way, the basis is mostly the premium the market charges for owning volatility, plus event risk. The October contract settles on 30 day implied volatility from October 21, a window that includes the November 3 midterm elections.
Dealers Were Short the Wrong Kind of Vega
The positioning picture makes the calm more fragile. In late August, UBS derivatives strategists noted that record buying of S&P 500 index options had left dealers short net vega, particularly on the downside, and described the vanna profile, the rate at which dealers get shorter vega as spot falls, as historically high. In that configuration a selloff forces dealers to buy volatility to rebalance, and they buy it into a rising VIX. The hedging flow amplifies the move it is responding to.
Three things add to that fragility. First, the September 18 triple witching expiry, one of the largest on record at an estimated $7 trillion of notional according to Citadel Securities, removed a large block of the gamma that had been dampening realized moves. With that cushion gone, the index is more directionally sensitive. The UBS read predates that expiry, so some of the short vega it described may have rolled off with it. Second, the leveraged and inverse single stock ETF complex keeps growing, with Jane Street now providing about $1.2 billion of notional swaps to roughly 75 such products according to Bloomberg, which adds a structural source of forced delta and vega hedging. Third, banks have reportedly been offloading their exposure to those products through exotic crash puts, which moves the tail risk around the system without removing it.
What Barclays Saw, and What the Index Shows
On September 22, Barclays flagged that the traditional volatility discount of large cap stocks against small caps, historically about 10 points, has effectively disappeared. The observation is about single stocks. Large cap names are now about as volatile as small cap names, which removes the low volatility edge that made large caps the calm part of the market.
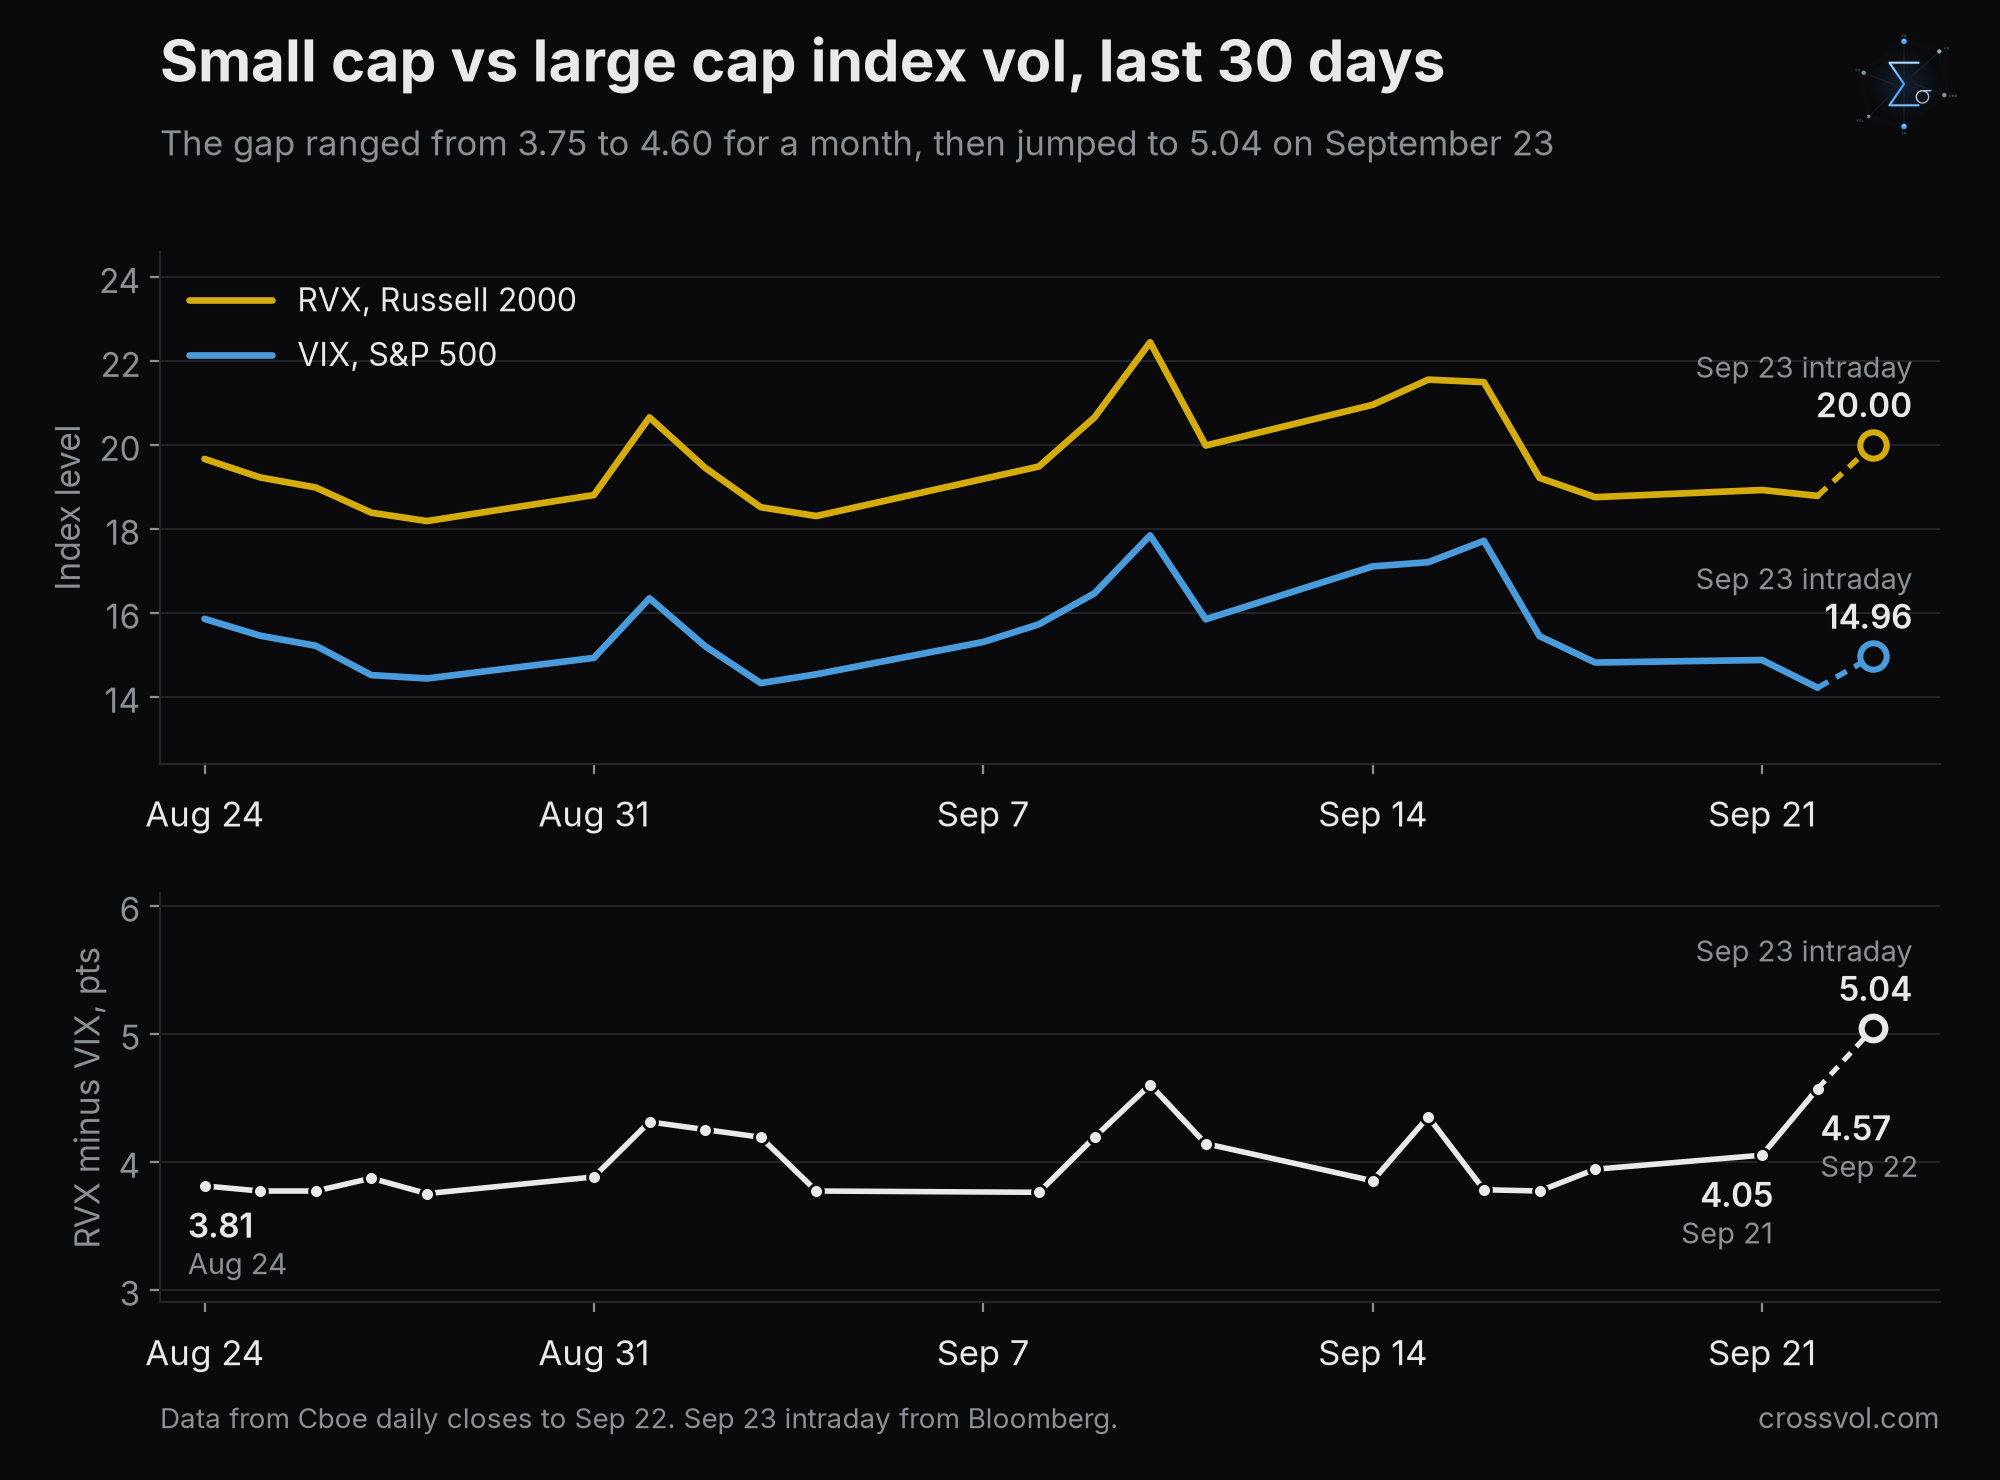
It is tempting to read that straight into the indices, and over the past month the index data says something different. The RVX, the Russell 2000 volatility index, stands at 20.00 against a VIX of 14.96, a gap of 5.04 points. On August 24 the same gap was 3.81, with the RVX at 19.66 and the VIX at 15.85. At the index level the small cap premium has widened over the past month, after shrinking over the summer from an average of about 6.3 points in May and June to 3.7 in August, which is the direction Barclays describes. Today's 5.04 is back near its median since 2015 of about 4.8. The gap moved between 3.75 and 4.60 over the past month and was 4.05 on September 21. It then jumped to 4.57 on September 22, a day the VIX fell, and to 5.04 today, with small cap volatility leading today's rise, the RVX up 1.22 against 0.75 for the VIX.
The two observations fit together once you add correlation. If large cap single stocks are as volatile as small caps while the S&P 500 index stays calm, the only thing reconciling the two is that those stocks are moving independently of each other. The diversification inside the index is doing all the work. That is the condition Bloomberg Intelligence flagged on September 8, when it warned that historically low stock correlation was suppressing index volatility and that the VIX may be understating true risk.
Correlation Is the Variable
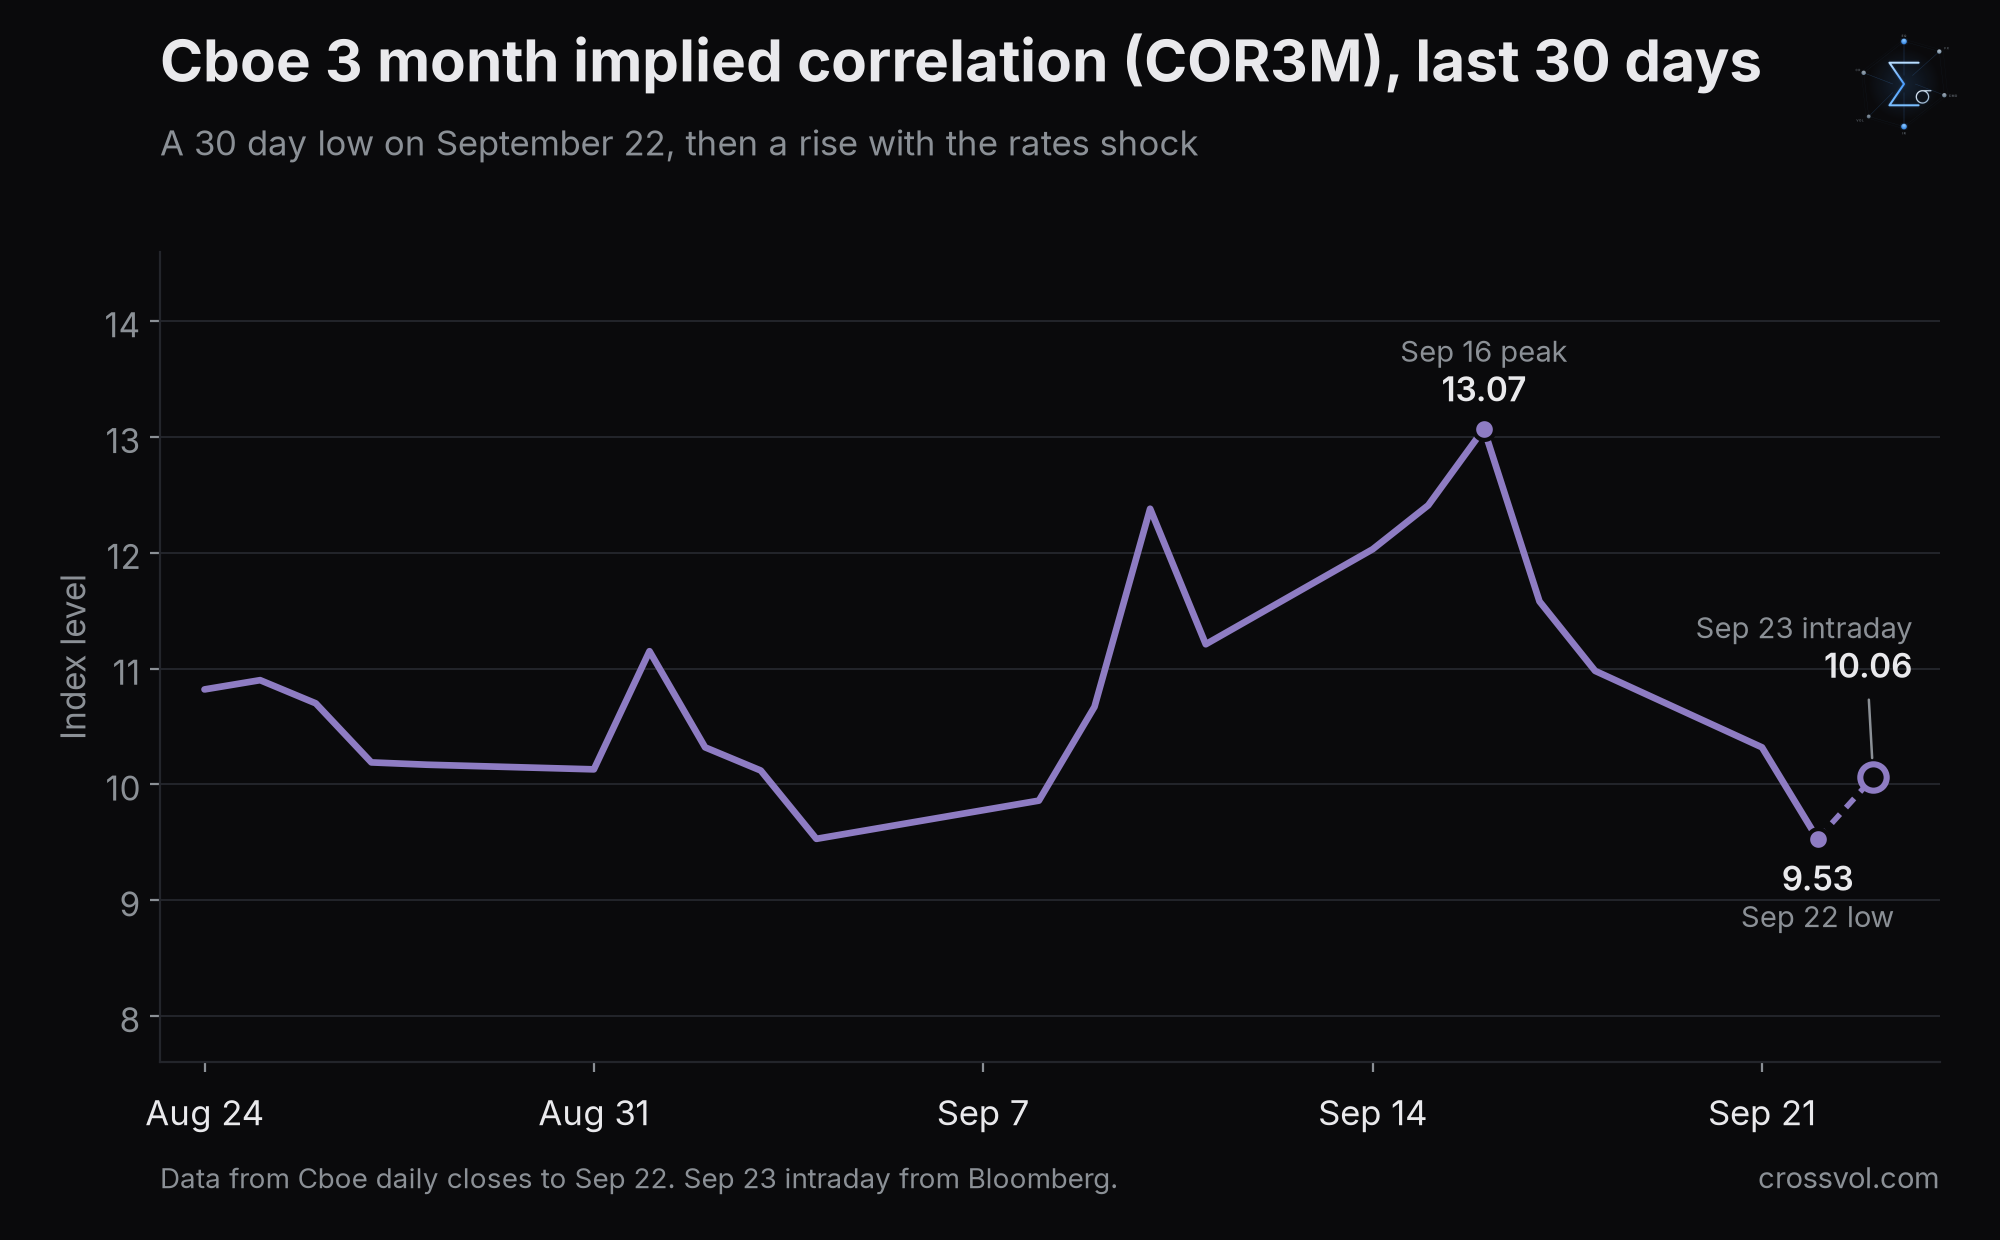
The Cboe 3 month implied correlation index, COR3M, closed at 9.53 on September 22, matching its 30 day low from September 4, after peaking at 13.07 on September 16. Today it trades at 10.06, which is an implied correlation of about 0.10. To a first approximation, index implied volatility is the average single stock volatility scaled by the square root of average correlation. Hold single stock volatility fixed and correlation becomes the main lever on the VIX. COR3M is a 3 month measure, so its natural partner is the 3 month VIX, at 18.00 today. With COR3M near 10, the market is pricing constituent moves as largely offsetting, and index volatility reflects a diversified portfolio. The stress inside the names stays hidden.
The transmission from here is mechanical. Large cap single stocks are already about as volatile as small caps, according to Barclays. Low correlation hides it, because the index nets the moves out. A macro shock that hits every sector at once pushes correlation toward one, and a rates move like today's is the textbook case. The VIX then has to reprice toward the volatility of its constituents, and dealers who are still short vega on the downside have to buy that repricing. Today's rise in COR3M, off a 30 day low on the day of a 3.39 sigma rates move, is what the first step of that sequence looks like. One day does not make a regime, but this is the variable to watch.
A 3.39 Sigma Day in Treasuries
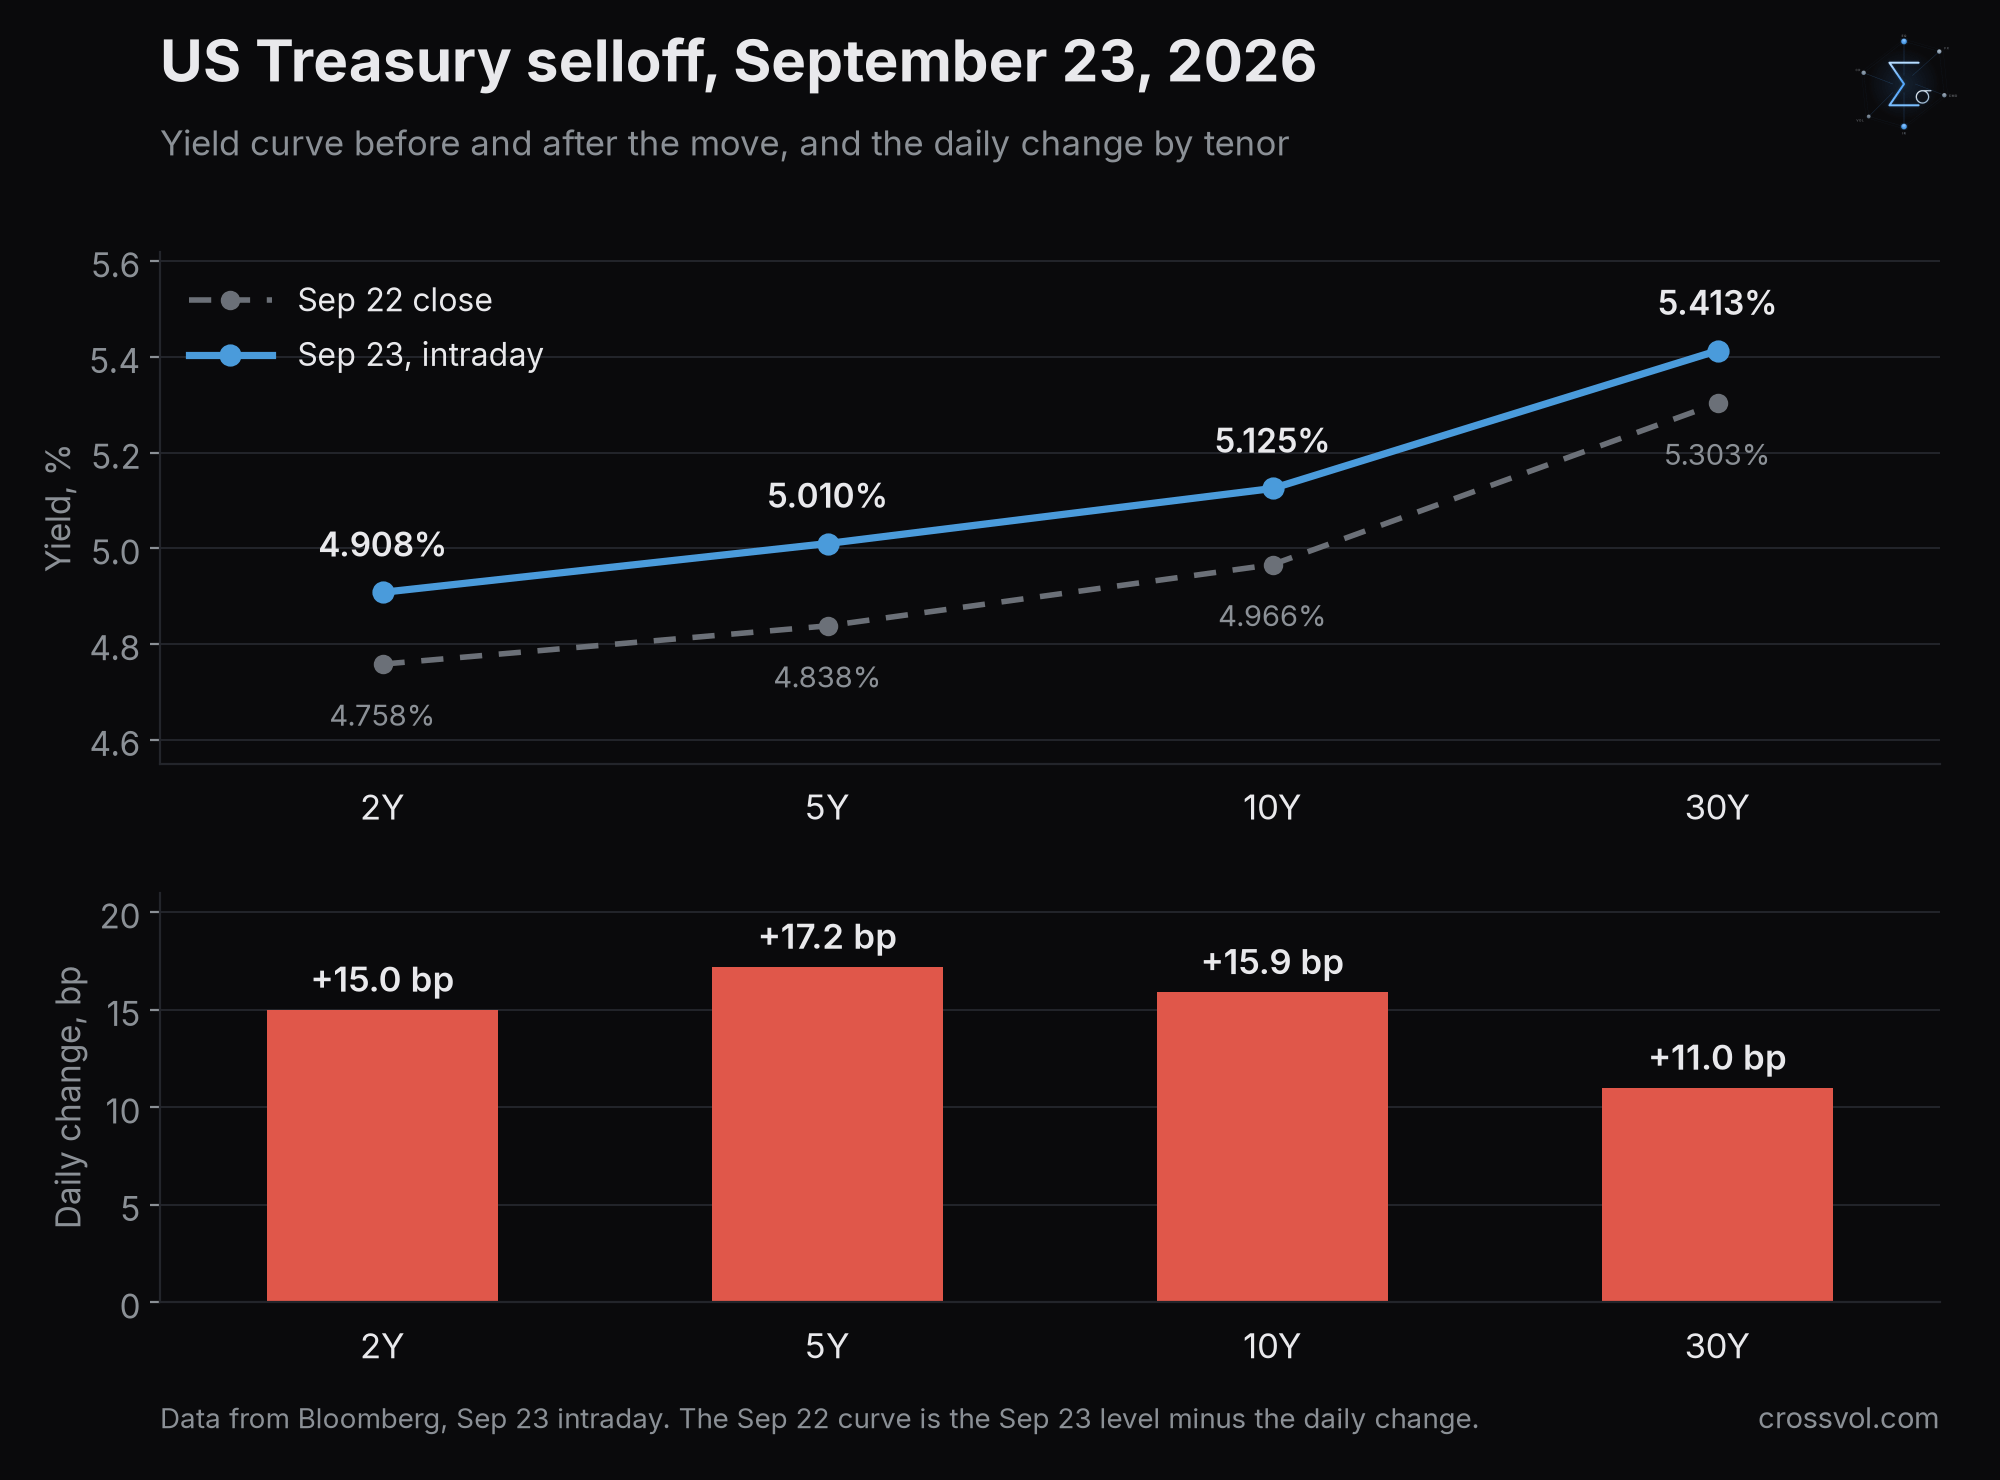
The Treasury selloff is the macro catalyst that tests the correlation regime. The 2 year yield rose 15 basis points to 4.908%. The 5 year rose 17.2 to 5.010%, the largest of the four benchmark tenors. The 10 year rose 15.9 to 5.125%, and the 30 year rose 11 to 5.413%. Over the past 30 days the 10 year has realized 4.70 basis points a day, or 75.8 annualized, and Bloomberg puts today's move at 3.39 sigma. Under a normal distribution, a daily move that large happens less than 0.1% of the time. That sigma figure is specific to the 10 year and its own realized volatility, since each tenor has its own.
The belly led. The 5 year moved the most, consistent with a market repricing the path of Fed policy after Governor Barr's comments and a strong PMI. The shape of the curve moved with it. The spread between the 5 year and the 30 year flattened by 6.2 basis points, and the 2s5s10s butterfly cheapened the belly by 3.5 basis points. This is a policy repricing concentrated where the Fed path lives, and it is exactly the kind of shock that reaches every equity sector through the discount rate at the same time.
Stocks and Bonds Are Moving Together
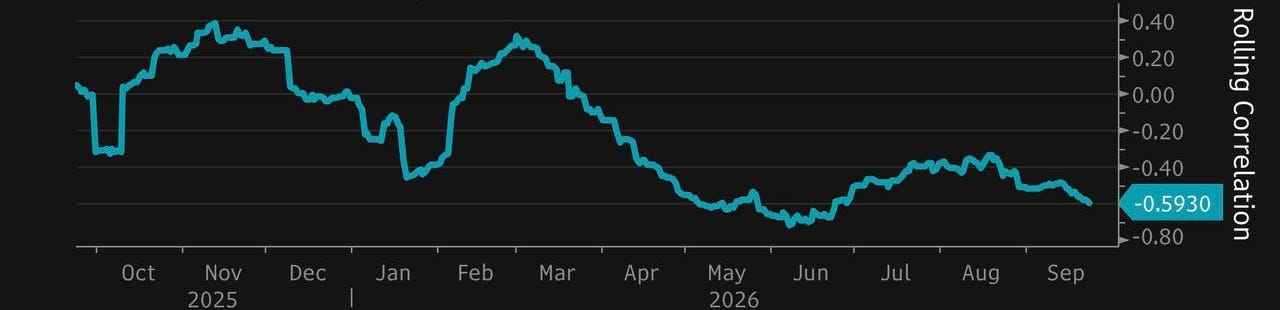
The 60 day rolling correlation between daily S&P 500 returns and daily changes in the 10 year yield stands at -0.593, about 2.7 times its one year average of -0.217. The sign matters, and it is easy to read backward. The series correlates stock returns with yield changes. A negative number means stocks fall when yields rise, and since bond prices fall when yields rise, stocks and bonds tend to move together, gaining and losing on the same days. That is the regime in which Treasuries stop hedging equities.
On the chart, the correlation crossed below zero in mid March and has stayed there for six months, with its most negative reading, -0.720, in early June. The positive stretches of the past year, from October to early December 2025 and from February to mid March 2026, were the periods when the bond hedge worked. Today's joint selloff, with stocks lower and yields up 15 to 17 basis points from the 2 year to the 10 year, is that regime expressing itself on a large day. The practical consequence is that the diversification benefit of a balanced stock and bond portfolio is weak right now, and cross asset vega exposure adds up.
Rates Volatility Has Room to Run
The MOVE index closed at 78.56 on September 22, with a 90 day z score of +0.88, above its recent average but well short of extreme, and down from a peak of 83.90 on September 14. That reading predates today's 3.39 sigma move. A day like today usually lifts implied rates volatility, and a MOVE heading back toward or through its September 14 peak while the VIX sits near 15 would be a dangerous combination. Rates volatility rising while equity volatility stays suppressed is the environment in which correlation resets tend to be most violent, because the equity market has yet to price the shock that the bond market is already trading.
The Small Cap Credit Channel
Barclays' factor research adds a fundamental layer. About 32% of Russell 2000 constituents are unprofitable, and leverage runs at 3.5 times net debt to EBITDA. With the 5 year Treasury at 5.01%, a sustained rate shock goes straight at the refinancing capacity of that part of the market. That is a credit channel that feeds back into equity volatility through earnings risk, and it is consistent with the RVX leading today's move.
The Risk Map
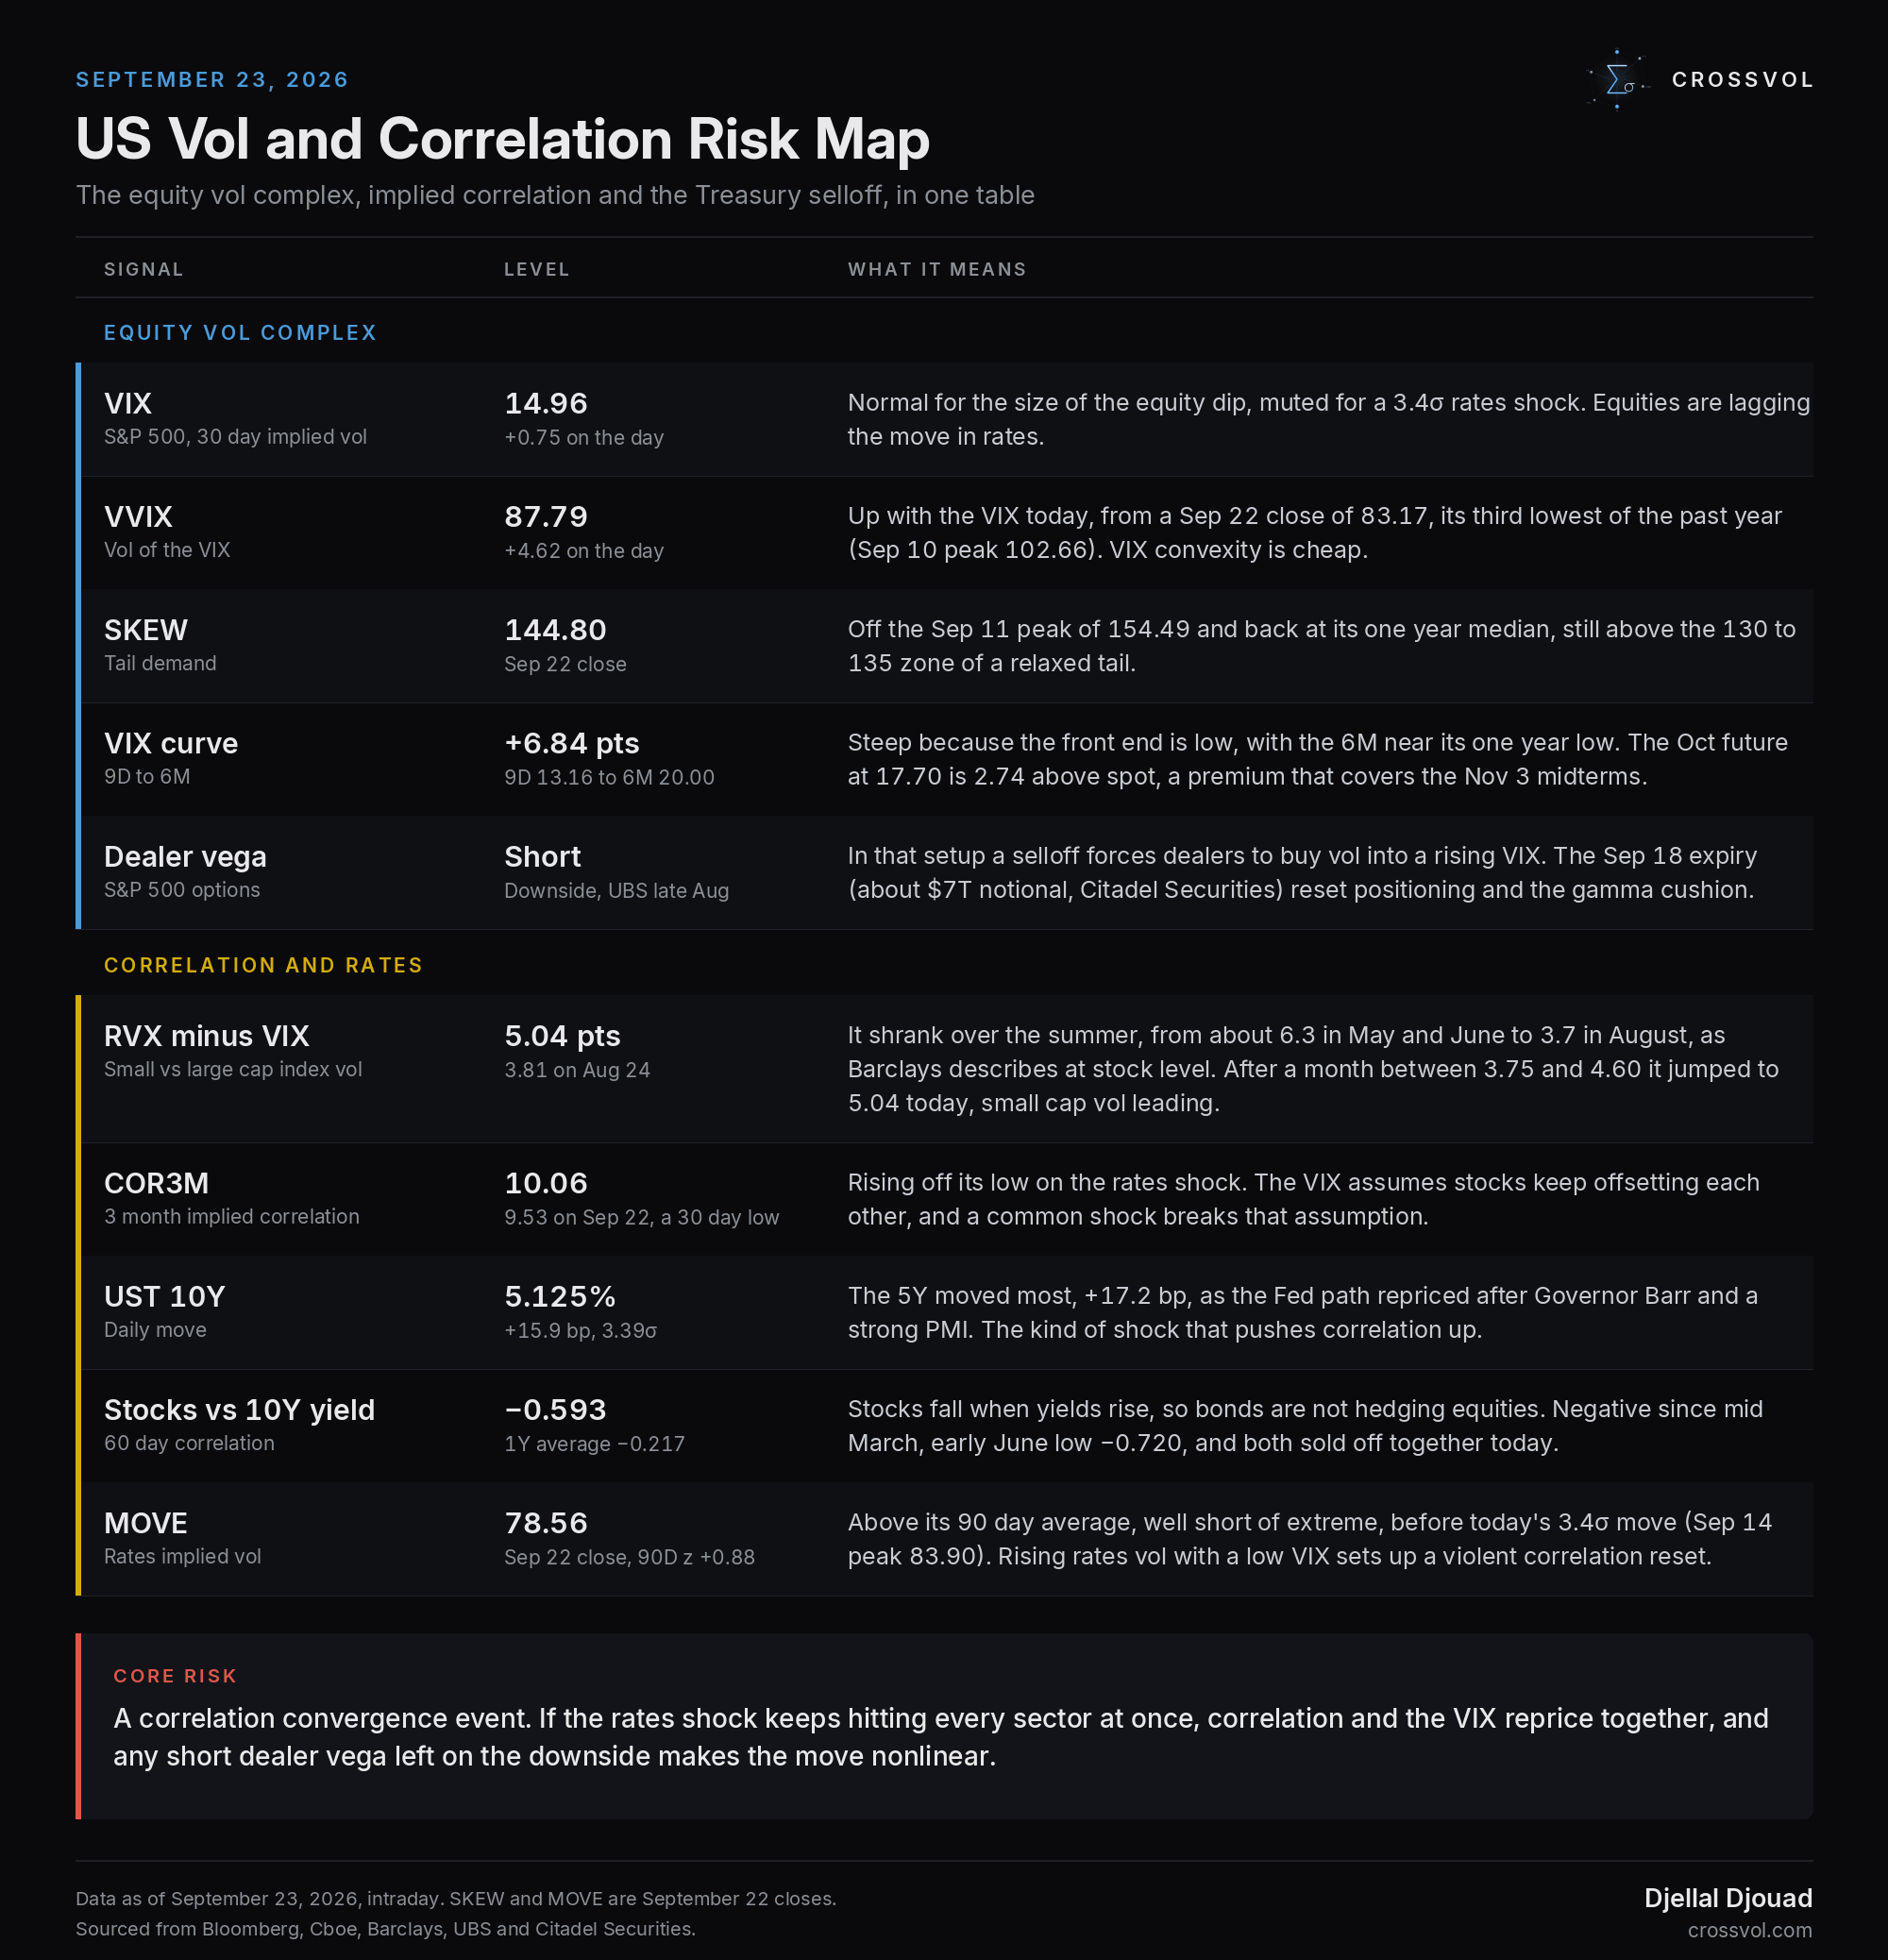
The picture is a fragile low volatility equilibrium. On the surface, the VIX is near 15 after falling 3.50 points in the four sessions to Tuesday. Underneath, protection on the VIX itself is cheap, with the VVIX near its lowest levels of the year. SKEW is back at its one year median but still above the relaxed zone. The VIX curve is steep because the front end is depressed. Dealers were short vega on the downside in UBS's late August read, and the expiry cushion is gone. Implied correlation is coming off its lows, rates volatility was already above its 90 day average before today's shock, and since March stocks and bonds have tended to move in the same direction, so Treasuries have stopped hedging equities. The core risk is a correlation convergence event. If the rates shock keeps hitting every sector at once, correlation and the VIX reprice together, and any short dealer vega left on the downside makes that move nonlinear.
Five signals are worth watching from here. The first is COR3M, and whether today's rise off the low continues. The second is the 9 day VIX against the 30 day, for a new inversion at the front of the curve. The third is the VVIX floor near 83. The fourth is the next MOVE prints, for whether rates volatility follows the 3.39 sigma day. The fifth is the correlation between stocks and the 10 year yield, because as long as it stays this negative, the usual hedge will not be there when the VIX finally catches up.
The CrossVol terminal tracks the VIX term structure, skew, implied correlation and the correlation between stocks and yields live, at crossvol.com for $99 a month.
Djellal Djouad
Related: The Crash Fuse Is Lit
Sources
Bloomberg News markets coverage of the Treasury selloff, oil and Fed commentary, September 23, 2026.
Bloomberg Intelligence on S&P 500 volatility and the risk of a correlation reset, September 8, 2026.
Bloomberg on large cap stocks losing their low volatility edge, citing Barclays, September 22, 2026.
Barclays Equity Factor Insights, September 2026, published September 14, 2026.
Bloomberg on dealer vega exposure and VIX upside, citing UBS derivatives strategists, August 25, 2026.
Bloomberg on Jane Street joining the swap dealers behind leveraged single stock ETFs, September 20, 2026.
Bloomberg on banks offloading leveraged ETF risk through exotic crash puts, August 2, 2026.
Citadel Securities estimate of the options notional expiring on September 18, 2026.
Cboe daily index history for VIX, VVIX, SKEW, VIX9D, VIX3M, VIX6M, RVX and COR3M.
Bloomberg data for the September 23 intraday prints, VIX futures, Treasury yields, the MOVE index and the correlation between S&P 500 returns and 10 year yield changes.
This note is for information only and is not investment advice.