


By Djellal Djouad. October 13, 2026.
Market commentary for educational purposes. This is not investment advice and not a recommendation to buy or sell anything. Levels are as of the dates and times given, markets move fast, and credit, equities and derivatives can lose far more than you expect.
The first scene of Act 4 played today, and it played in credit. At 13:22 New York time, CoreWeave's 9 5/8 percent senior notes due July 15, 2032 were quoted at 79.82, down 4.63 points on the day, for a yield of 14.96 percent, a Z spread of 1,021 basis points and an I spread of 1,027. Oracle's 6.85 percent bond of 2066 traded at a G spread of 300 basis points, the widest since it was issued in February. Oracle's five year CDS closed on Monday at 251.9 basis points, 3.7 times its level of a year ago. In Seoul, SK hynix closed down 10.09 percent and Samsung Electronics down 7.39 percent, with CXMT, a Chinese memory maker, claiming a denser DRAM cell.
In plain terms. Bond prices are quoted per 100 of face value, so CoreWeave's notes, sold at 100 in June, now trade near 80 cents on the dollar. The yield is the annual return a buyer earns at that price if the company pays every coupon and repays the principal at maturity. A spread is the extra yield a company pays over a benchmark: US Treasuries for the G spread, interest rate swaps for the I and Z spreads. It is measured in basis points, hundredths of a percentage point. A spread of 1,000 basis points means the market demands about 10 percentage points a year more from CoreWeave than from the benchmark. A credit default swap, or CDS, works like insurance against default. Oracle's five year CDS cost 251.9 basis points a year at Monday's close, about 2.5 percent of the amount insured each year, for five years of cover.
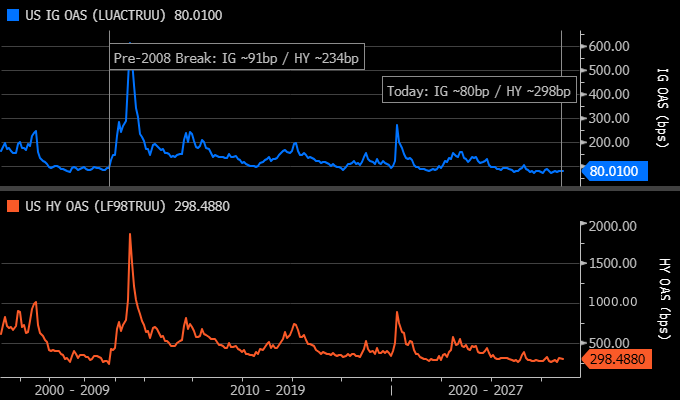
The indices have not seen any of this. On my Bloomberg dashboard of October 7, S&P 500 forward earnings were at a record and US investment grade OAS was 80 basis points, tighter than in mid 2007. Forward earnings are the profits analysts expect over the next twelve months. Investment grade OAS, the option adjusted spread, is the average extra yield over Treasuries on US dollar corporate bonds rated BBB- or better, and the lower it is, the safer lenders feel. Act 4 is not arriving through rates. It is arriving through the credit that finances artificial intelligence, and the indices will see it last.
The Script, and whose it is
The acts are Andy Constan's. Andy runs Damped Spring Advisors and writes here on Substack as Damped Spring. Before that he worked at Brevan Howard, Bridgewater and Salomon. On July 10, 2023 he published a Damped Spring Report titled "The Script," subtitled "The only way to kill inflation," written as a play in five acts. It went to members first, and he made it public on July 25, 2023. You can read the original report and his post making it public.
Act 1, "Higherer for Longerer Island": "Hikes continue and don't achieve goal."
Act 2, "Long end yields rise to new highs": "Requires a supply catalyst."
Act 3, "Multiple compression": "Higher yields take the legs out of equity rally."
Act 4, "Earnings contraction": "The tightening of Act 2 and Act 3 hit demand."
Act 5, "Recession Island": "as equities sell off, companies fire workers."
Read as a chain, the script runs like this. Rate hikes alone fail to cool the economy. Long term bond yields then rise to new highs, which takes a catalyst such as a wave of new bond supply. Higher yields lower what investors will pay today for future profits, so stock valuations shrink. The tightening then hits demand, and profits fall. Only when share prices fall do companies cut jobs, and recession follows. The name of Act 1 plays on "higher for longer," the idea that rates would stay high for a long time.
The premise is that companies "won't fire workers until their share prices fall. Their share prices won't fall until long end yields rise." The script dates from July 2023 and that cycle. By March 2024 he was preparing to leave Higherer for Longerer Island on a journey that he said "may still end at Recession Island." The act by act reading of October 2026 that follows is mine, not his.
The five acts, one by one
Here is each act, what drives it, and where the data put us in October 2026.
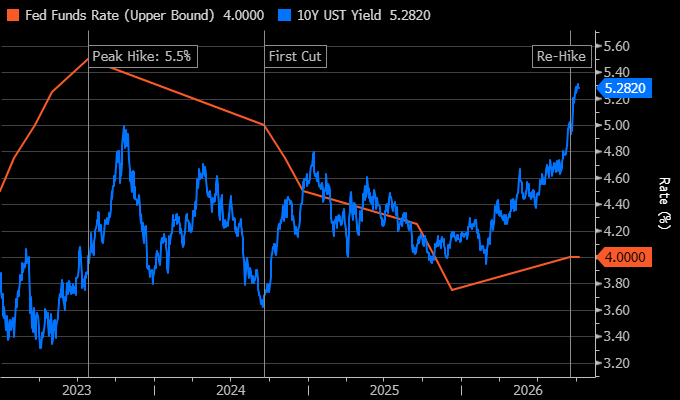
Act 1, the Fed hikes and it does not work. The Fed raises its policy rate to cool demand and bring inflation down. In the script the hikes are not enough on their own, because companies do not fire workers as long as their share prices hold. The Fed held 5.25 to 5.50 percent from July 2023 to September 2024, cut to 3.50 to 3.75 percent on December 10, 2025, and hiked to 3.75 to 4.00 percent on September 16, 2026, by 12 votes to 0, the first hike under Chair Kevin Warsh and the first in more than three years. The fed funds rate is the overnight rate the Fed targets, and it anchors short term borrowing costs. The easing cycle was short and policy is tightening again, so Act 1 is playing a second time.
Act 2, long end yields at new highs. The Fed sets the overnight rate. It does not set the ten year yield. Investors do, and they ask for more to lend for ten or thirty years when the supply of bonds swells and patient buyers step back. That is why Constan wrote that Act 2 "requires a supply catalyst." The ten year closed at 5.31 percent on October 5 on the Treasury's official curve (5.3046 percent on Bloomberg's generic yield), the highest close since May 2002 and above the June 2007 high of 5.26 percent. The thirty year closed at 5.67 percent on October 7. The ten year Treasury yield is the benchmark for mortgage rates and long term corporate borrowing, and a higher yield means a lower bond price. The Fed cut by 175 basis points between September 2024 and December 2025 and has hiked only 25 since, yet Bloomberg's generic ten year rose about 137 basis points, from 3.94 percent on February 27, 2026 to its October 5 high. The long end is not following the Fed. It is following supply, which I take apart further down.
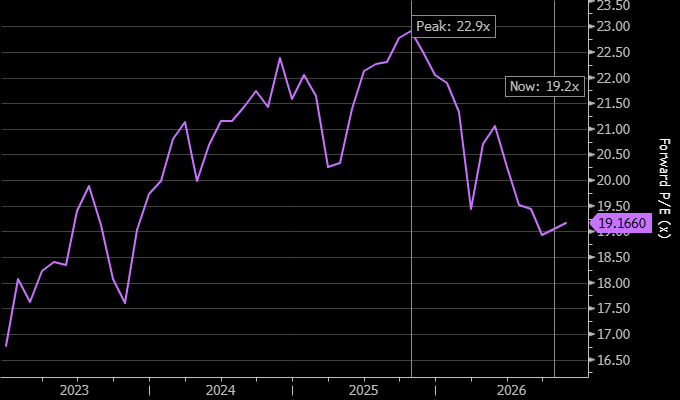
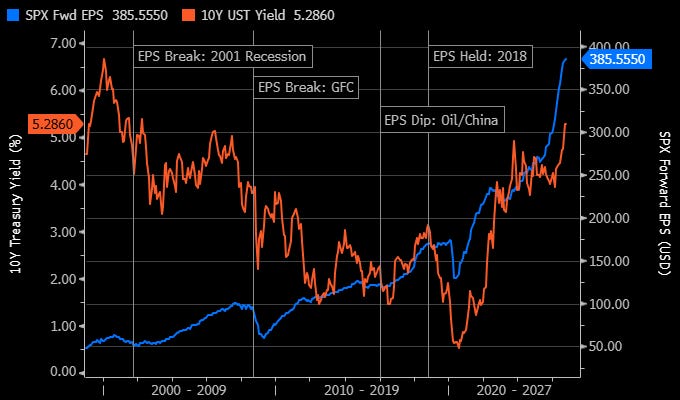
Act 3, multiple compression. When a bond with no default risk pays more, investors pay less for each dollar of future profit, because that profit now competes with a safe return. The S&P 500 forward P/E fell from 22.9 in late 2025 to 19.17 on October 7, 3.7 turns of compression. The forward P/E is the index price divided by the profits expected over the next twelve months. Each turn is one year of those profits: investors paid 22.9 years of them in late 2025 and 19.17 on October 7. Turn the ratio upside down and you get the earnings yield. At 19.17 it is about 5.2 percent, close to what the ten year Treasury pays with no default risk. At 22.9 it was 4.4 percent. The comparison flatters bonds, since profits can grow and a coupon cannot, but it shows how little extra return the index now offers for its risk. The multiple is still above the 16.8 of January 2023, so by that yardstick the compression is not extreme yet.
Act 4, earnings contraction. Tighter money and falling share prices hit demand, revenue slows, and the profit forecasts analysts publish start to fall. This is the act that turns a valuation problem into an earnings problem. It is not in the index data yet. Bloomberg's forward EPS for the S&P 500, the earnings per share analysts expect for the index over the next twelve months, was 385.6 dollars on October 7, a record. In the index data, the first sign would be a run of downward revisions, before any reported decline.
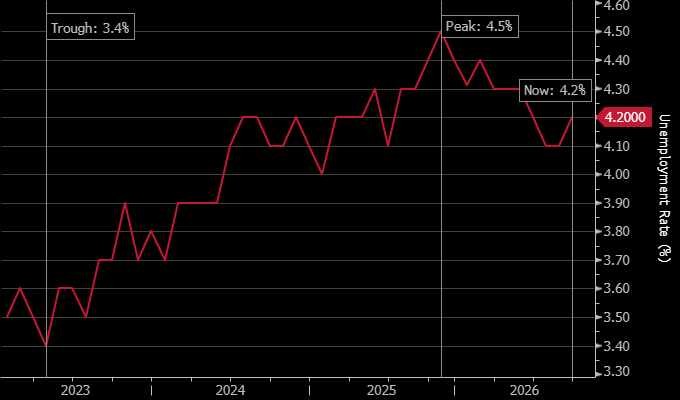
Act 5, recession. In the script, companies fire workers only once their share prices fall. Then unemployment rises and spending falls further. Unemployment rose from 3.4 percent in April 2023 to 4.5 percent in November 2025 and was 4.2 percent in September. So far the labor market has absorbed the shock.
On index data we sit between Acts 2 and 3. The question is whether the rate shock lasts long enough to break earnings, the bridge to Act 4. The four rate shocks before this one show what that takes.
Which cycle? Four rate shocks since 1999
All four pushed long yields up, three compressed the multiple, and only two reached Act 4. For each one, the same questions: what pushed long yields up, what the multiple did, what earnings did, and for the two that broke, what credit said first.
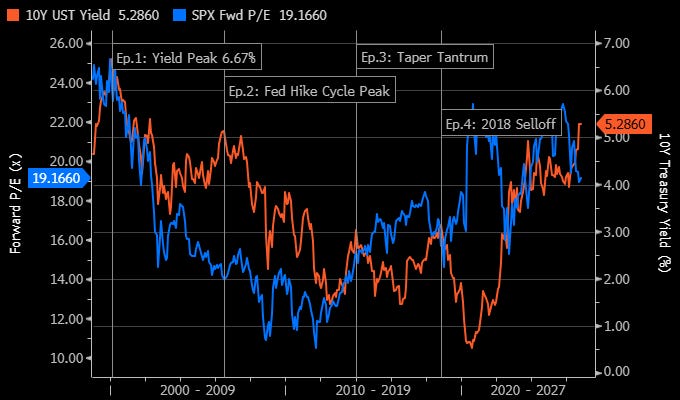
1999 to 2001, the full play. A booming economy and Fed hikes from June 1999 pushed the ten year from about 4.7 percent in January 1999 to a peak of 6.79 percent on January 20, 2000, and the Fed kept going, up to 6.50 percent in May 2000. The forward P/E fell from about 24 to about 15 by 2002. By September 2000, investment grade OAS was already near 165 basis points and high yield OAS, the same spread on bonds rated below investment grade, near 615, while forward EPS was still at its peak. Forward EPS then fell about a fifth, from about 63 dollars in mid 2000 to about 51 in late 2001, roughly 21 months after the yield peak. High Treasury yields alone did not do it. They met a capex bubble that was deflating, then the demand shock of September 2001.
2004 to 2007, the credit break. The Fed hiked 17 times, from 1 percent in June 2004 to 5.25 percent in June 2006, 425 basis points. At first the long end even fell, which Alan Greenspan called a "conundrum" in February 2005, the opposite of today, when the long end rose to new highs after the Fed had cut by 175 basis points. The ten year went from about 3.3 percent in June 2003 to a high of 5.26 percent in June 2007. The forward P/E slipped from about 17 to about 14, but earnings grew fast enough to carry the index higher. Investment grade OAS bottomed near 91 basis points and high yield OAS near 234 in June 2007. Both started to widen that summer, while earnings held through 2007, and then forward EPS fell about 40 percent into 2009. By December 2008 investment grade OAS was above 600. But the leverage of 2007 sat in housing and bank balance sheets. The leverage of this cycle sits in data centers, leases and vendor commitments.
2013, the taper tantrum. In May 2013 Ben Bernanke signaled that the Fed would slow its bond purchases, and the ten year jumped from 1.66 percent on May 1 to 2.98 percent on September 5. The forward P/E did not compress. It rose from about 14 to about 15, and forward EPS kept rising, from about 115 dollars to about 130 through 2014. In September the Fed delayed the taper. The shock was sharp, then it faded. The ten year ended 2013 at 3.04 percent and 2014 at 2.17. Duration matters as much as size: a spike that reverses does not have time to choke demand.
2018, the pivot. 2018 is the comfortable answer. The Fed hiked four times that year. The ten year rose from about 2.5 percent at the start of 2018 to about 3.2 percent in the autumn, the forward P/E lost about four turns into December, from about 18.5 to about 14.5, forward EPS kept rising, and the Fed turned in January 2019, signaling it would stop hiking. The S&P 500 fell 19.8 percent between its close of September 20 and its close of December 24. Forward EPS went from about 157 dollars to about 175 through 2018 and 2019. The pivot was the circuit breaker. That analogue needs a Fed that turns. This one hiked four weeks ago and buys no duration, meaning it does not buy long term bonds in the market.
The pattern. In none of the four did rates alone break earnings. Earnings broke when three things met: yields high for long enough, an excess financed with debt that higher rates exposed, and a Fed that turned too late. The Fed held 6.50 percent until January 2001 and 5.25 percent until September 2007, after credit had cracked, and its cuts did not save earnings. 2013 was too short. 2018 had its pivot, in time. 2007 broke through housing and the banks. 2000 broke through a capex boom financed with debt. In 2000 and in 2007, credit moved before earnings. Today investment grade OAS, at 80, is tighter than in June 2007, and high yield, at 298, is wider than its June 2007 low but less than half its level of September 2000. The index is calm. The single names are not, as the credit section below shows.
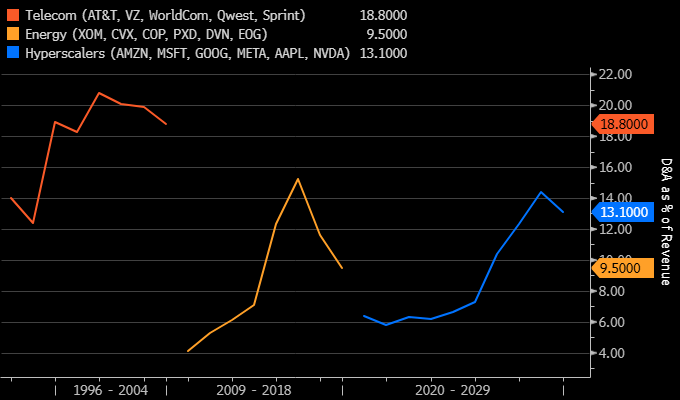
2000 is my answer. 2026 already has two of the three conditions, a capex boom increasingly financed with debt and a Fed that hikes instead of turning. The remaining one, time, is the open question, and the next section explains why I think the long end stays high. The engine in 2000 was a capex cycle financed with debt. Carriers borrowed to lay fiber, and depreciation hit income statements two to three years later, just as revenue rolled over. Capex, capital expenditure, is money spent on long lived assets such as fiber, data centers or chips. The cash goes out at once, but the accounting cost, depreciation, is spread over the asset's useful life, so heavy spending today becomes a rising expense for years, whatever revenue does. For AT&T, Verizon, WorldCom, Qwest and Sprint, depreciation and amortization went from 14.0 percent of revenue in 1997 to 20.8 percent around 2001, and stayed above 19 percent for three years. WorldCom, which had booked operating costs as capital spending, filed for bankruptcy in July 2002. Credit broke first, in the most levered names. The index learned last.
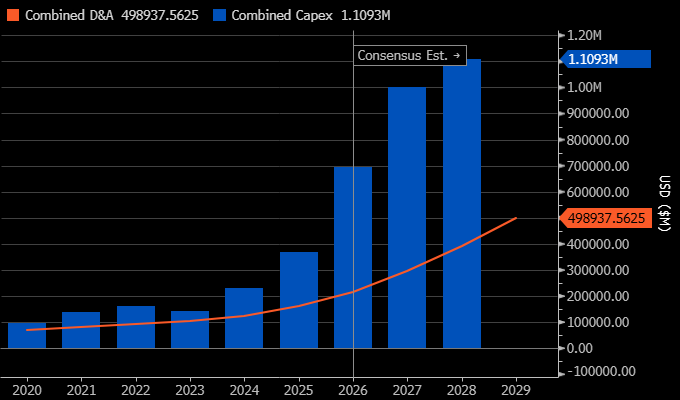
The hyperscalers, the companies that build and run the largest data centers, are on the same path. My basket of six also includes Apple and Nvidia. For Amazon, Microsoft, Alphabet, Meta, Apple and Nvidia combined, depreciation was 7.3 percent of revenue in 2025 and consensus takes it to 14.4 percent in 2028. In dollars it goes from 162 billion in 2025 to 499 billion in 2029, a tripling. Energy in 2014 to 2016 is the false analogue. Its ratio went from 7.1 to 15.2 percent because revenue fell 47 percent, from 716 to 382 billion dollars, while depreciation rose 14 percent. The hyperscaler ratio is a numerator story, like telecom: it rises because depreciation grows, not because revenue collapses.
The long end has no buyer of last resort
Act 2 needed a supply catalyst, a reason for more long bonds to come to market than buyers want at current prices. This cycle has four, and none of them is cyclical.
The deficit. Bloomberg's data put the 2026 federal deficit at 1.97 trillion dollars and federal debt at 38.5 trillion at the end of 2025, against 22 trillion in 2018.
Corporate duration. 41 percent of the hyperscalers' 2025 and 2026 dollar issuance has a maturity beyond 15 years, against 16 percent for the ICE BofA US Corporate Index (TwentyFour Asset Management, September 3). The long bond needs the same pension and insurance money, the investors who buy thirty year paper to match obligations that run for decades.
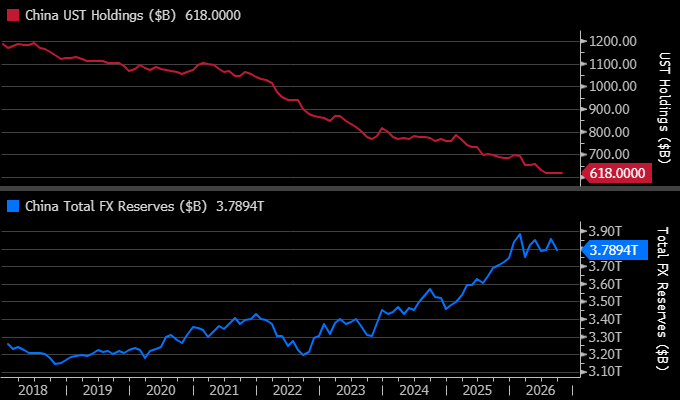
China. Mainland China held 618.0 billion dollars of Treasuries in July 2026, down 77.6 billion, or 11.2 percent, in a year, against a peak of 1,316.7 billion in November 2013 (Treasury TIC data, the monthly report on foreign holdings). Its total reserves, gold included, were 3,789 billion at the end of September, of which foreign exchange 3,400 billion (SAFE, China's foreign exchange regulator).
The Fed. Quantitative tightening, the Fed shrinking its bond holdings by letting them mature without replacing them, ended on December 1, 2025, after more than 2.2 trillion dollars of runoff since June 2022. The New York Fed scheduled no reserve management purchases, the bill purchases it uses to keep bank reserves ample, from August 14 to October 14, and 15.6 billion of reinvestments for September 15 to October 14. Fannie Mae and Freddie Mac were net buyers of only about 50 billion of mortgage bonds through mid year against a 200 billion directive, by Goldman Sachs' estimate, reported by Bloomberg in July. No official buyer is taking duration.
The price shows. The 30 year real yield, the return after inflation on inflation protected Treasuries, reached 3.007 percent on July 31, the highest since 2008. The 10 year SOFR swap spread was minus 39.7 basis points, off a 2025 low of minus 54.3. The swap spread is the 10 year swap rate minus the 10 year Treasury yield. Below zero, Treasuries yield more than swaps, a sign that dealers struggle to carry all the government paper on offer. The MOVE index, the bond market's equivalent of the VIX, measured from Treasury options, rose from 72.0 to 110.5 in the third quarter.
The 30 year mortgage rate hit 7.49 percent, the highest since 2023. American homeowners can refinance whenever rates fall, so mortgage bonds shorten when yields drop and lengthen when yields rise. When yields rise, refinancing stops, the bonds behave like longer debt, and holders who hedge sell Treasuries or their swap equivalent to stay balanced, which pushes yields higher again.
The 20 year. The market now discusses cutting or scrapping the 20 year bond. Citi expects 3 billion dollars less per 20 and 30 year auction, replaced by bills, debt that matures within a year (Bloomberg, October 9 and 12), and Jason Williams, Citi's head of US rates strategy, said Bessent "may point to poor pension-fund Treasury demand, perhaps caused by increased long-end corporate bond issuance," as a reason to reduce or cancel the 20 year. That is the AI channel reaching the auction calendar. Each quarter the Treasury's refunding statement says how much it plans to sell at each maturity. In its August 5 statement, the Treasury said it expects to keep coupon sizes, the amounts sold at each note and bond auction, "for at least the next several quarters," but it now evaluates future "changes" to them, no longer "increases," which Bloomberg reads as opening the door to cuts in 20 and 30 year supply. The 20 year touched 5.75 percent on October 5, its highest since it returned in 2020 (its highest close on Bloomberg's generic yield, 5.709 percent, came on October 7), and was at 5.614 percent at 14:39 today.
Last week's 10 and 30 year auctions stopped at the highest yields since 2000. The September 15 reopening of the 20 year, 13 billion dollars, tailed 2.0 basis points, 5.420 percent against 5.400 when issued, bid to cover 2.57, with dealers taking 16.85 percent of competitive awards against 12.49 in August and indirect bidders down to 52.47 percent from 62.93. A tail means the auction cleared at a higher yield than the market yield just before it, a sign of weak demand. Bid to cover is the amount bid per dollar sold. Dealers are the primary dealers, firms obliged to bid at every auction, so they absorb what others leave. Indirect bidders bid through an intermediary, a dealer or the New York Fed, and include foreign central banks. More for dealers and less for indirects means thinner real demand. The next reopening is on October 21.
BNP Paribas strategists led by Guneet Dhingra wrote in a note reported by Bloomberg on October 6 that "eliminating the 20-year could be perceived as panic, and signal an exhaustion of the Treasury's toolkit, encouraging bond vigilantes," called the Treasury's moves "a 'band-aid on a gunshot wound'," and kept a short in the 30 year with a 5.8 percent target. Bond vigilantes are investors who sell government debt to push back against deficits, and BNP's short is a bet that the 30 year yield rises toward that target.
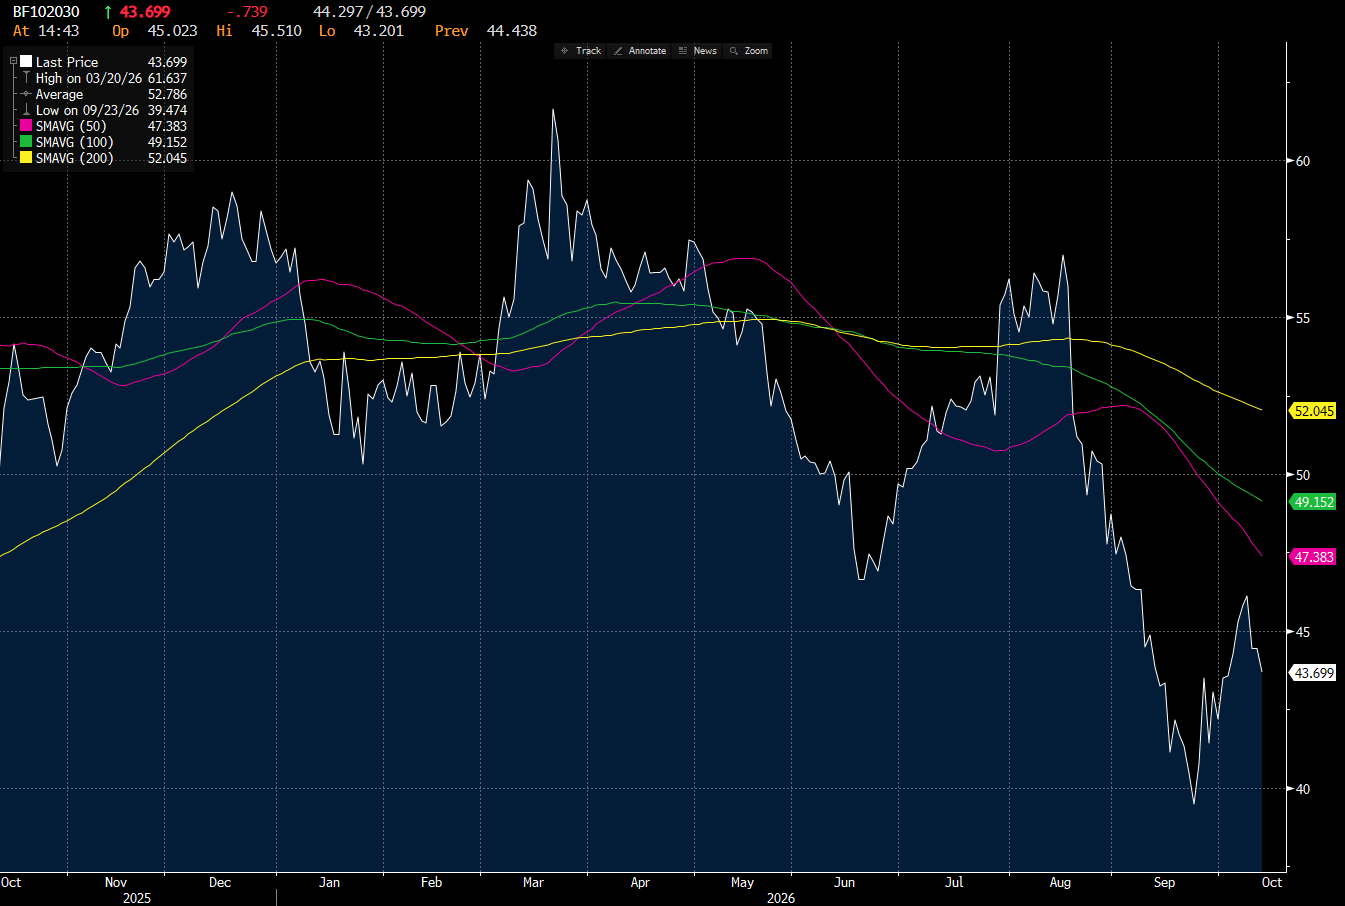
The yield curve plots yields against maturities, and it is concave at the long end. At 14:43 today the 10s20s30s butterfly, twice the 20 year minus the 10 and the 30 year, was 43.7 basis points, so the 20 year yields 21.85 basis points, half the butterfly, more than the average of its neighbors, down from 61.6 on March 20 and against a one year average of 52.8. The 20s30s spread, the 30 year minus the 20 year, was minus 4.79 basis points, a one year z score of minus 1.99, about two standard deviations below its average of the past year, a rare level. Cutting the 20 year would richen it further, that is, lower its yield as supply shrinks, but the borrowing would move to other tenors, the 10 and 30 year or bills, which BNP calls expensive while the Fed is hiking.
Harley Bassman, the Convexity Maven, warned today that the jump in yields has made the longest bonds the ones delivered into futures, and that a 20 year above 6 percent would be a "nightmare scenario," with selling pressure equal to a 110 billion dollar auction (Bloomberg). Treasury bond futures are settled by delivering whichever eligible bond is cheapest for the seller to deliver. This year's rise in yields cut the prices of the longest bonds the most, so the cheapest to deliver is now the longest eligible bond, and the futures take on its large sensitivity to rates. He puts the negative convexity of bond futures at its highest since 2007. Negative convexity means a position becomes more sensitive to rates as yields rise, so losses accelerate and hedgers must sell more. That is the mortgage loop again, duration that grows as yields rise.
The AI financing chain
Issuance. In 2025, Amazon, Alphabet, Meta, Microsoft and Oracle issued 121 billion dollars of US corporate bonds, against 28 billion a year on average from 2020 to 2024 (BofA Securities, via Reuters). By August 10, 2026, hyperscaler debt issuance had reached about 220 billion dollars for the year, against 12.5 billion in the same period of 2025 (BNP Paribas data, via Reuters). More than 120 billion of data center spending by Oracle, Meta, xAI and CoreWeave sits in off balance sheet vehicles (Financial Times, late 2025). These are separate companies, often co-owned with private capital funds, that borrow to build a campus and lease it to the tech company, so the debt sits outside the tech company's balance sheet.
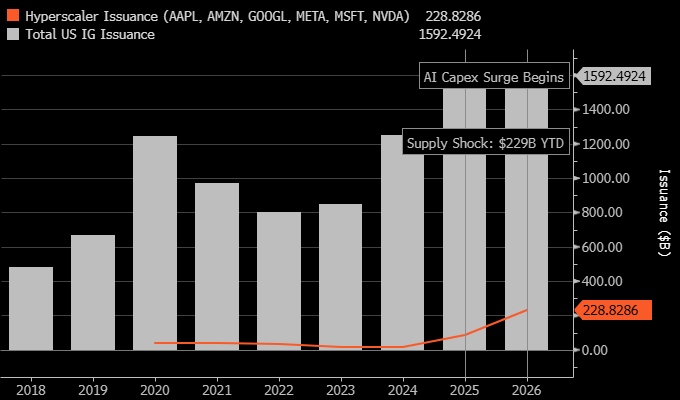
Off balance sheet. A lease enters the balance sheet only when it starts, when the building is handed over. Until then it is disclosed in the notes to the accounts. Leases signed but not yet commenced, from the latest filings: Microsoft 329.1 billion dollars, Oracle 288, Meta 279.0, Amazon 137.2 and Alphabet 85.2, about 1.12 trillion in total (June 30, August 31 for Oracle). Microsoft's alone, in undiscounted payments, the simple sum of future rents, are 3.7 times the 88.5 billion of operating and finance lease liabilities on its balance sheet. Purchase commitments and other contractual obligations add 811.0 billion at Alphabet, and non-cancelable contractual commitments 349.3 billion at Meta, both reported separately from leases. Moody's, in a July 22 note, counted 1.2 trillion of lease commitments across six hyperscalers including CoreWeave, more than 820 billion not yet started, and treats them as debt-equivalent liabilities, against about 460 billion of direct debt (CNBC). Meta's Hyperion campus in Louisiana was financed by Beignet Investor LLC, a Blue Owl vehicle, with 27.3 billion of senior secured notes, bonds that are paid first and backed by pledged assets, at 6.581 percent due 2049, the largest single bond tranche on record (IFR).
Nvidia is the knot. Its 10-Q, the quarterly report filed with the SEC, for the quarter ended July 26, 2026 lists 366 billion dollars of future commitments: 279 billion of supply and capacity, 29 billion of cloud service agreements, 25 billion of data center leases not commenced, 25 billion of promised equity investments "in AI model makers, infrastructure financiers, and other private companies," and 8 billion of capex. In August, after the quarter closed, it added guarantees capped at 105 billion to support a land, power and shell buildout with SB Energy affiliates "on behalf of a customer, an affiliate of OpenAI," for about 4.25 gigawatts in Pike County, Ohio, a site that will "exclusively host NVIDIA AI infrastructure, subject to limited exceptions." Here the guarantee means Nvidia pays part of the rent and power bills, up to the cap, if the OpenAI affiliate cannot. Nvidia's maximum exposure under guarantees is 108.5 billion, against 33.4 billion of debt on the balance sheet. The loop is explicit. A letter of intent to invest up to 100 billion in OpenAI (September 22, 2025) was replaced by a 30 billion investment, and OpenAI was set to use much of that capital to buy Nvidia chips (Reuters, February 20, 2026). In effect, the supplier is financing demand for its own chips. If that demand disappoints, the same exposure surfaces on several balance sheets at once.
Depreciation against monetization. Consensus capex for the six names, the average of analysts' forecasts, goes from about 370 billion dollars in 2025 to 695 billion in 2026 and 1.109 trillion in 2028, and depreciation from 162 billion in 2025 to 499 billion in 2029. Clear Street estimated AI specific service revenue at about 25 billion dollars in 2025, against 382 billion of capex at the five largest spenders in Clear Street's count. An expert interview (In Practise, a former AWS executive) put one gigawatt at about 30 billion of capex for 6 to 7 billion of annual revenue and 3 to 3.5 billion of annual cash contribution at today's rates, a payback of about nine to ten years, the time it takes for the cash generated to repay the investment. He gets to five to six years only if revenue ramps up and so does utilization, the share of capacity actually sold. Depreciation on what is built is locked in. Revenue is not. That is how earnings break by accounting, before any recession.
China, energy and the consumer hit the same revenue line and calendar. Cheaper Chinese models cap the price of inference, running trained AI models to answer queries. Sightline Climate data cited by Bloomberg on April 1 had close to half of the US data center builds planned for 2026 projected to be delayed or canceled, mostly for lack of electrical equipment such as transformers, switchgear and batteries, a count whose denominator SemiAnalysis disputed on June 18. Oracle cited force majeure, a contract clause that excuses delays caused by events outside a party's control, on Project Jupiter in New Mexico (Bloomberg, September 24), after New Mexico's State Land Office twice refused a route for the gas pipeline meant to supply the site. That is a power delay written into a lease. And spending by the top income households, who own most of the stock market, rides on equity valuations that Act 3 is compressing.
Credit, where Act 4 starts
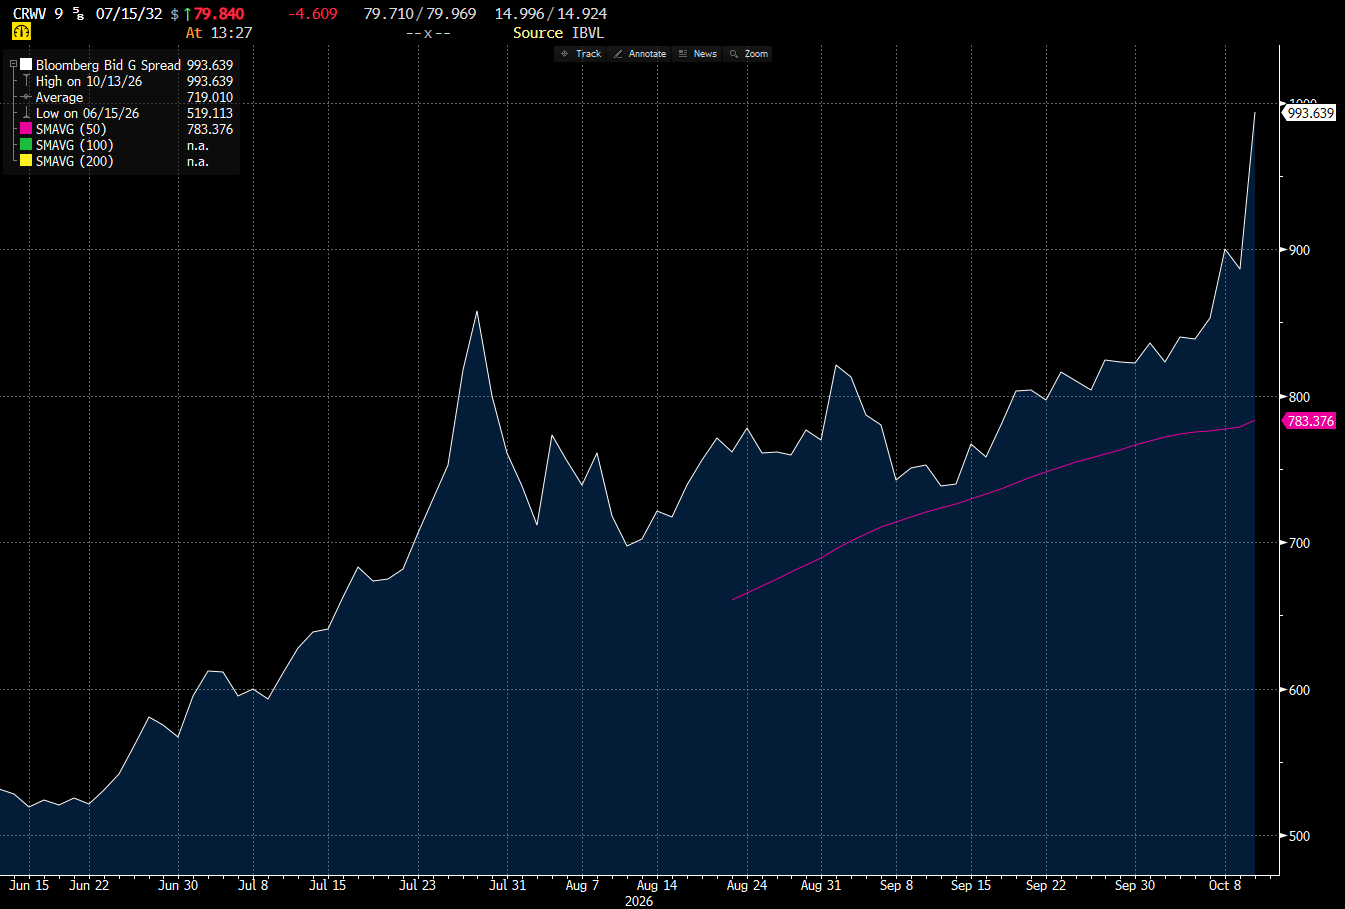
CoreWeave. The 9 5/8s of 2032 were sold at par in June. Today's quote at 13:22: price 79.82, yield 14.96 percent, G spread 990.3 basis points, Z spread 1,021.4, I spread 1,027.2, modified duration 3.93, DV01 326 dollars per million of face. Modified duration says the bond's value, accrued interest included, falls about 3.93 percent for each percentage point rise in yield, and DV01 is the dollar change per million of face value for a one basis point move. The 1,000 basis point line is crossed in Z and I, for the first time since issue, not yet in G, which hit 993.6 at 13:27 against a low of 519.1 on June 15.
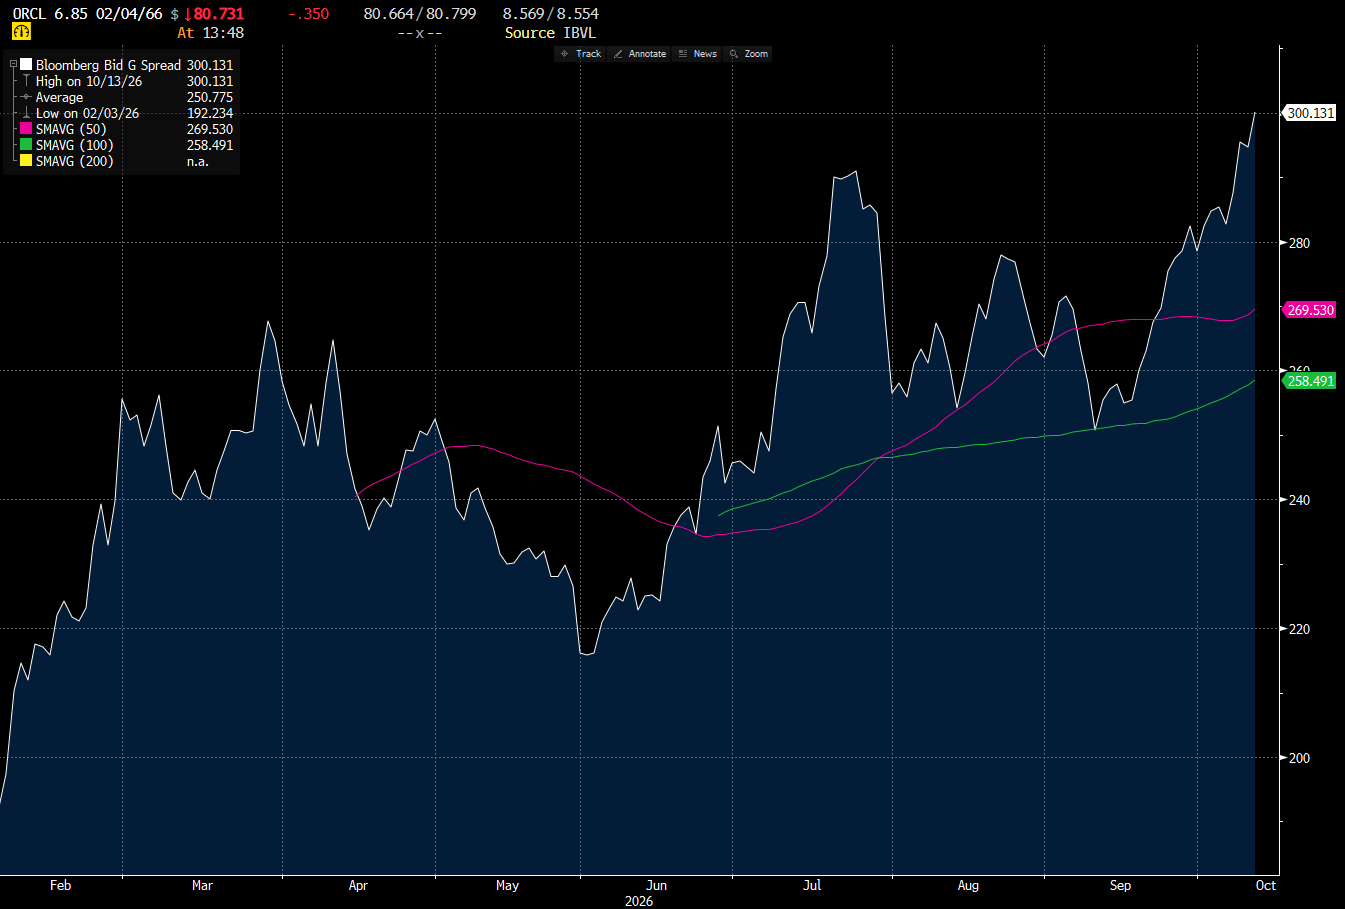
Oracle. S&P cut it to BBB- on July 9, one notch above high yield. BBB- is the lowest investment grade rating. One more notch down would put Oracle in high yield at S&P, a step toward losing investment grade, and many funds are not allowed to hold high yield bonds. The 6.85s of 2066, a 2.75 billion tranche, one maturity of a larger deal, sold on February 2 at 99.81, were at 80.74 at 13:48, a yield of 8.56 percent, G spread 299.7, Z 370.8, I 383.1, modified duration 11.31, DV01 928 dollars per million of face. The G spread has gone from 192.2 on February 3 to 300.1 today, a record for the line. The five year CDS went through its previous record, near 220 to 230 basis points, in late September, rose to 260.9 on October 8 and closed at 251.9 on Monday, against 68.0 a year earlier. ZeroHedge wrote on X today that Oracle unsecureds, the bonds with no specific collateral behind them, trade "like deep junk." At 300 over, that is a phrase, not a measurement.
G spread is measured over the interpolated Treasury curve, I spread over the interpolated swap curve, Z spread over the zero coupon swap curve. The I spread sits above the G spread on both bonds, by 37 basis points for CoreWeave and 83 for Oracle, because swap rates trade below Treasury yields.
Beignet. The 6.581s of 2049 were at 91.44 at 13:51, down 0.78 point, G spread 219.6, Z 263.9, I 273.0, duration 9.29. That is close to the widest since issue, but 10 basis points inside the record of 229.1 set on July 24.
Bloomberg Law noted on July 21 that "nearly 80% of data-center securities sold since early last year are now quoted at a wider spread than at issuance."
The indices lag. Investment grade OAS was 80.01 basis points and high yield 298.49 on October 7, high yield up about 41 from its May low near 257. CDX IG was 58.94 at 13:57 and CDX HY 341.69 at 13:58 today, against a one year range of 288.4 to 406.4 for CDX HY. CDX IG and CDX HY are traded indices of credit default swaps on 125 investment grade and 100 high yield North American companies, the quickest gauge of credit risk.
Memory. At a conference in Shanghai on October 9 and 10, Cao Kanyu, the president of CXMT, announced progress on a 4F² DRAM cell, two thirds of the area of today's 6F² designs, and a new generation of DDR5 server modules by the end of 2026. F is the smallest feature a chip process can print, so at the same F a 4F² cell packs more memory into each wafer, which can lower the cost per bit. CXMT was already the world's fourth largest DRAM maker in the second quarter according to Counterpoint, listed on July 27 with a first day gain of 466 percent and 8.6 billion dollars raised, and Washington held off on adding it to the Entity List, the US export blacklist, to protect the trade truce (Export Compliance Daily, June 18). Its prospectus had no dedicated HBM project, the high bandwidth memory stacked next to AI processors, and a Morningstar analyst told Bloomberg to expect a meaningful time gap before commercial yields, here the share of usable chips per wafer. But memory pricing power is part of the margin the AI chain is built on. TrendForce wrote in June that conventional DRAM prices had risen sharply since the second half of 2025 in a tight market, strengthening suppliers' pricing power in HBM. A fourth supplier with a denser cell attacks exactly that.
Verdict, and the levels
My verdict: early Act 4, through credit. The indices will see it last.
The rates channel did its work in Acts 2 and 3. Act 4 is arriving where leverage is highest and the accounting is most fragile, in the bonds of the companies that borrowed to build AI and in the suppliers whose margins depend on it. That is the 2000 pattern, not 2018 and not 2007. This is not a crash call.
The levels I watch:
CoreWeave 9 5/8 2032, a G spread close above 1,000 basis points (993.6 today).
Oracle 6.85 2066 beyond 300 basis points of G spread, five year CDS above the 260.9 of October 8, and any move from BBB- to high yield at S&P.
Beignet 2049 above 229.1, its record.
CDX HY above 406.4, the one year high, and cash high yield OAS through 350, then 400.
The ten year above 5.31 percent, the thirty year above 5.67, the 20 year at 6 percent, Bassman's line, the October 21 reopening of the 20 year and the November 4 refunding.
Friday's TIC data for China and the New York Fed's purchase schedule from October 15.
For the indices, the first monthly decline in forward EPS and unemployment above the 4.5 percent of November 2025.
Andy's play ends with companies firing workers. In this cycle, the first scene of Act 4 is already playing in the bond market.
Key terms, in plain English
Basis point. One hundredth of a percentage point. 100 basis points make 1 percentage point.
Yield. The annual return a buyer earns by holding a bond to maturity at its current price, if every coupon is paid and the principal is repaid. Prices and yields move in opposite directions.
Spread. The extra yield a bond pays over a benchmark. The G spread is measured over US Treasuries, the I spread over interest rate swaps, the Z spread over the whole zero coupon swap curve. Wider spreads mean lenders see more risk.
OAS. The option adjusted spread, the spread of a bond or an index after removing the value of the call options some bonds carry. The standard gauge for investment grade and high yield indices.
Investment grade and high yield. Ratings of BBB- or better are investment grade. Anything lower is high yield, also called junk.
CDS. A credit default swap, a contract that works like insurance against a company's default, quoted as an annual cost in basis points of the amount insured.
CDX IG and CDX HY. Traded indices of credit default swaps on 125 investment grade and 100 high yield North American companies.
Duration and DV01. Modified duration measures how much a bond's value moves when its yield moves, in percent per percentage point. DV01 is the dollar change for a one basis point move, here per million of face value.
Convexity. How duration itself changes as yields move. Negative convexity means a position becomes more sensitive to rates as yields rise, so losses accelerate.
Butterfly. A measure that compares a middle maturity with the two around it. Here, twice the 20 year yield minus the 10 and the 30 year.
Swap spread. The swap rate minus the Treasury yield of the same maturity. Negative means Treasuries yield more than swaps.
Real yield. The yield after inflation, read on inflation protected Treasuries.
MOVE index. The implied volatility of Treasury options, the bond market's VIX.
Quantitative tightening. The Fed shrinking its balance sheet by letting bonds mature without buying new ones.
Refunding. The Treasury's quarterly announcement of its borrowing plans, including how much it will sell at each maturity.
Auction tail and bid to cover. A tail is the amount by which an auction clears above the market yield just before it. Bid to cover is total bids divided by the amount sold.
Forward EPS and forward P/E. Forward EPS is the profit per share analysts expect over the next twelve months. The forward P/E is the price divided by it.
Capex and depreciation. Capex is spending on long lived assets. Depreciation spreads that cost over the asset's useful life in the income statement.
Leases not yet commenced. Leases signed but not started. They are disclosed in the notes to the accounts, outside the balance sheet, until the asset is delivered.
Off balance sheet vehicle. A separate company that borrows to build an asset and leases it to the user, so the debt does not show on the user's balance sheet.
TIC data. The Treasury's monthly report on foreign holdings of US securities.
Hyperscalers. The companies that run the largest cloud and AI data centers, such as Amazon, Microsoft, Alphabet, Meta and Oracle.
This article is for educational purposes only. It is not investment advice, a solicitation, or an offer to buy or sell any security or derivative. Levels are as of the dates and times stated and can change quickly. Credit, equities and derivatives carry a high risk of loss. The five act framework belongs to Andy Constan (The Damped Spring Report, "The Script," July 10, 2023). The act by act reading of October 2026 is the author's own and does not represent his views.
$CRWV $ORCL $NVDA $META $MU $TLT
Data: Bloomberg.
Great piece — the footnote trail is the whole story: CoreWeave's $35.6B of debt pricing at 9–15%, and Microsoft's $329.1B of leases not yet commenced. We pulled the full paper trail into one deep dive:
https://thetape2.substack.com/p/the-ai-buildout-in-footnotes
An absolute must-read right now. Thank you for such a precise and deep, and yet accessible, breakdown