


By Djellal Djouad. October 31, 2026, data as of the October 30 close.
Market commentary for educational purposes. This is not investment advice and not a recommendation to buy or sell anything. Levels are as of the dates and times given, markets move fast, and currencies, bonds and derivatives can lose far more than you expect.
A note to readers: from next week, CrossVol Research becomes a paid publication, at $15 a month. More at the end of this piece.
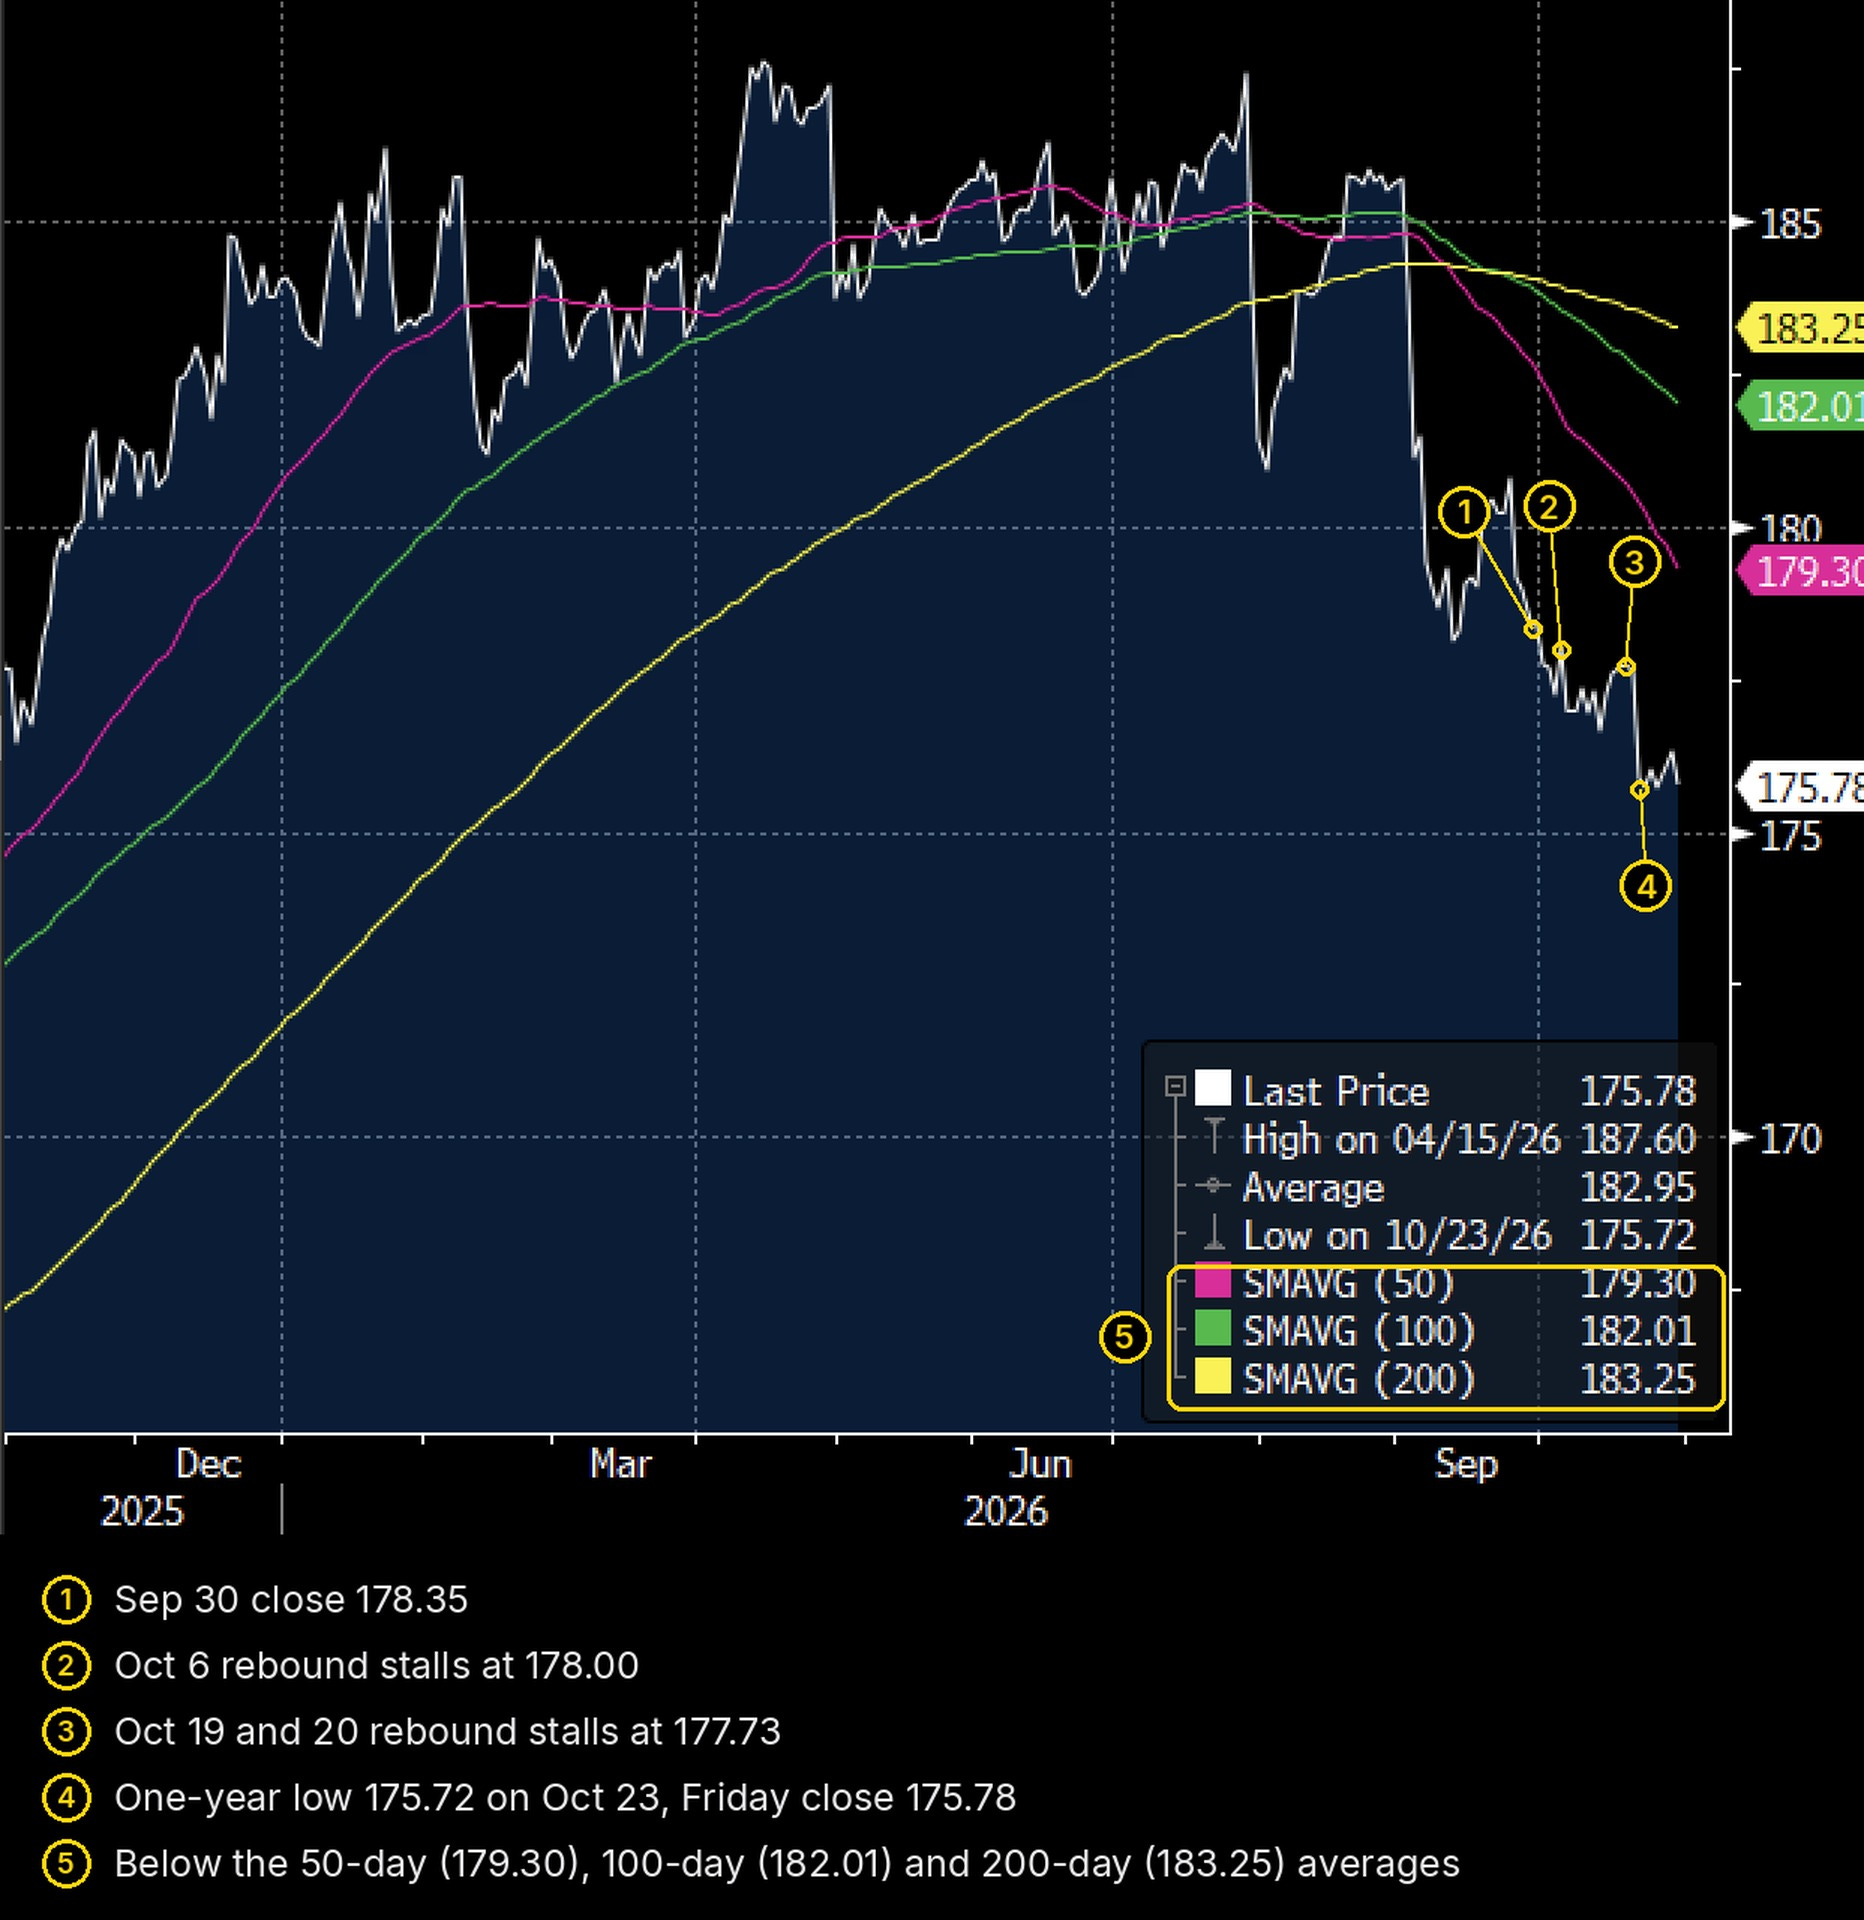
Since the end of September I have told clients the same thing, several times and again this week: sell every EUR/JPY rally. The euro closed Friday at 175.78 yen. It was 178.35 on September 30 and 185.59 on August 31. It closed at 175.72 on October 23 and again on October 27, its lowest close in a year. Every bounce since September 30 has stalled below that day's close.
My view has not changed. The euro will keep falling, and mostly against the yen. What changed this week is where the stress shows up. The French fiscal scare started in government bonds, the OAT market I covered on October 25, in a piece whose figures FXStreet picked up. It has now reached one of the few markets that show who needs dollars and how badly: the cross-currency basis.
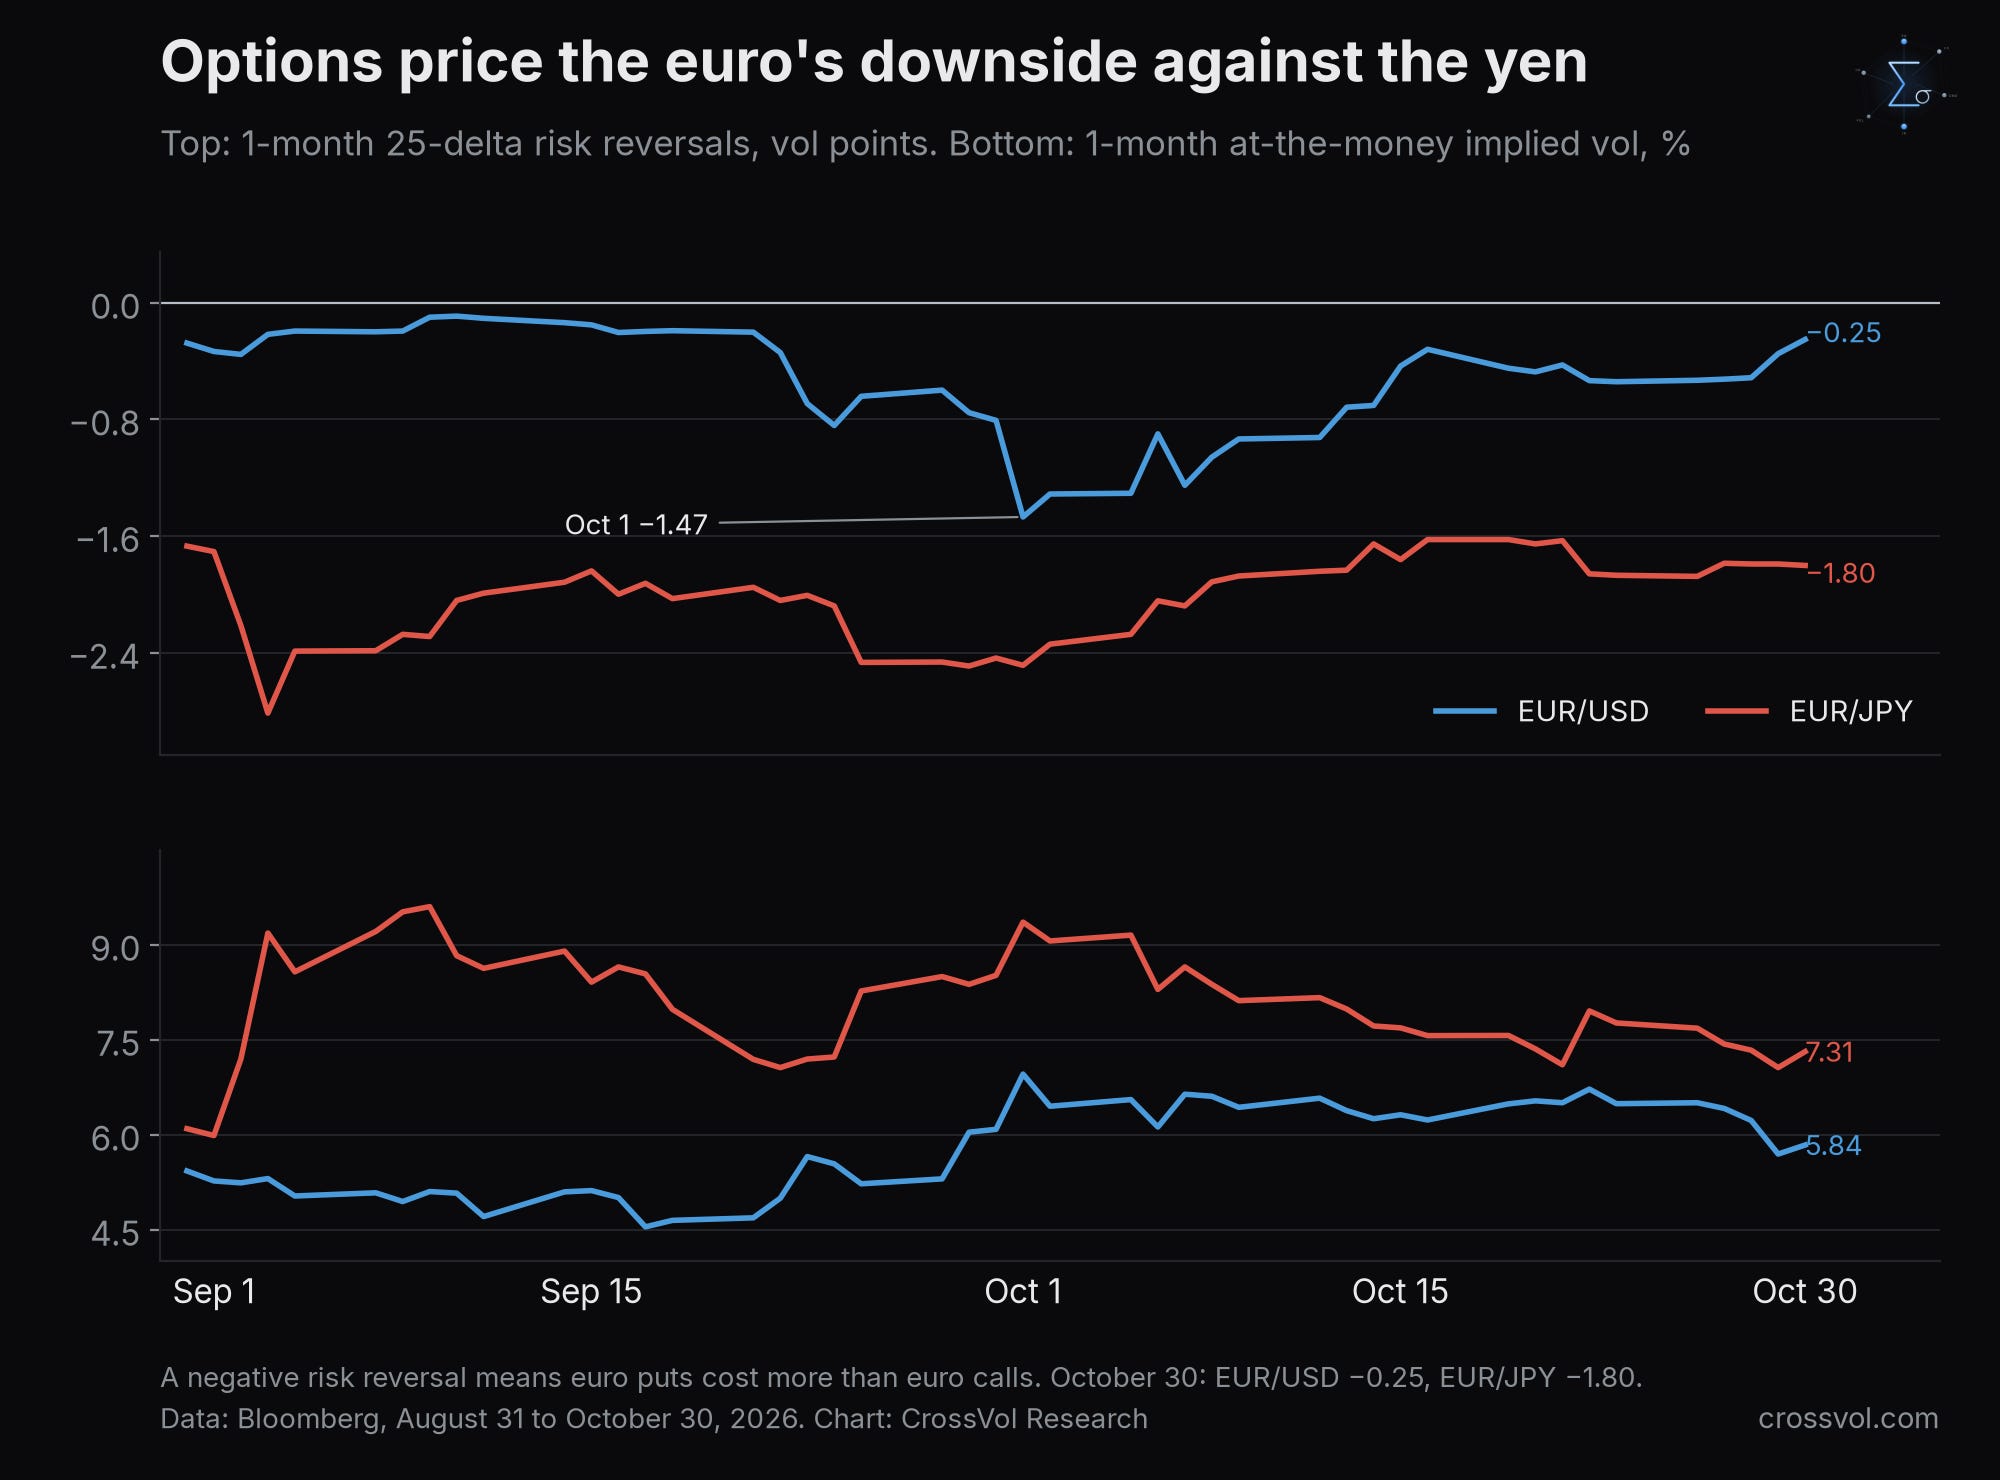
Options on EUR/USD do not confirm an imminent fall. Options on EUR/JPY still lean toward it. That gap is the trade, and the market data below, checked on Bloomberg after Friday's close, explain why.
The short version
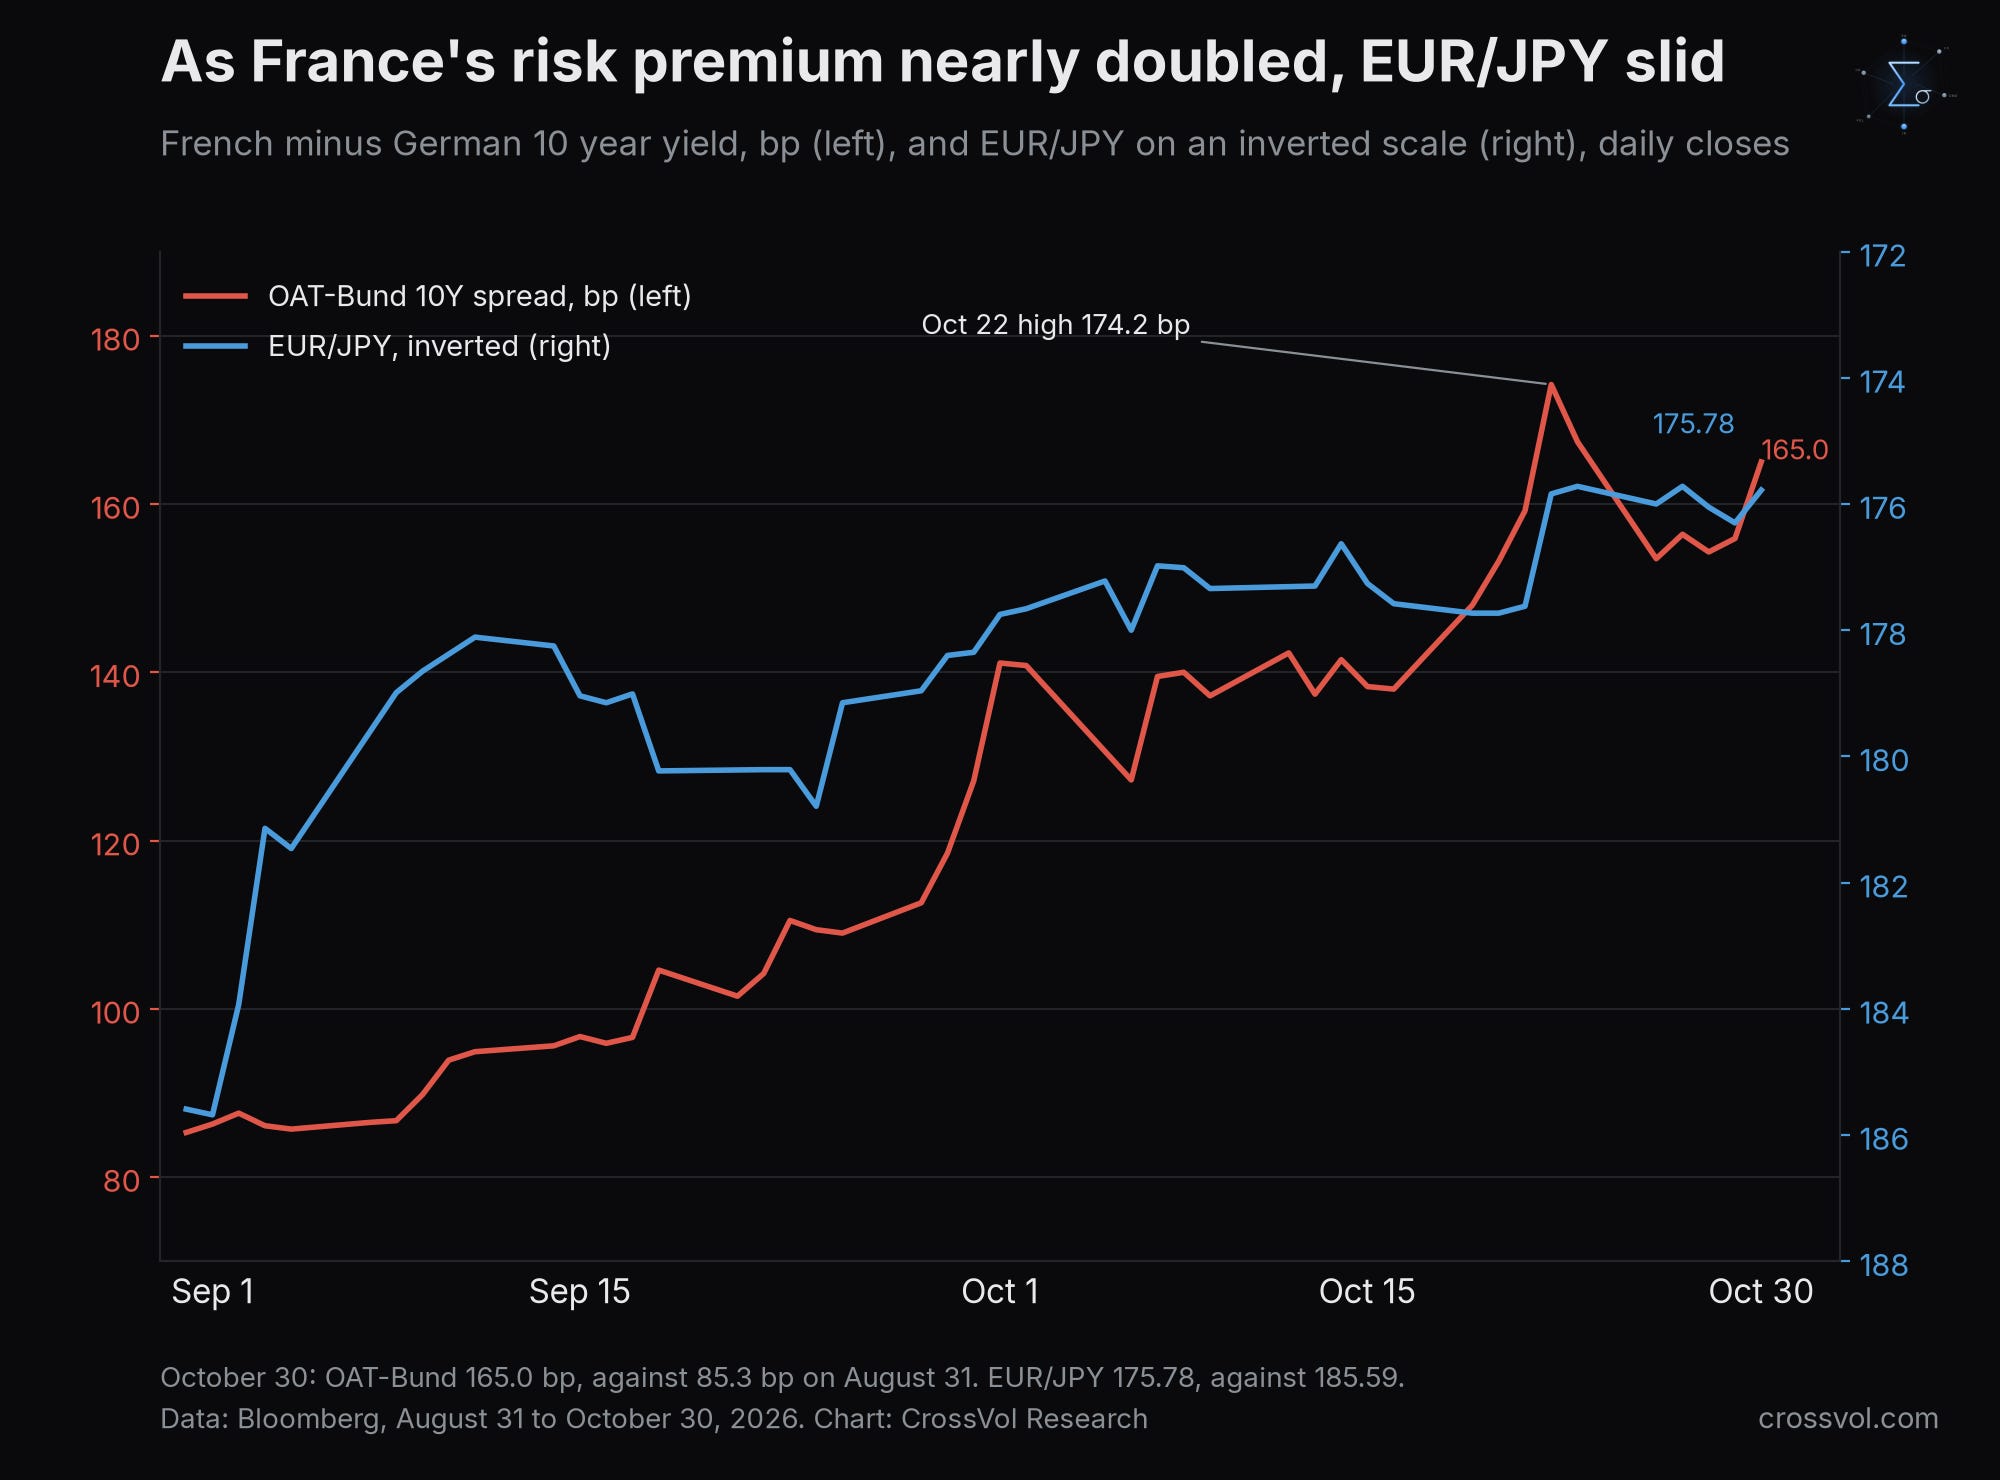
France's risk premium has nearly doubled. The 10-year OAT-Bund spread went from 85 bp on August 31 to 165 bp on October 30, after a closing high of 174 bp on October 22. France now pays 46 bp more than Italy to borrow for ten years.
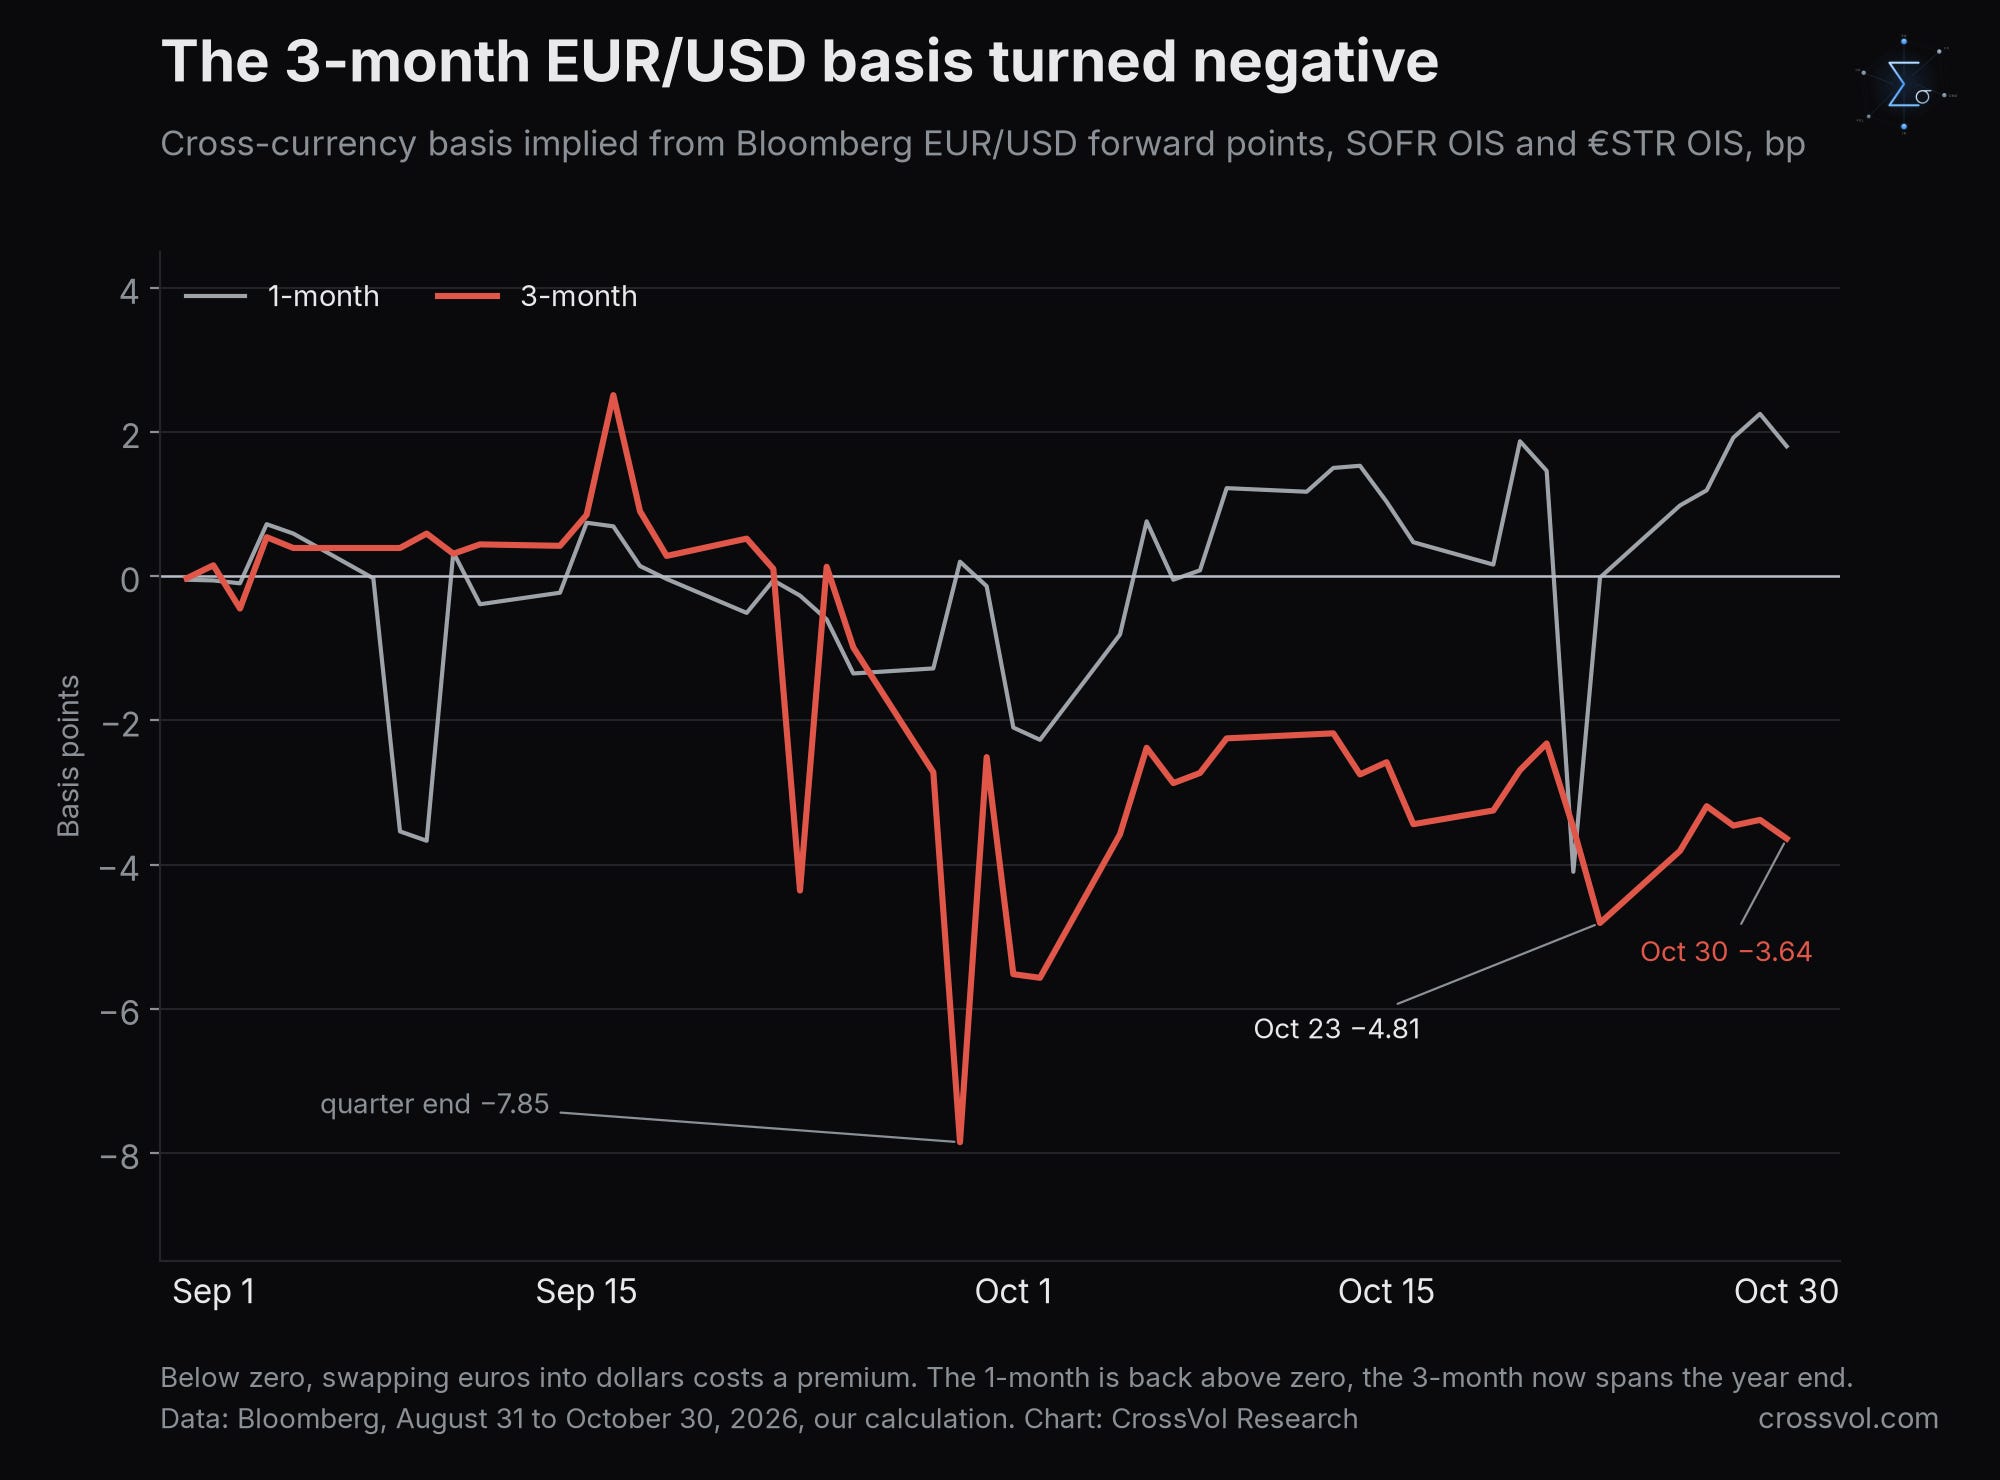
The stress has reached dollar funding. Measured against overnight rates, the 3-month EUR/USD cross-currency basis went from zero at the end of August to minus 2.5 bp at the end of September and minus 4.8 bp on October 23. It closed the week at minus 3.6 bp. On Bloomberg's dealer quotes, sterling's basis barely moved.
The euro is weakest against the yen. Since August 31 the euro has lost 5.3% against the yen and 3.9% against the dollar. One-month EUR/JPY options charge 1.80 vol points more for protection against a falling euro than for a rising one. On EUR/USD the gap is 0.25.
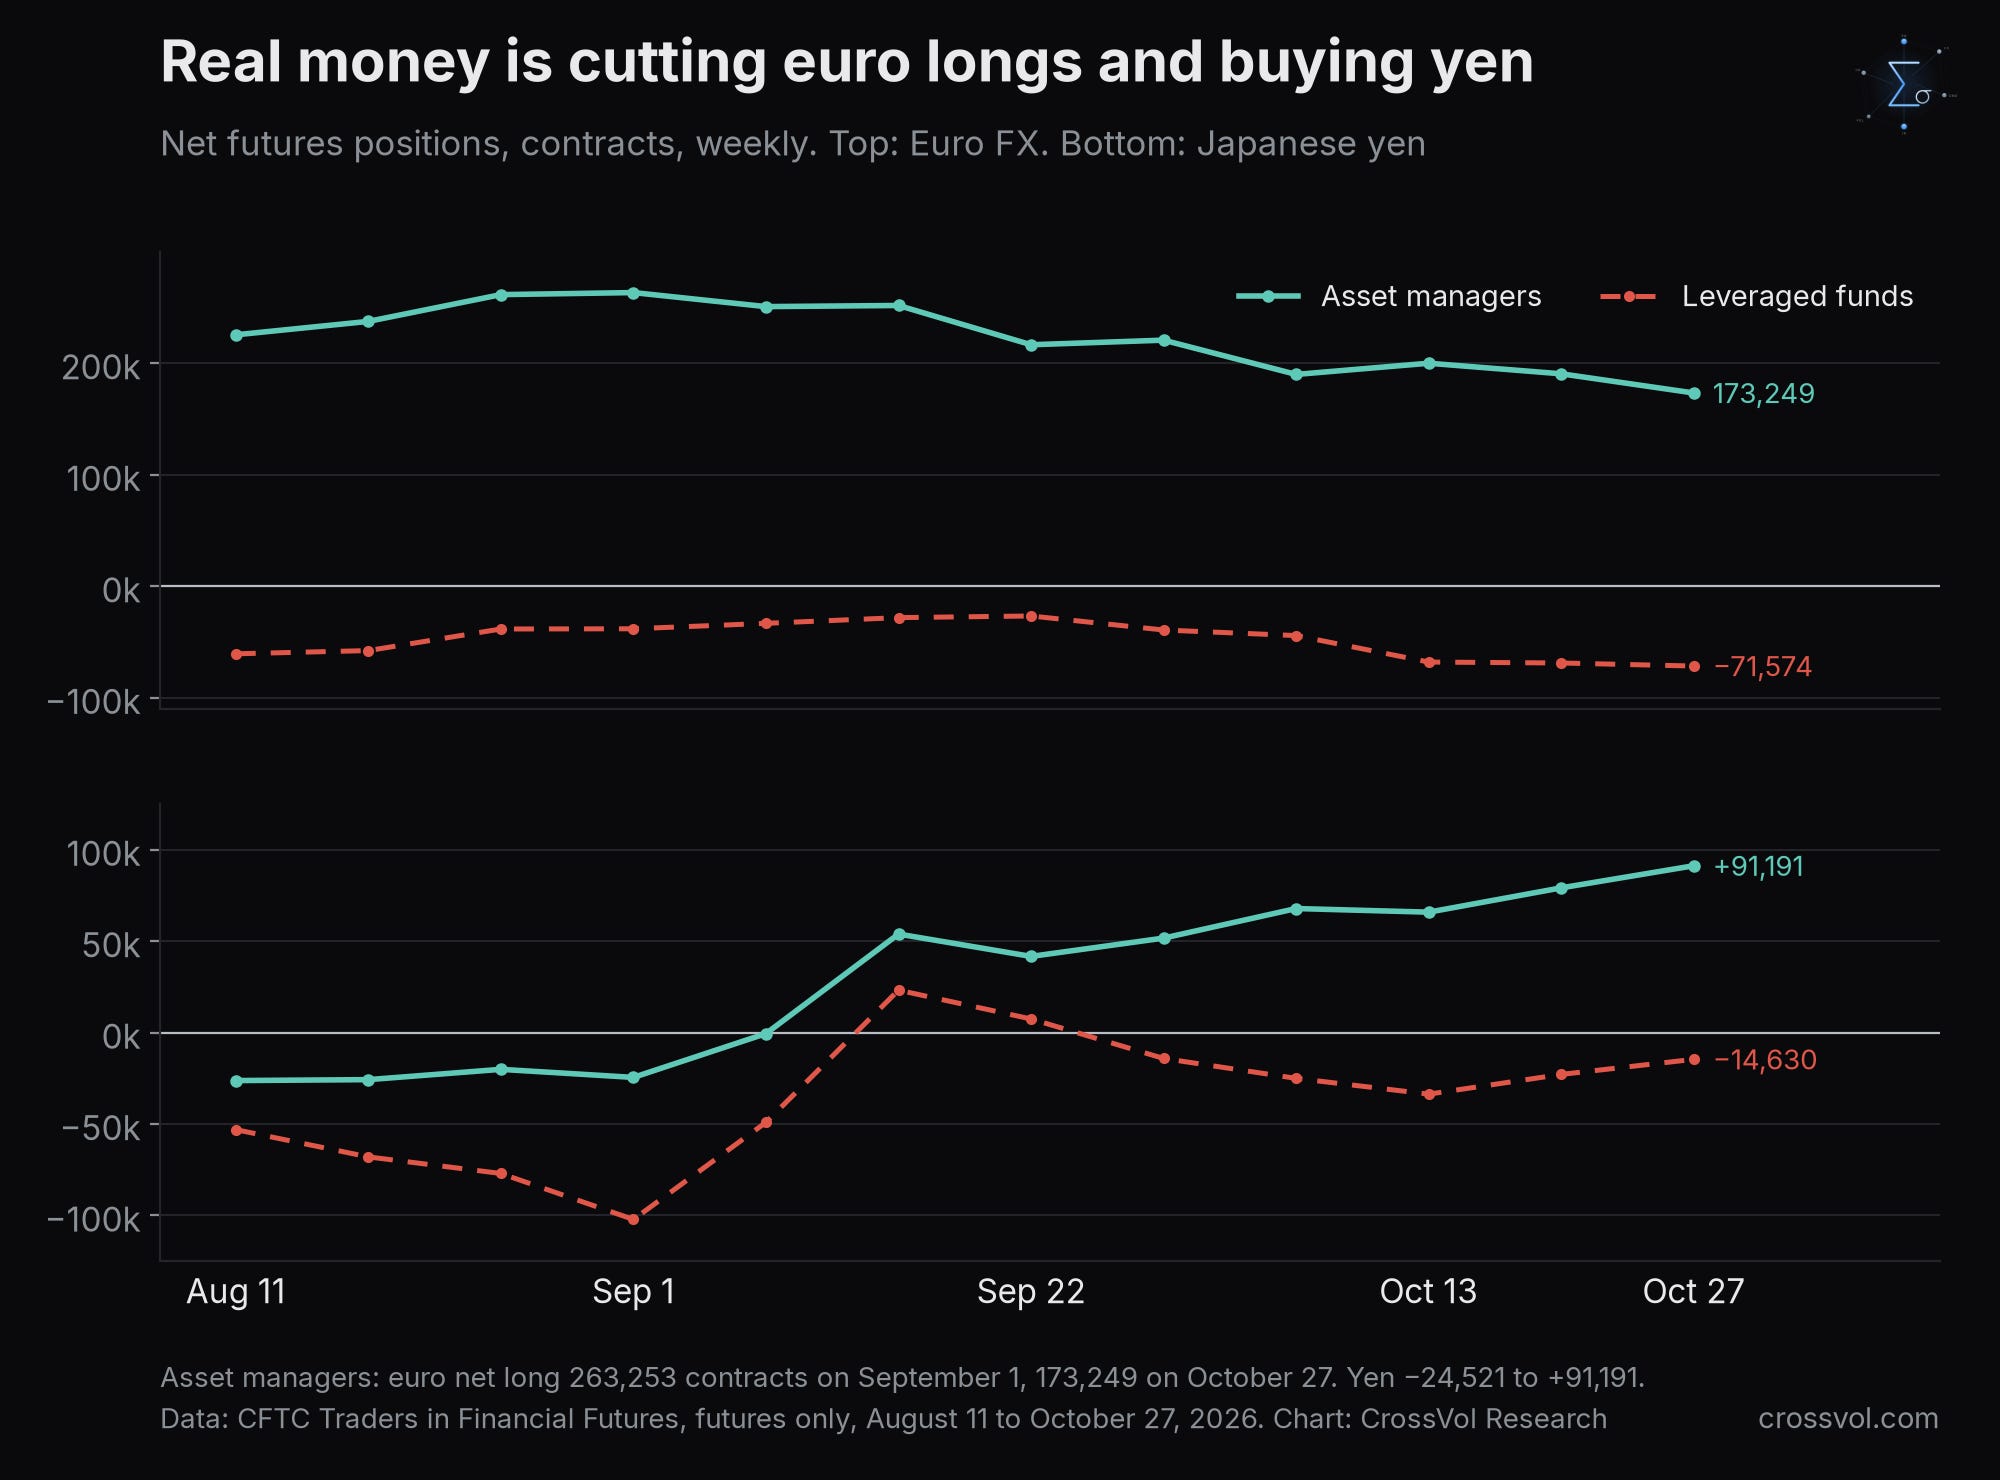
Real money is still long the euro. Asset managers held a net long of 173,249 euro futures on October 27, about €21.7 billion, down from 263,253 on September 1. Hedge funds are short and adding. In the yen, asset managers swung from 24,521 contracts short to 91,191 long.
The chart agrees. EUR/JPY trades below its 50, 100 and 200-day moving averages, and the 50-day has crossed below the other two.
What would change my mind: an OAT-Bund spread back below 150 bp, a 3-month basis back above zero against overnight rates, or a EUR/JPY close above its 50-day average, now 179.30.
Why is the euro falling? France's risk premium nearly doubled in two months
A currency also carries the credit of the governments that borrow in it. When investors start to doubt the second largest of them, the euro pays. The cleanest gauge of French risk is the OAT-Bund spread: the gap between the yield on 10-year French government bonds, called OATs, and the yield on 10-year German Bunds, the euro area's safe-haven bond.
On Bloomberg's generic 10-year yields, France closed October 30 at 4.972% and Germany at 3.322%, a spread of 165 bp. It was 85 bp on August 31 and 127 bp on September 30. It closed at 174 bp on October 22, and in the same week it reached 178 bp during the session, its highest since the 2011 euro debt crisis. Italy's 10-year yield closed at 4.513%. France pays 46 bp more than Italy.
The move came from both sides. In October the French 10-year yield rose 11.5 bp while the German 10-year fell 26.4 bp. Part of the Bund rally came with global bonds, which also rallied in October. The divergence is the point: French yields rose while German yields fell, inside the same currency. That is what a risk premium looks like.
The rating agencies have noticed. On Friday evening Fitch revised France's outlook to negative and kept the rating at A+, the grade S&P also gives it. Moody's kept France at Aa3 with a negative outlook on October 23. The background is the one I described on October 25: a deficit of 5.4% of GDP this year, no majority for the 2027 budget, and a presidential election in about six months.
The euro has traded this risk closely. Since August 31, the correlation between the daily closes of the OAT-Bund spread and EUR/USD is minus 0.94. A correlation of levels flatters two series that trend at the same time, so here is the stricter test: on daily changes it is minus 0.38. That is still a meaningful link for a currency pair that moves on dozens of drivers. Against EUR/JPY, shown below, the two figures are minus 0.79 and minus 0.24.
The stress has reached dollar funding
The second step matters more for the months ahead. Conks, whose work on dollar funding is among the most careful I read, flagged it this week: the French scare now shows up in the cross-currency basis. I checked it on Bloomberg.
What the basis is. A European bank or company that needs dollars can borrow them directly or swap euros into dollars, a route used on a huge scale. It hands over euros today, receives dollars, and reverses the exchange later at a price fixed today. In a frictionless market this swap would cost exactly the difference between euro and dollar interest rates. That rule is covered interest parity, which the Bank for International Settlements called "the closest thing to a physical law in international finance." The cross-currency basis measures how far the market is from it. When the basis is negative, whoever swaps euros into dollars accepts less than the euro interest rate to get them. Dollars carry a premium, and the more negative the basis, the higher the premium.
What Bloomberg shows. I computed the 3-month basis against overnight rates from Bloomberg's EUR/USD forward points and the 3-month SOFR and €STR swap rates. This is the measure closest to the pure dollar premium. It was zero at the end of August, at minus 0.03 bp. It turned negative in the last week of September, as the OAT spread jumped, and closed September at minus 2.5 bp. It reached minus 4.8 bp on October 23, the day after the OAT spread's closing high, and ended the week at minus 3.6 bp. These are end-of-day quotes from several screens, so a basis point of day-to-day noise is normal.
Two cautions, because precision matters here.
First, these are small numbers. Minus 4 bp is a first crack in the plumbing.
Second, the 3-month tenor now spans the end of the year, when banks shrink their balance sheets and dollar funding usually gets dearer around the year end. Part of the move is that calendar effect. The 1-month basis, which does not reach December 31 yet, was still positive on Friday, at plus 1.8 bp. But the turn did not wait for the calendar. The basis first dipped on September 23, the day the OAT spread jumped 6 bp, and it was already at minus 2.7 bp on September 28, before the 3-month window crossed December 31.
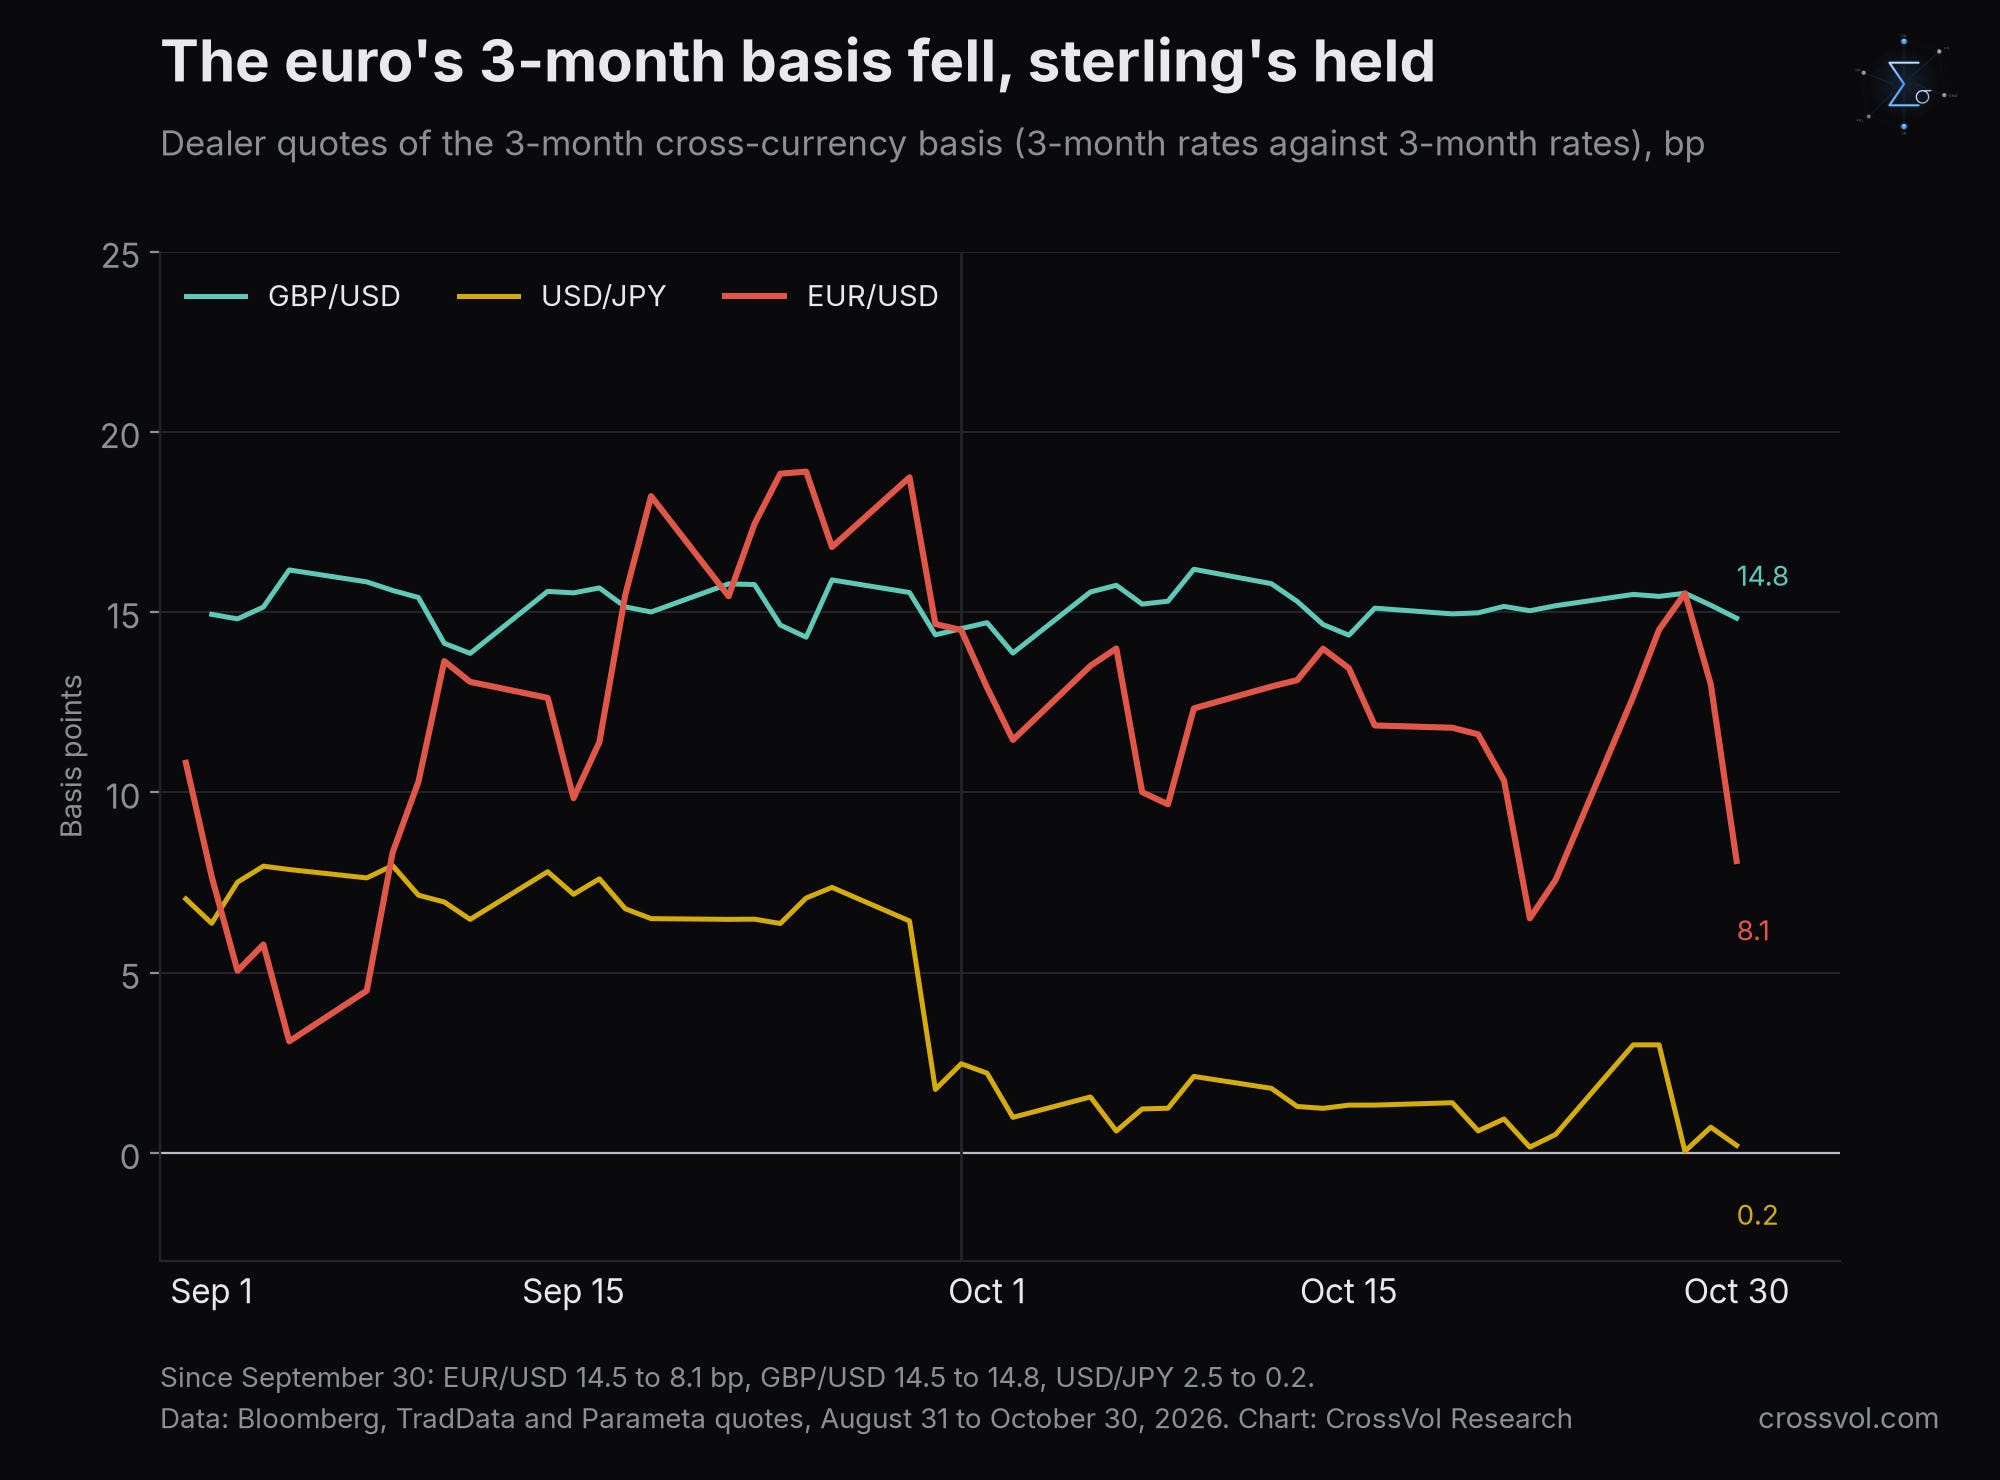
Is it the euro or the dollar? The test is to compare currencies. Bloomberg also carries dealer quotes for the standard 3-month basis swap. That contract is set against 3-month Euribor on the euro side rather than overnight rates, so its level sits higher, but its moves tell the same story. The euro quote fell from 14.5 bp on September 30 to 8.1 bp on October 30 on TradData's quotes, and from 12.7 bp to 8.6 bp on Parameta's. The sterling quote stayed put, at 14.5 bp then and 14.8 bp now, and the yen quote slipped from 2.5 bp to 0.2 bp (Parameta quotes for both). The euro moved most.
The same data hold one more clue. Euribor, the rate at which European banks lend to each other for three months, rose against the 3-month €STR swap rate, which tracks the expected overnight rate. The gap went from 9.6 bp on September 30 to 13.2 bp on October 30, after 16.3 bp on October 22. It was wider still in early September, so this is a hint rather than proof, but it points the same way: European banks are charging each other a little more for term money.
So this is not a global dollar squeeze. It is a relative bid for dollars coming from Europe. Conks expects dollar abundance to pull the short end of the basis back up, and that may well happen. Until it does, the basis tells us the French scare has moved from bond desks to funding desks. Funding desks are where forced sales of euros start.
Why the euro falls most against the yen
If Europe is the problem, why not simply sell EUR/USD? Because the yen has three things going for it that the dollar does not, and a fourth, carry, is turning its way.
The trend. Since August 31, EUR/JPY is down 5.3% and EUR/USD 3.9%. The dollar has lost ground against the yen too: USD/JPY went from 159.74 to 157.56. Since September 30 the euro has fallen by about the same amount against both, 1.4% against the yen and 1.5% against the dollar, but the yen leg sits on the longer and cleaner trend.
The carry. The cushion for euro holders is thin. One-month €STR swaps yield 2.44%, against the Bank of Japan's policy rate of 1.25%, so a long EUR/JPY position earns about 1.2 points a year, and the 1.4% fall since September 30 has already wiped out more than a year of it. Selling EUR/JPY does cost that carry, while selling EUR/USD earns about 1.5 points. But the cost is shrinking. The Bank of Japan held on October 30, one board member voted for a hike, the Bank repeated that it will keep raising rates, and swaps price a December hike at 81%.
The flows. Japanese investors were net sellers of foreign bonds for six weeks in a row through October 24, about ¥3.5 trillion in total, according to Japan's Ministry of Finance. The pace slowed each week, but the money is still leaving foreign bonds.
The options. A risk reversal compares the implied volatility of an option that pays if a currency pair falls with one that pays if it rises, both equally far out of the money (25 delta, in market terms). It is quoted in volatility points, call minus put. Negative means protection against a fall costs more. On Friday the one-month 25-delta risk reversal was minus 1.80 on EUR/JPY and minus 0.25 on EUR/USD. One-month at-the-money implied volatility was 7.31% on EUR/JPY and 5.84% on EUR/USD. The premium for euro downside over euro upside is seven times larger against the yen than against the dollar.
What options say, and why that is the opportunity
Options on EUR/USD are not priced for an imminent euro drop, and that deserves a careful reading.
On October 1, the day the OAT spread jumped 14 bp, from 127 bp to 141 bp, the one-month EUR/USD risk reversal fell to minus 1.47 and one-month implied volatility rose to 6.96%. Since then both have relaxed, to minus 0.25 and 5.84% on Friday. Yet the OAT spread is 24 bp wider than it was on October 1. The bond and funding markets kept the stress. The EUR/USD options market let it go. The 3-month risk reversal tells the same story, from minus 1.31 on October 1 to minus 0.52.
EUR/JPY options kept more of their skew. Since September 30 the one-month risk reversal went from minus 2.44 to minus 1.80, keeping about three quarters of its level, while the EUR/USD one went from minus 0.81 to minus 0.25. EUR/JPY implied volatility fell from 8.52% to 7.31%. The premium for euro downside against the yen is still there.
This is why I keep selling the rallies. The market is not paying up yet for the scenario where French stress keeps moving into funding. If the basis keeps falling, the repricing of euro downside in options is the next step, and it would most likely start where the skew already leans, in EUR/JPY.
Who still has to sell euros
The weekly positioning report of the Commodity Futures Trading Commission (CFTC) splits futures holders into categories. Two matter here: asset managers, the slow real money, and leveraged funds, mostly hedge funds.
In euro futures, asset managers held a net long of 173,249 contracts on October 27. That was 220,603 on September 29 and 263,253 on September 1. They have cut 90,004 contracts in eight weeks, yet they still hold about €21.7 billion of net long euro exposure. Leveraged funds were net short 71,574 contracts, against 39,265 on September 29. They have almost doubled their short in four weeks.
In yen futures the picture is the mirror image. Asset managers moved from a net short of 24,521 contracts on September 1 to a net long of 91,191 on October 27, about ¥1.14 trillion. Leveraged funds cut their short from 102,188 contracts to 14,630.
The euro long is the crowded position that is still unwinding. Each week it shrinks, someone has sold euros. The yen side has real money behind it. The risk on that side is the reverse: a yen long that keeps growing can unwind fast if the Bank of Japan disappoints in December.
The chart: EUR/JPY below every average
The Bloomberg chart at the top of this piece shows the full year. EUR/JPY peaked at 187.60 on April 15 and averaged 182.95 over the twelve months. It broke down at the start of September and has stayed below its 50-day moving average since. The 50-day average, now 179.30, has crossed below the 100-day (182.01) and the 200-day (183.25), the configuration chartists call a death cross.
The October rallies are the part I watch most closely. EUR/JPY bounced to a close of 178.00 on October 6 and of 177.73 on October 19 and 20. Both stalled below the September 30 close of 178.35. Lower highs, then a new low at 175.72: that is a trend.
Levels and what would change my mind
EUR/JPY. The October rallies stopped at 178.00 and 177.73, below the September 30 close of 178.35. That zone, then the 50-day average at 179.30, is where I have been selling. A close above 179.30 would put EUR/JPY back above its 50-day average and I would step aside. On the downside, 175.72, last week's close, is the one-year low.
OAT-Bund spread. A close above the October 22 closing high of 174 bp would mark the next leg. A close back below 150 bp would mean the political premium is leaking out, as I wrote on October 25.
3-month basis against overnight rates. A close below minus 5 bp outside a quarter end would show the funding stress spreading. Back above zero, it is fading.
EUR/USD options. A one-month risk reversal back below minus 1 would show the options market catching up with bonds and funding.
Positioning. The next CFTC report, for positions on November 3, comes out on Friday, November 6. Each weekly cut in the asset managers' euro long is euro supply.
FAQ
Why is the euro falling? Because investors are charging France a growing risk premium. The 10-year OAT-Bund spread nearly doubled, from 85 bp on August 31 to 165 bp on October 30, and France now pays more than Italy to borrow. The stress has spread to dollar funding, where the 3-month EUR/USD cross-currency basis, measured against overnight rates, turned negative.
Why is the euro falling against the yen? Holding euros against yen pays only about 1.2 points a year, the Bank of Japan is moving toward a hike, Japanese investors have been selling foreign bonds, and asset managers have swung to long yen. Options price far more euro downside against the yen than against the dollar.
What is the cross-currency basis? It is the extra cost, or saving, of getting dollars by swapping another currency rather than borrowing them directly. A negative EUR/USD basis means Europeans pay a premium for dollars. Measured against overnight rates, it went from zero at the end of August to minus 4.8 bp on October 23.
Do options confirm a euro sell-off? Not on EUR/USD, where the one-month risk reversal is back to minus 0.25 and implied volatility is 5.84%. Partly on EUR/JPY, where the risk reversal is still minus 1.80, seven times the EUR/USD reading.
What would stop the euro's slide? An OAT-Bund spread back below 150 bp, a 3-month basis back above zero against overnight rates, or a EUR/JPY close above its 50-day average at 179.30.
A note to readers. From next week, CrossVol Research becomes a paid publication, at $15 a month. I will give the details in a short note next week, including what stays free and what is for paid subscribers. Thank you to everyone who has read and shared these pieces, and to those who have already pledged to support them.
This article is for educational purposes only. It is not investment advice, a solicitation, or an offer to buy or sell any security or derivative. Levels are as of the dates and times stated and can change quickly. Currencies, bonds, options and futures carry a high risk of loss. The move in the cross-currency basis was flagged this week by Conks. The measurements, the reading and the views here are the author's own.