


By Djellal Djouad. October 30, 2026, after the US close.
Market commentary for educational purposes. This is not investment advice and not a recommendation to buy or sell anything. Levels are as of the dates and times given, markets move fast, and bonds, credit, equities, currencies and derivatives can lose far more than you expect.
A note to readers: from next week, CrossVol Research becomes a paid publication, at $15 a month. More at the end of this piece.
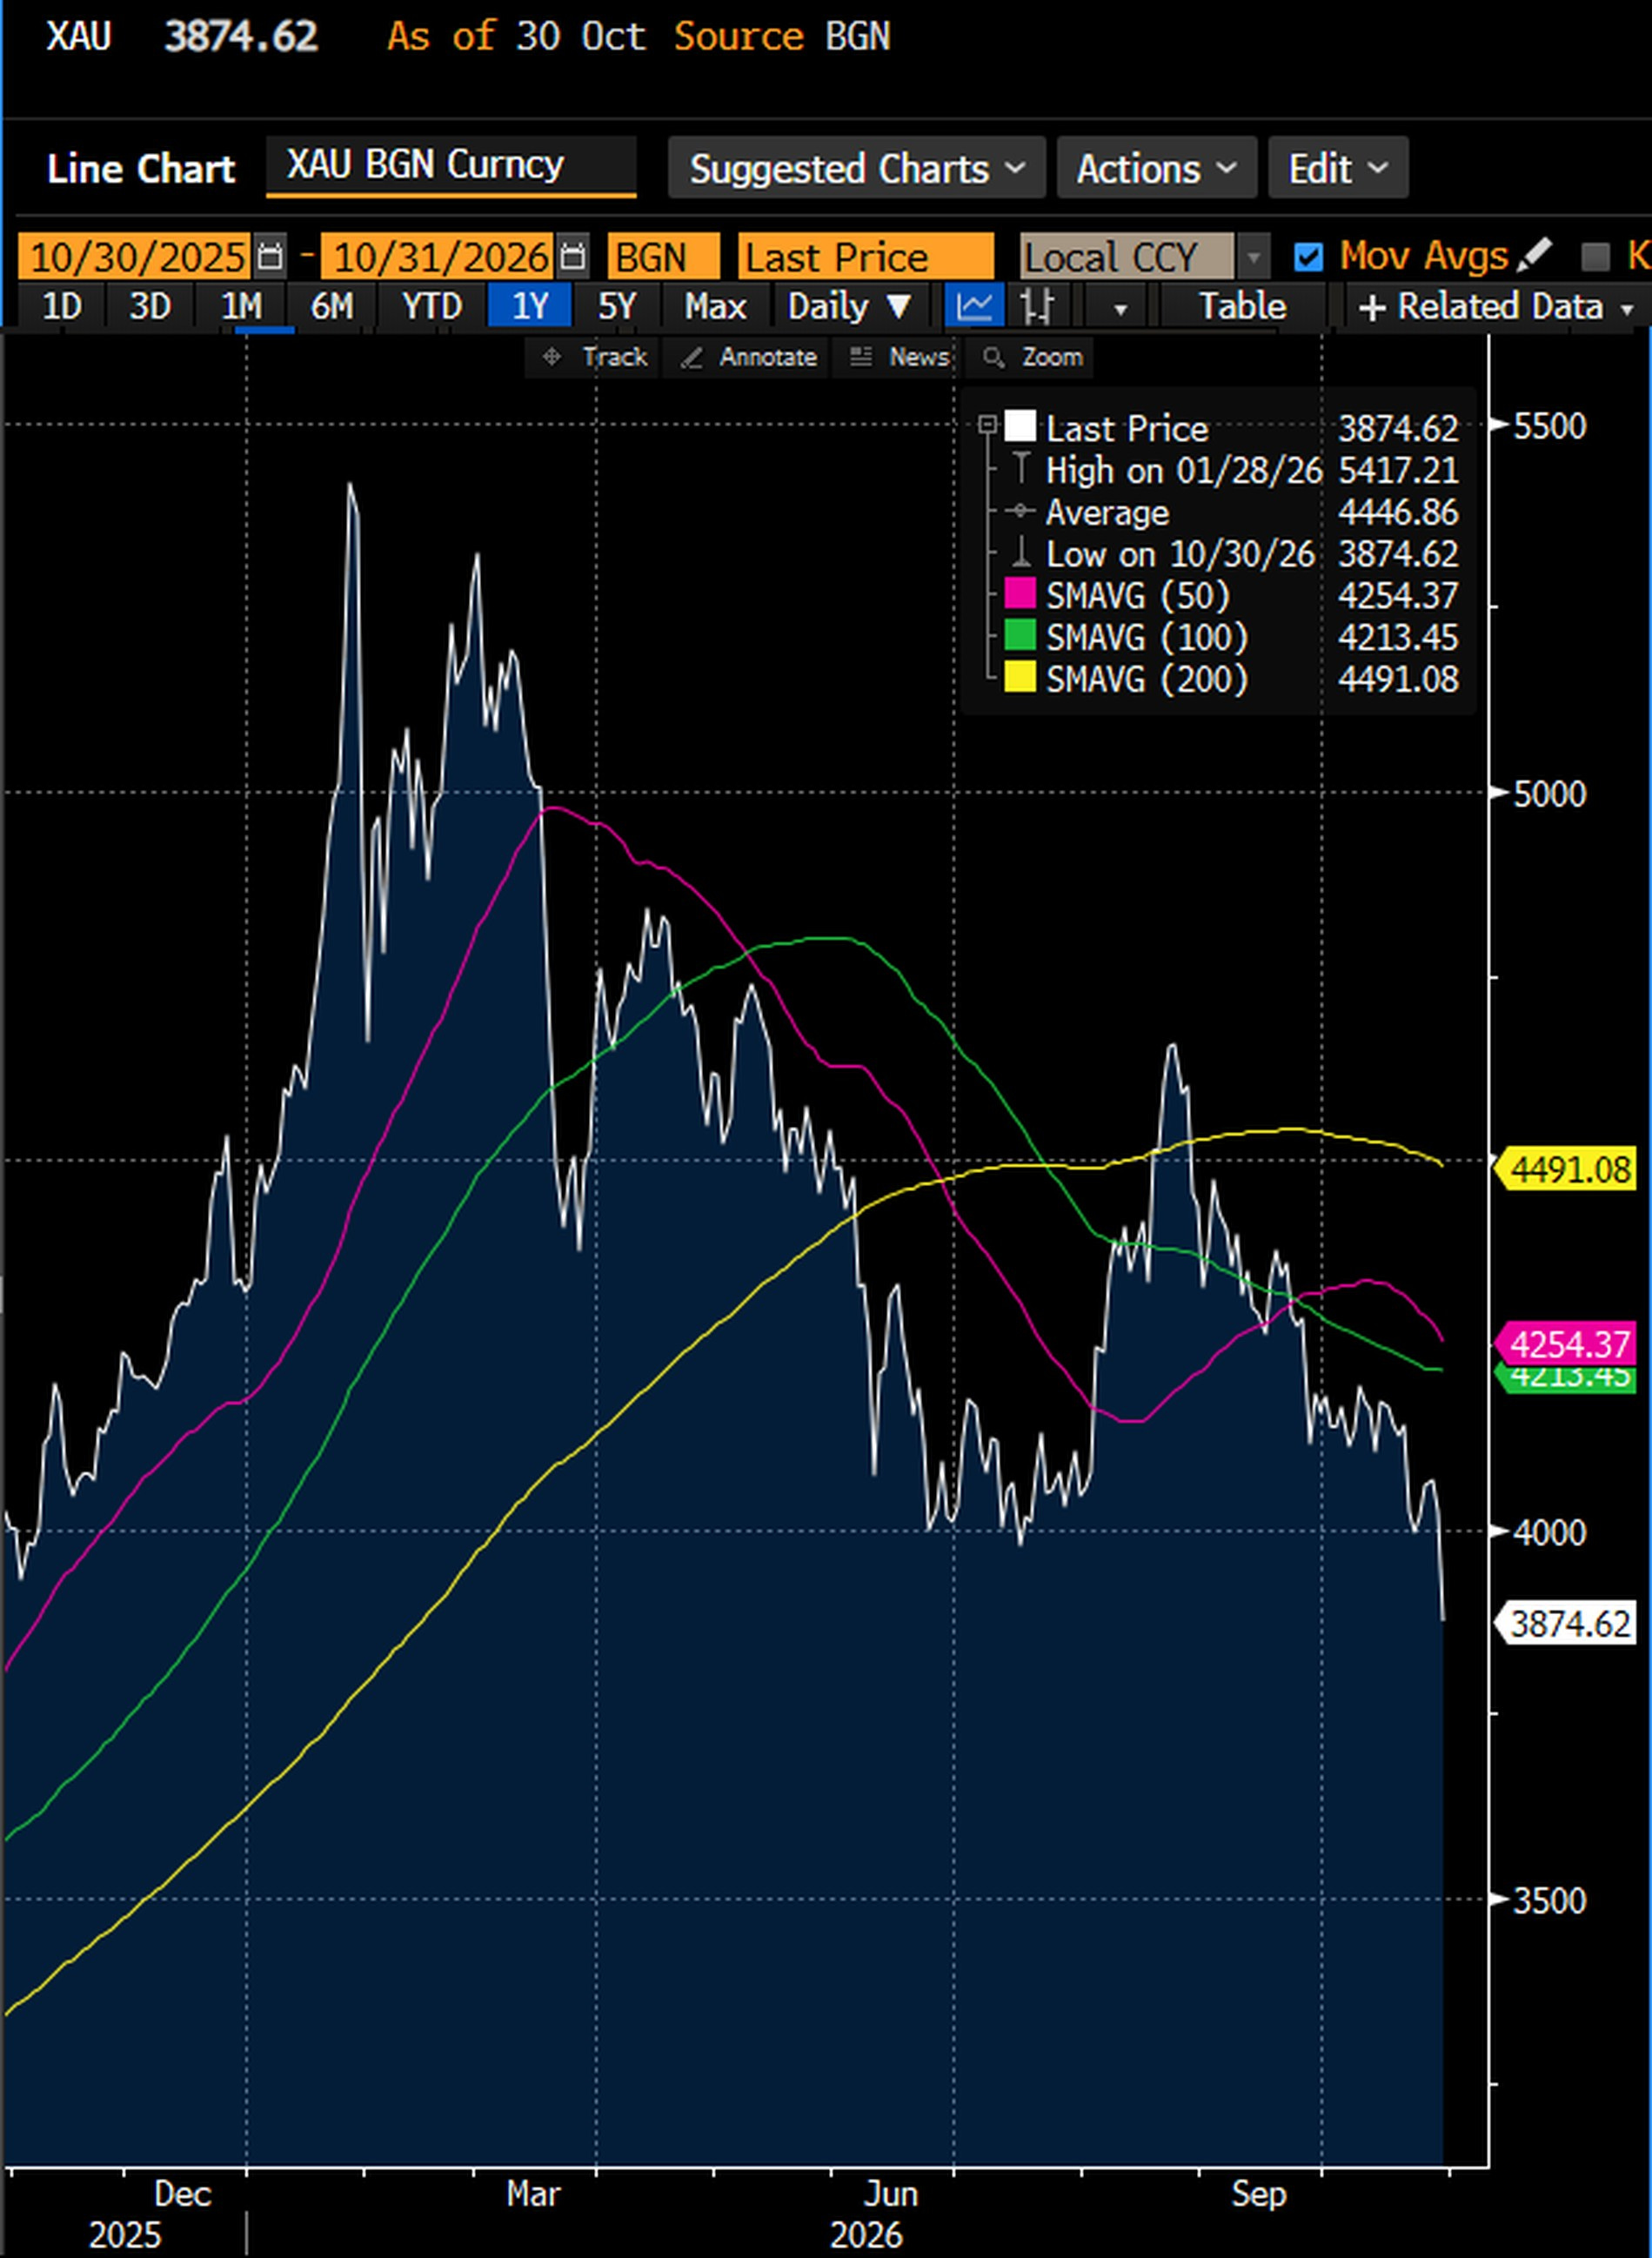
For a month the market has been pricing a US slowdown one asset at a time. Credit went first, in the bonds of the companies that borrowed to build artificial intelligence. The AI stocks followed, on their results. Defensive sectors took the money, and Treasuries began to hedge equities again. One asset had held its lows: gold. It slipped through October and fell on all three sell off days, but it did not break. On Friday it broke. Spot gold closed at $3,874.62, down $146.90 on the day, below its one year low of $3,932.09 of November 4, 2025, and 28.5% below its record close of $5,417.21 on January 28.
That was the last piece, and it was sold for cash, which is how a slowdown starts. The market has started to price a US slowdown, led by AI, and what makes this one dangerous is what comes with it.
Inflation is not under control. The PCE price index rose 3.6% in the year to September, and the energy shock behind it is still running.
The Fed held on Wednesday with two votes for a hike, and futures still price a hike in December.
The Bank of Japan held on Friday, but with one vote for a hike and a promise to keep raising rates, and swaps now price a December hike at 81%. That puts the yen carry trade on notice, and Japanese money has been leaving foreign bonds for six weeks.
Credit is under stress where the leverage is, in AI borrowers and private credit, and after Friday's close S&P revised the outlook on Meta's AA- rating to negative, and Fitch did the same for France.
Hedge funds are cutting their gross exposure. They came into October with gross leverage near the top of its five year range and a record share of their books in the Magnificent 7, and they are now shrinking those books, longs and shorts together.
The hedge funds' Treasury basis trade stands in the way of a bond market that has become a haven again, pushed by trend followers covering their shorts and, I think, by pension money.
On Tuesday the United States votes, and prediction markets give Congress to the Democrats. If President Trump loses it, I expect him to blame them for the slowdown.
Put together, these point to one risk for 2027: stagflation, an economy that stalls while inflation stays high. It is the worst mix for a central bank, because the tool that fights one feeds the other.
This piece takes them one by one, with the data, what our scanner confirms, what it does not confirm yet, and the levels I watch.
Where we were on October 13
On October 13 I mapped October 2026 onto the five acts of "The Script," Andy Constan's play about the end of a tightening cycle. The acts are his. Andy runs Damped Spring Advisors and writes here as Damped Spring. In his report of July 10, 2023, the hikes of Act 1 "don't achieve goal," in Act 2 "long end yields rise to new highs," in Act 3 higher yields compress valuations, in Act 4 the tightening hits demand and earnings contract, and in Act 5, "as equities sell off, companies fire workers." The reading of 2026 that follows is mine, not his.
My verdict then was: "early Act 4, through credit. The indices will see it last." Seventeen days later, here is what has played.
Act 2 reversed. The 10 year Treasury yield closed at 5.31% on October 5, its highest close since May 2002, and at 4.98% on October 29. The New York Fed's estimate of the 10 year term premium, the extra yield investors demand to lock their money up for ten years instead of rolling short bills, fell from 98.5 basis points on October 7 to 69.1 on October 28. A basis point, or bp, is one hundredth of a percentage point.
Act 4 moved from credit to stocks, inside AI. Oracle's five year credit default swap, the annual price of insurance against its default, set a record of 329 bp on October 20. CoreWeave's peaked at 1,163 bp on October 22. Then came the results. Since October 13 Alphabet has lost 20.9% and Meta 19.3%, Meta after its spending plan on October 22, Alphabet after its results on October 28.
The indices are only starting to see it. On October 29 the S&P 500 ETF (SPY) was only 1.1% below its October 13 close and 1.2% below its closing high of October 6. The equal weighted S&P 500 ETF (RSP), in which every stock counts the same, had gained 3.2% since October 13. On Friday the cap weighted index moved, after Amazon and Intel: the S&P 500 closed 1.82% lower and the Nasdaq 100 3.46% lower, and the VIX closed at 19.42 after touching 23.93. SPY ended the week 3.0% below its October 6 high, while RSP was still 2.3% above its October 13 close.
Act 5 has not started. Companies are not firing in large numbers yet: announced job cuts are down 39% from last year and jobless claims are near their lows. That is the part of the play that 2027 will decide, and I come back to it at the end.
Why gold is falling: the last piece
Gold is the last piece because of the order in which things break. In a slowdown the market does not sell gold because growth is weak. It sells gold because it needs cash, and gold, the great winner of 2025, is where the cash is. Gold slipped all through October, but it held its lows until Friday.
The levels at Friday's close. Spot gold ended below its 50, 100 and 200 day averages, at $4,254.37, $4,213.45 and $4,491.08. COMEX December gold futures closed at $3,884.90, below the contract's previous 2026 closing low of $4,007.90, set on October 23. The largest gold ETF, GLD, lost 3.5% to $355.78, 28.3% below its peak of January 29. It had gained 63.7% in 2025, against 16.4% for the S&P 500 ETF, and winners are what funds sell first when they need cash.
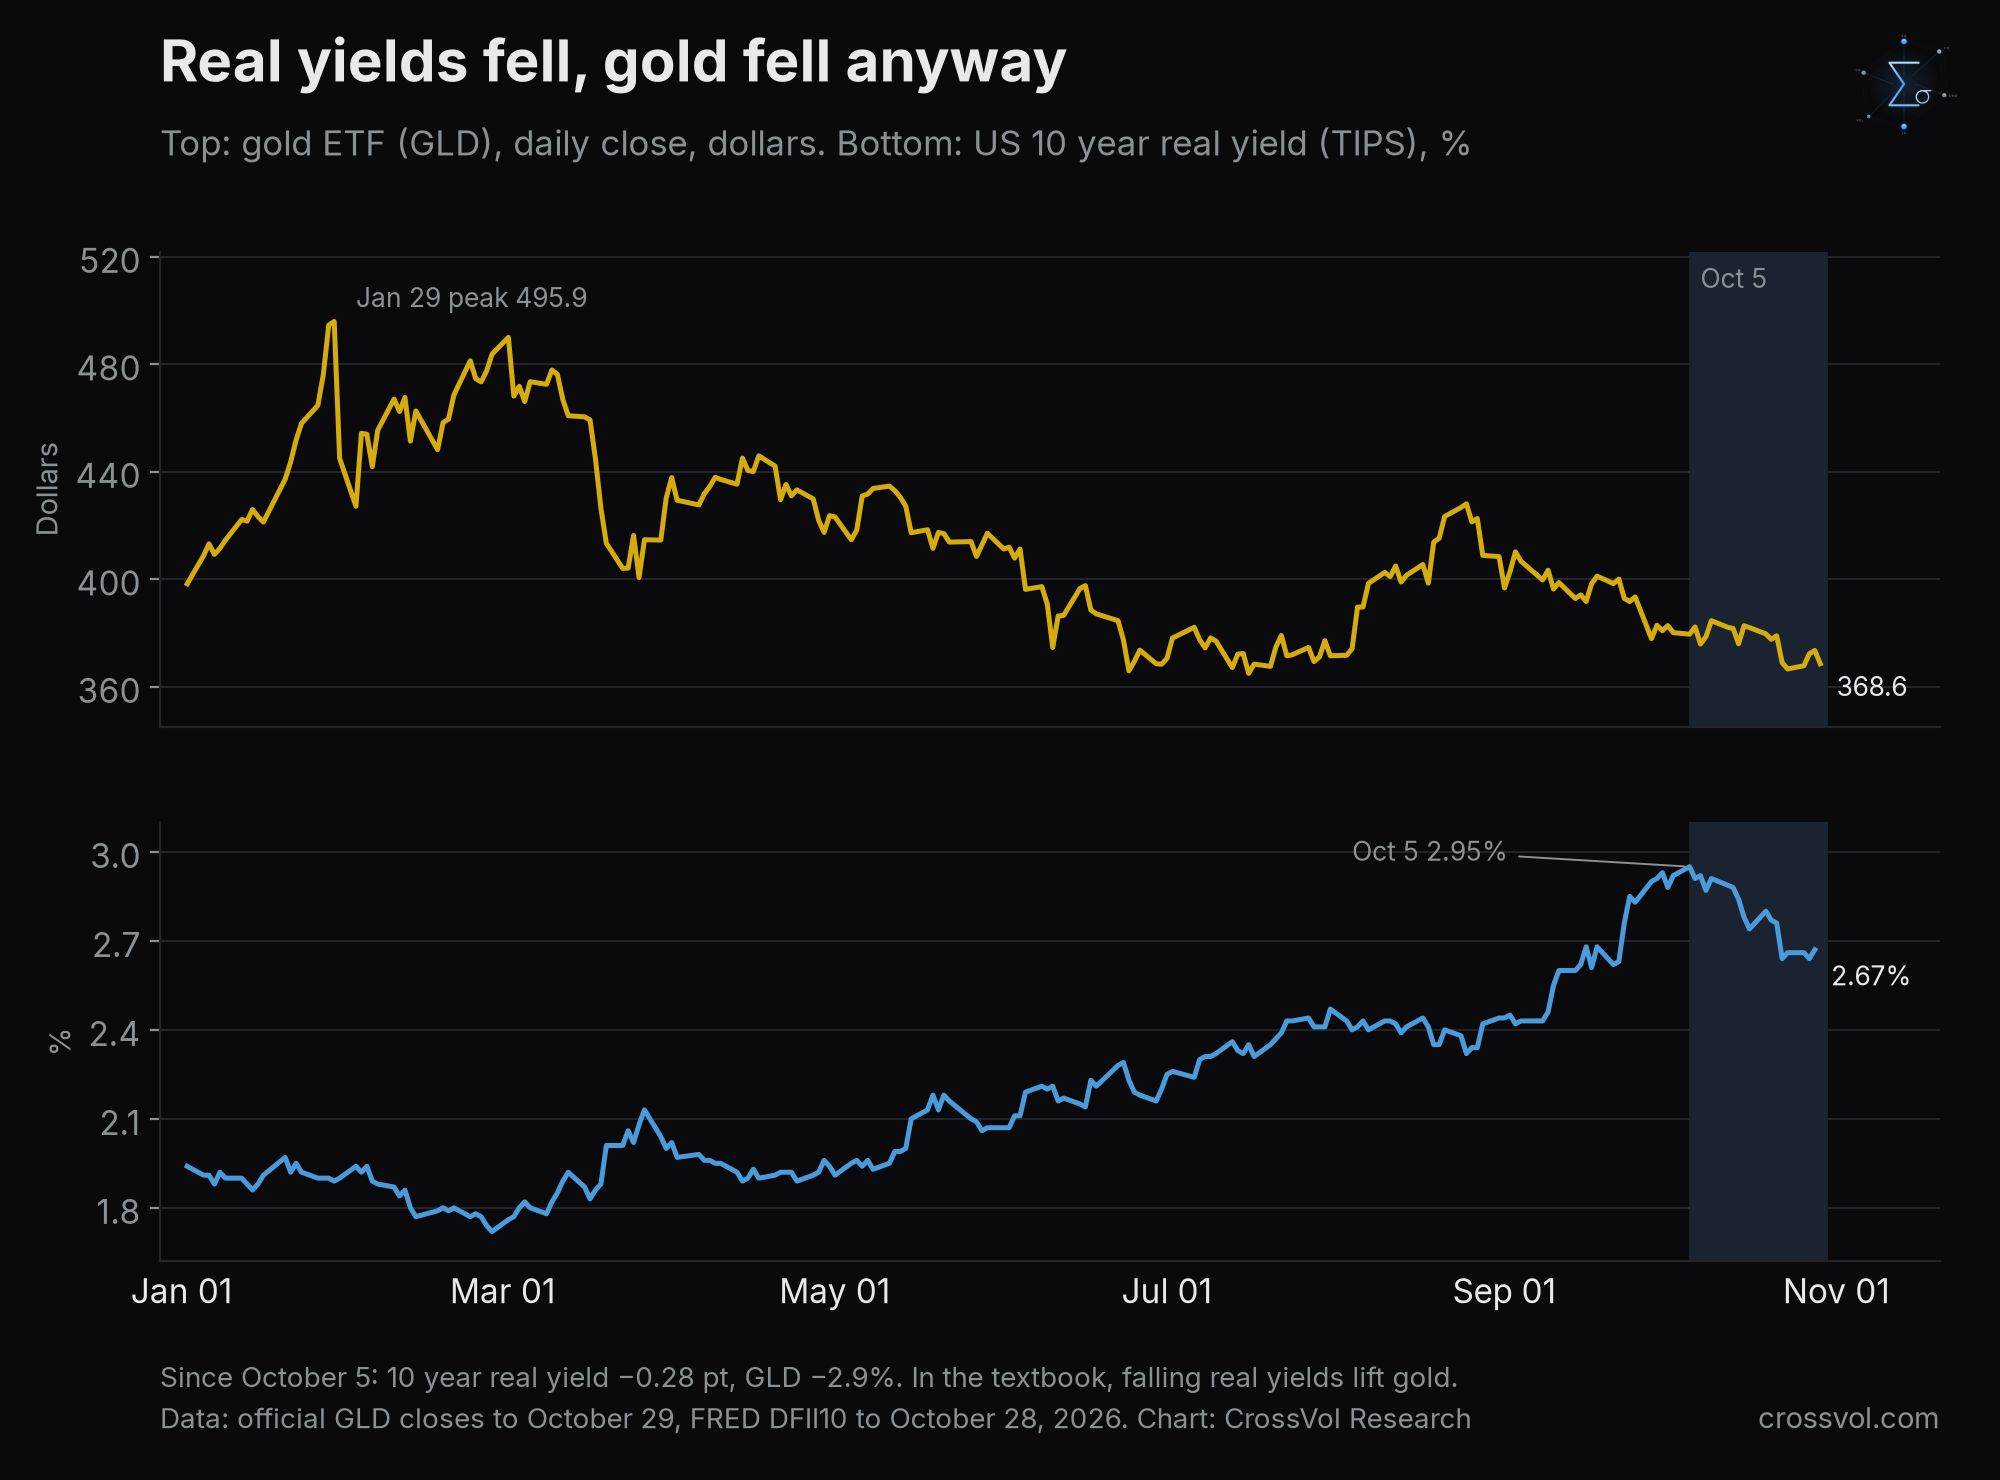
What did not sell it is just as telling. In the textbook, gold falls when real yields rise, because a bar of gold pays nothing and competes with the return of inflation protected Treasuries. A real yield is a Treasury yield after inflation, read on those inflation protected bonds, the TIPS. Since the peak in rates on October 5, the 10 year real yield fell from 2.95% to 2.67% on October 28, the inflation priced for the next five years rose from 2.36% to 2.47%, the dollar index eased from 102.10 to 101.85, and GLD still lost 2.9% to October 29, before Friday's 3.5% fall. Every textbook driver pointed up. Gold went down.
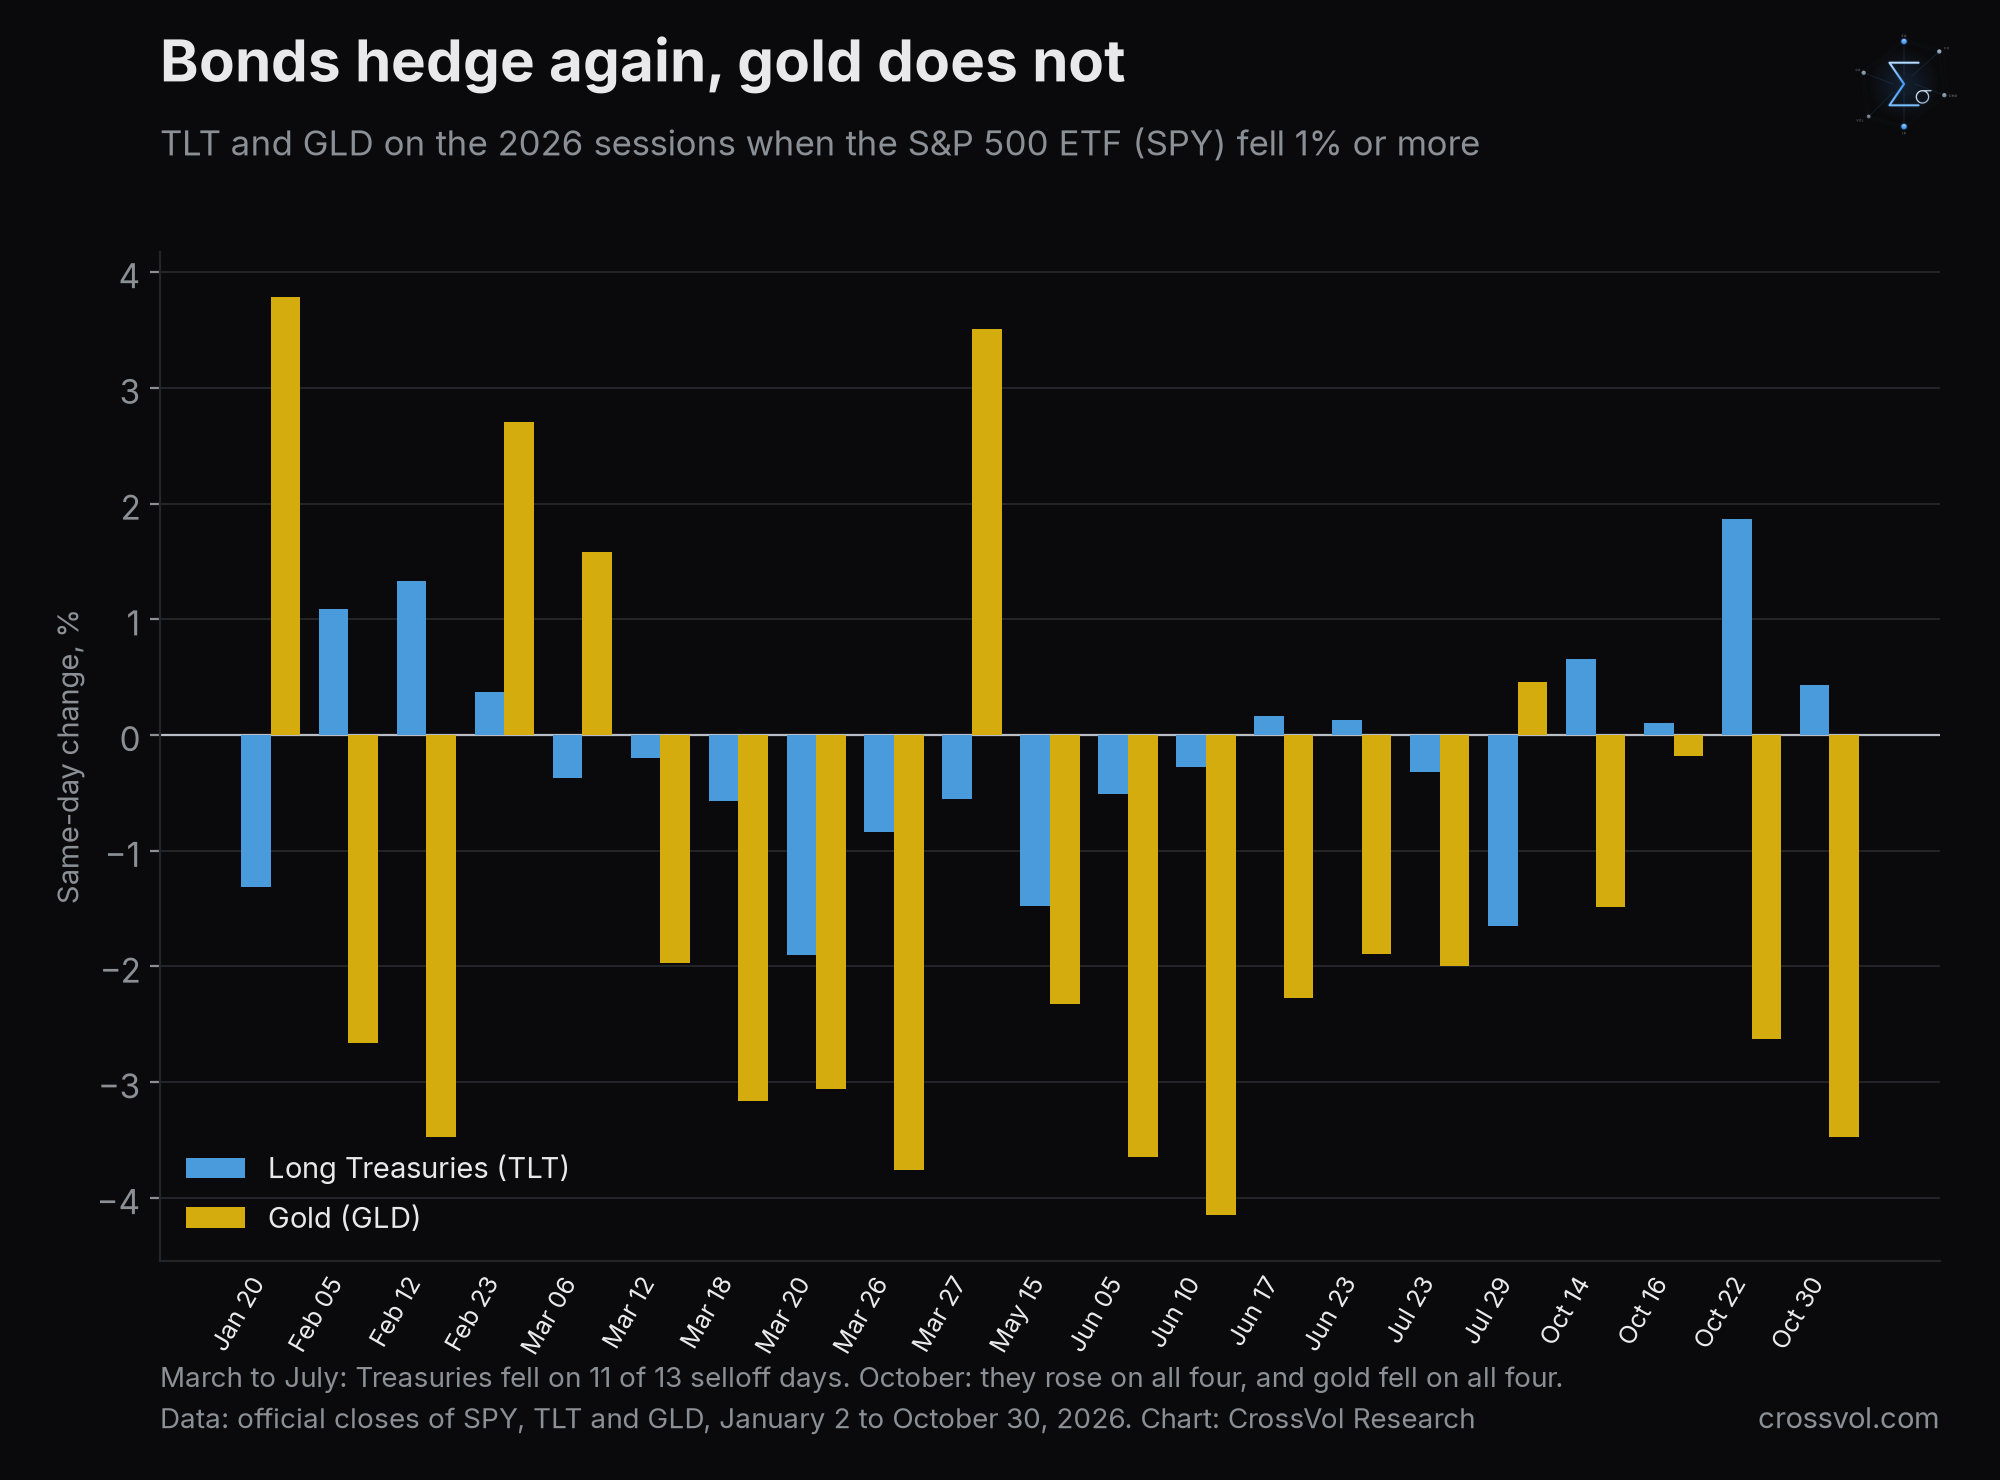
It went down with stocks. In 2026 GLD fell on 16 of the 21 sessions when the S&P 500 ETF lost 1% or more. In October, Treasuries rose on all four of those days and gold fell on all four, Friday included: SPY lost 1.8%, the long Treasury ETF (TLT) gained 0.4% and GLD lost 3.5%. On October 22, the day the 10 year yield fell 17 bp and the real yield 12 bp, GLD lost 2.6%.
Positioning explains the rest. On our trend model, the trend followers, the CTAs, are short gold on all three horizons, close to their most short of the year. Managed money, the CFTC's category for speculative funds, was still net long 104,206 contracts on October 20, worth about $43.2 billion, after eight weekly declines in a row. That long is what remains to be sold if the liquidation goes on.
On October 25 I wrote: "The signal I will watch most closely besides their results is gold: if it keeps falling with yields, liquidity rather than growth is driving the tape." It kept falling with yields. Liquidity is driving the tape. That does not contradict the slowdown. It is how the first phase of one looks.
Two precedents. In 2008, COMEX gold futures lost 29.7% between March 18 and November 13, from $1,003.20 to $704.90, as the recession deepened. They were back at $1,001.80 by February 20, 2009, after the Fed had cut its rate to zero and started to buy bonds. In March 2020, gold lost 11.8% in seven sessions, from $1,674.50 on March 9 to $1,477.30 on March 18, in the dash for cash, then set a record of $2,069.40 on August 6. In both cases gold turned around the time the Fed went all in: in 2008 it bottomed twelve days before the Fed announced its first bond purchases, and in 2020 three days after it cut to zero and restarted them.
This time the Fed is priced to hike in December. That is why gold was the last piece, and why it matters for 2027. The market is pricing a slowdown without a Fed put, the expectation that the central bank will cut rates to rescue markets.
What our scanner says
Our scanner runs every day on about 300 instruments: moves measured in standard deviations, trend signals, bank thematic baskets, credit, volatility and positioning. A standard deviation, or σ, measures the usual size of a move: a move of 2 σ or more, up or down, happens about one month in twenty if moves are normally distributed. I asked the scanner one question: does it confirm that the market is pricing a US slowdown? Its answer is yes for the first half of my thesis, and not yet for the second.
What it confirms:
Rates price slower growth. The 2 year Treasury yield, the one most tied to the Fed's path, fell from 4.92% on September 28 to 4.61% on October 29. The market also removed more than a third of the hikes it priced for the next three years. SOFR is the overnight rate on loans backed by Treasuries, and its futures price where it will be. The contract that covers mid 2029 implied a rate 92 bp above the overnight rate of the day on September 30, and 56 bp above it on October 29.
Defensives rallied by about two standard deviations. In the month to October 29, Goldman Sachs' defensives basket gained 8.5% and its bond proxies basket 8.1%, both about 2.1 σ, while its cyclicals versus defensives pair lost 8.8%, a 1.4 σ move. Utilities gained 8.6%, consumer staples 7.7% and health care 7.8%, while technology lost 3.0%.
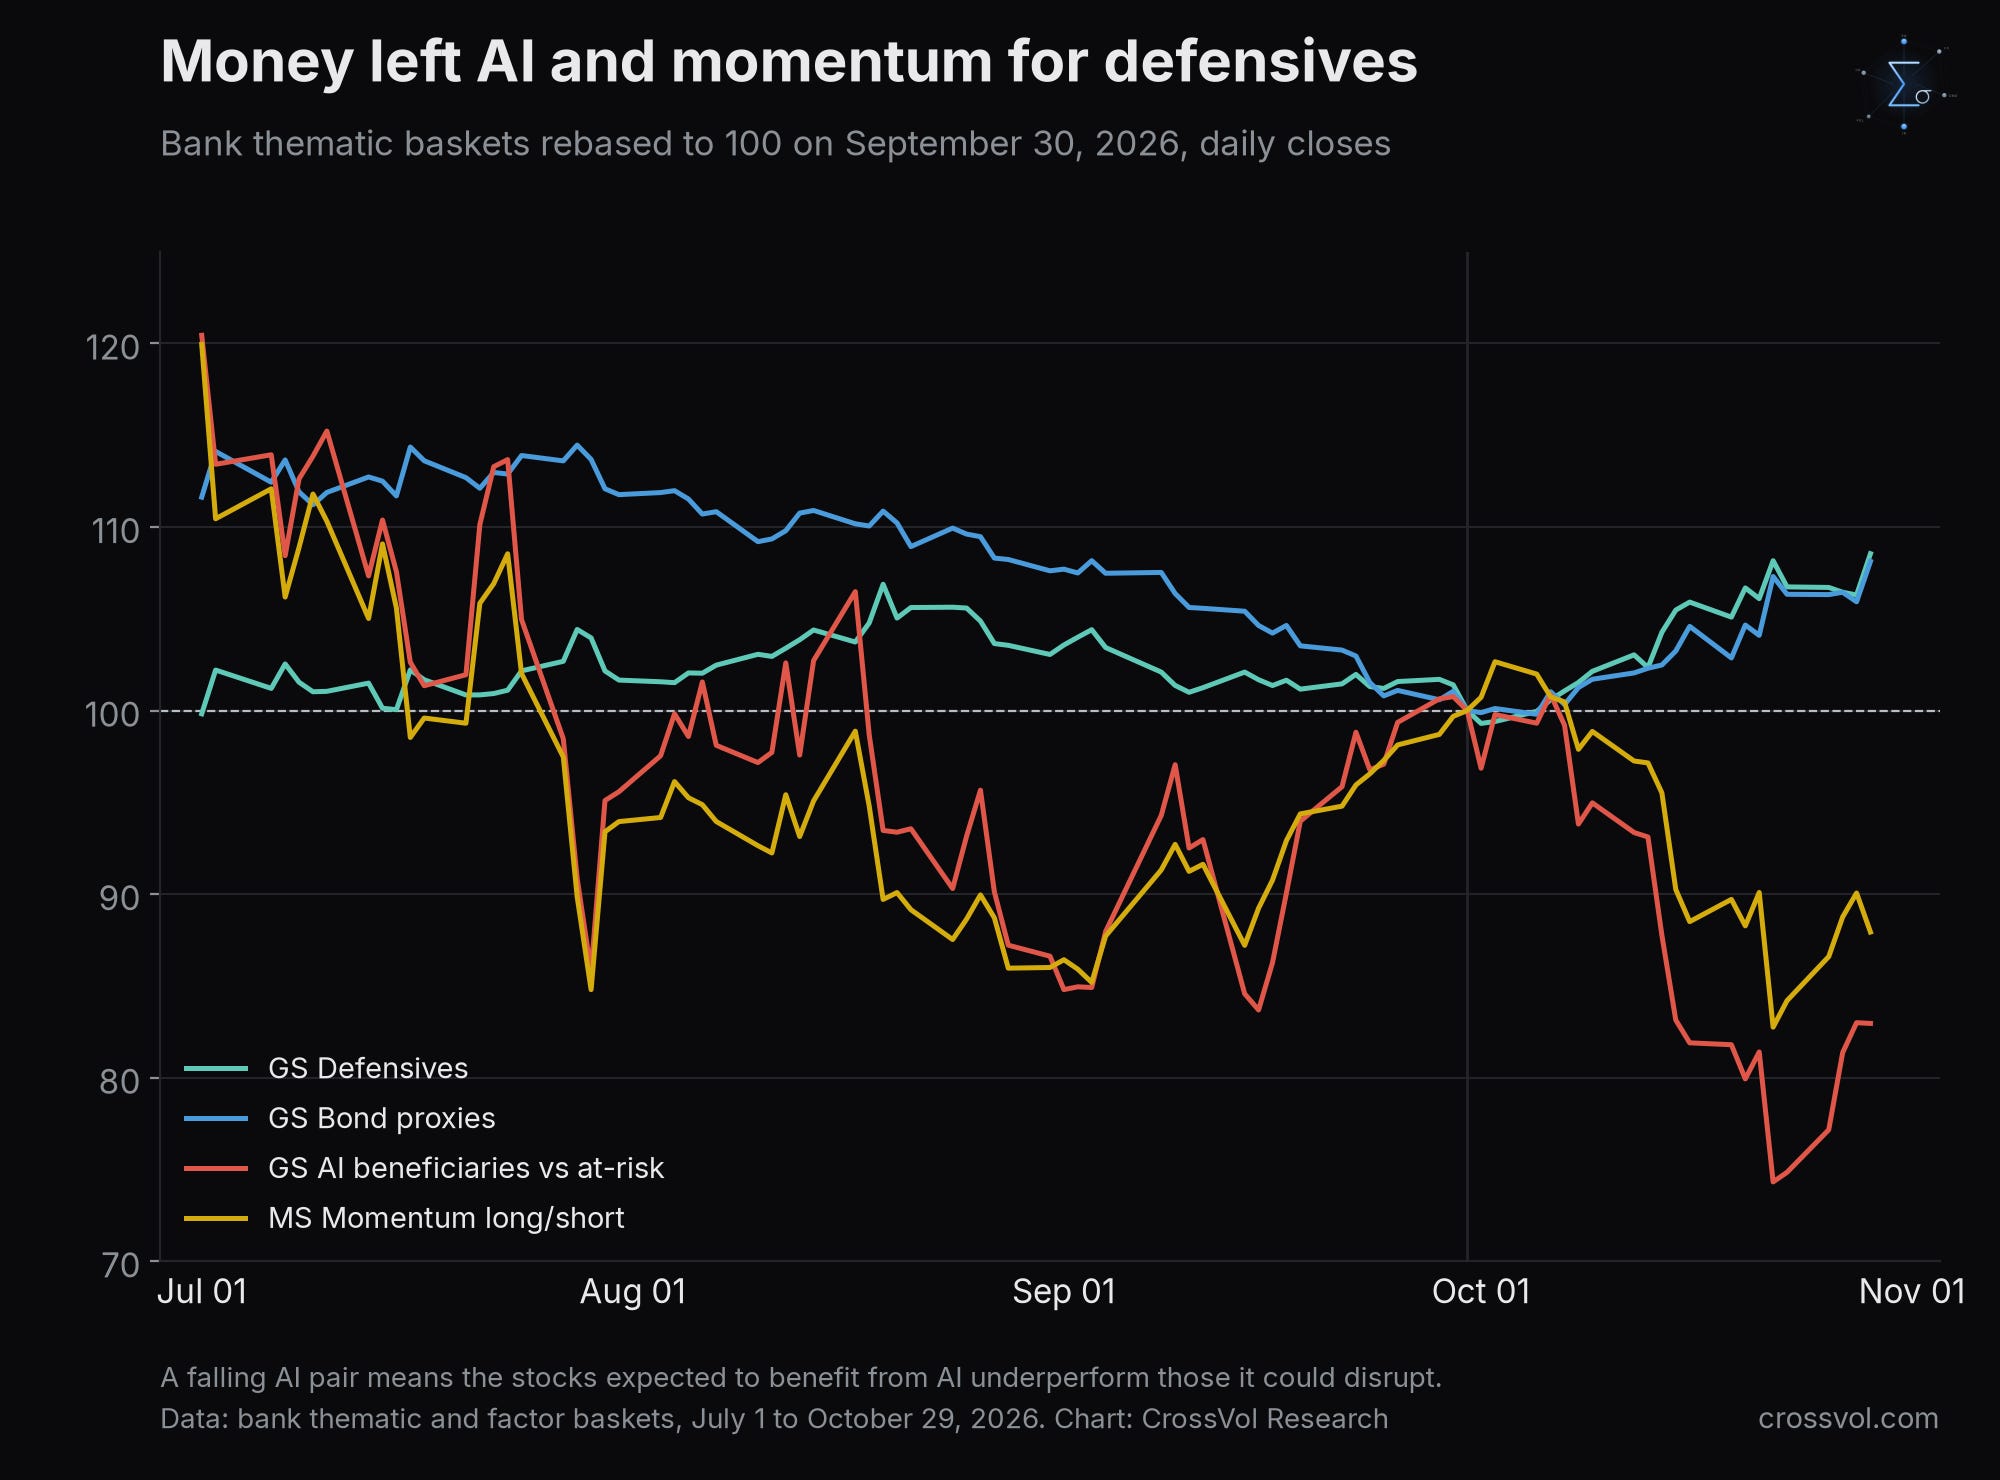
AI trades as a growth risk. Goldman's AI beneficiaries versus AI at risk pair lost 17.1% in a month. The 50 day correlation between the relative performance of semiconductors (SMH against RSP) and long Treasuries (TLT) fell from plus 5% a month ago to minus 31%. AI underperformance now comes with bond rallies, which is the pattern of a growth scare.
Bonds are hedging again. The 50 day correlation between the S&P 500 and long Treasuries fell from 46.7% on October 13 to 16.9% on October 29. It is still positive, so the hedge is returning rather than back, but Treasuries rose on all four October sell offs, Friday included.
Credit sits at one year extremes where the leverage is. Oracle's and CoreWeave's CDS are in the top 5% of their year, and the US high yield spread touched its 99th percentile on October 22.
Positioning has turned defensive. Short interest in the Nasdaq 100 ETF (QQQ) was 82 million shares on October 15, above 96.6% of the readings of the last five years. October 22 was the largest degrossing day of the year in our hedge fund monitor, degrossing meaning funds cutting longs and shorts at the same time.
What it does not confirm yet:
A recession. Polymarket's contract on a US recession before the end of 2026 trades at 7.5%, against 43.5% a year ago. It has two months left to run, so it says more about the calendar than about 2027.
The index and its breadth. At Thursday's close the S&P 500 ETF was 1.2% below its high. 64.8% of the S&P 500 members were above their 50 day average on October 29, against 24.2% on September 29.
Copper. Copper futures were flat in the month to October 29, at $6.60 a pound, 4% below their September 9 high. A global slowdown would push them down. The copper to gold ratio is close to its one year high, but only because gold fell.
Inflation expectations. The 5 year breakeven, the inflation rate priced by the bond market for the next five years, rose 13 bp in a month to 2.47%. A disinflationary slowdown would push it down.
Broad credit. Bloomberg's high yield index was at 323 bp on October 29, below the 350 bp I named on October 13 as the next marker.
My reading: rates, sector rotation, AI and AI credit price a US slowdown. The index, the recession markets and broad credit do not, yet. That is the order I described on October 13. The indices see it last.
The AI trade is being de-crowded
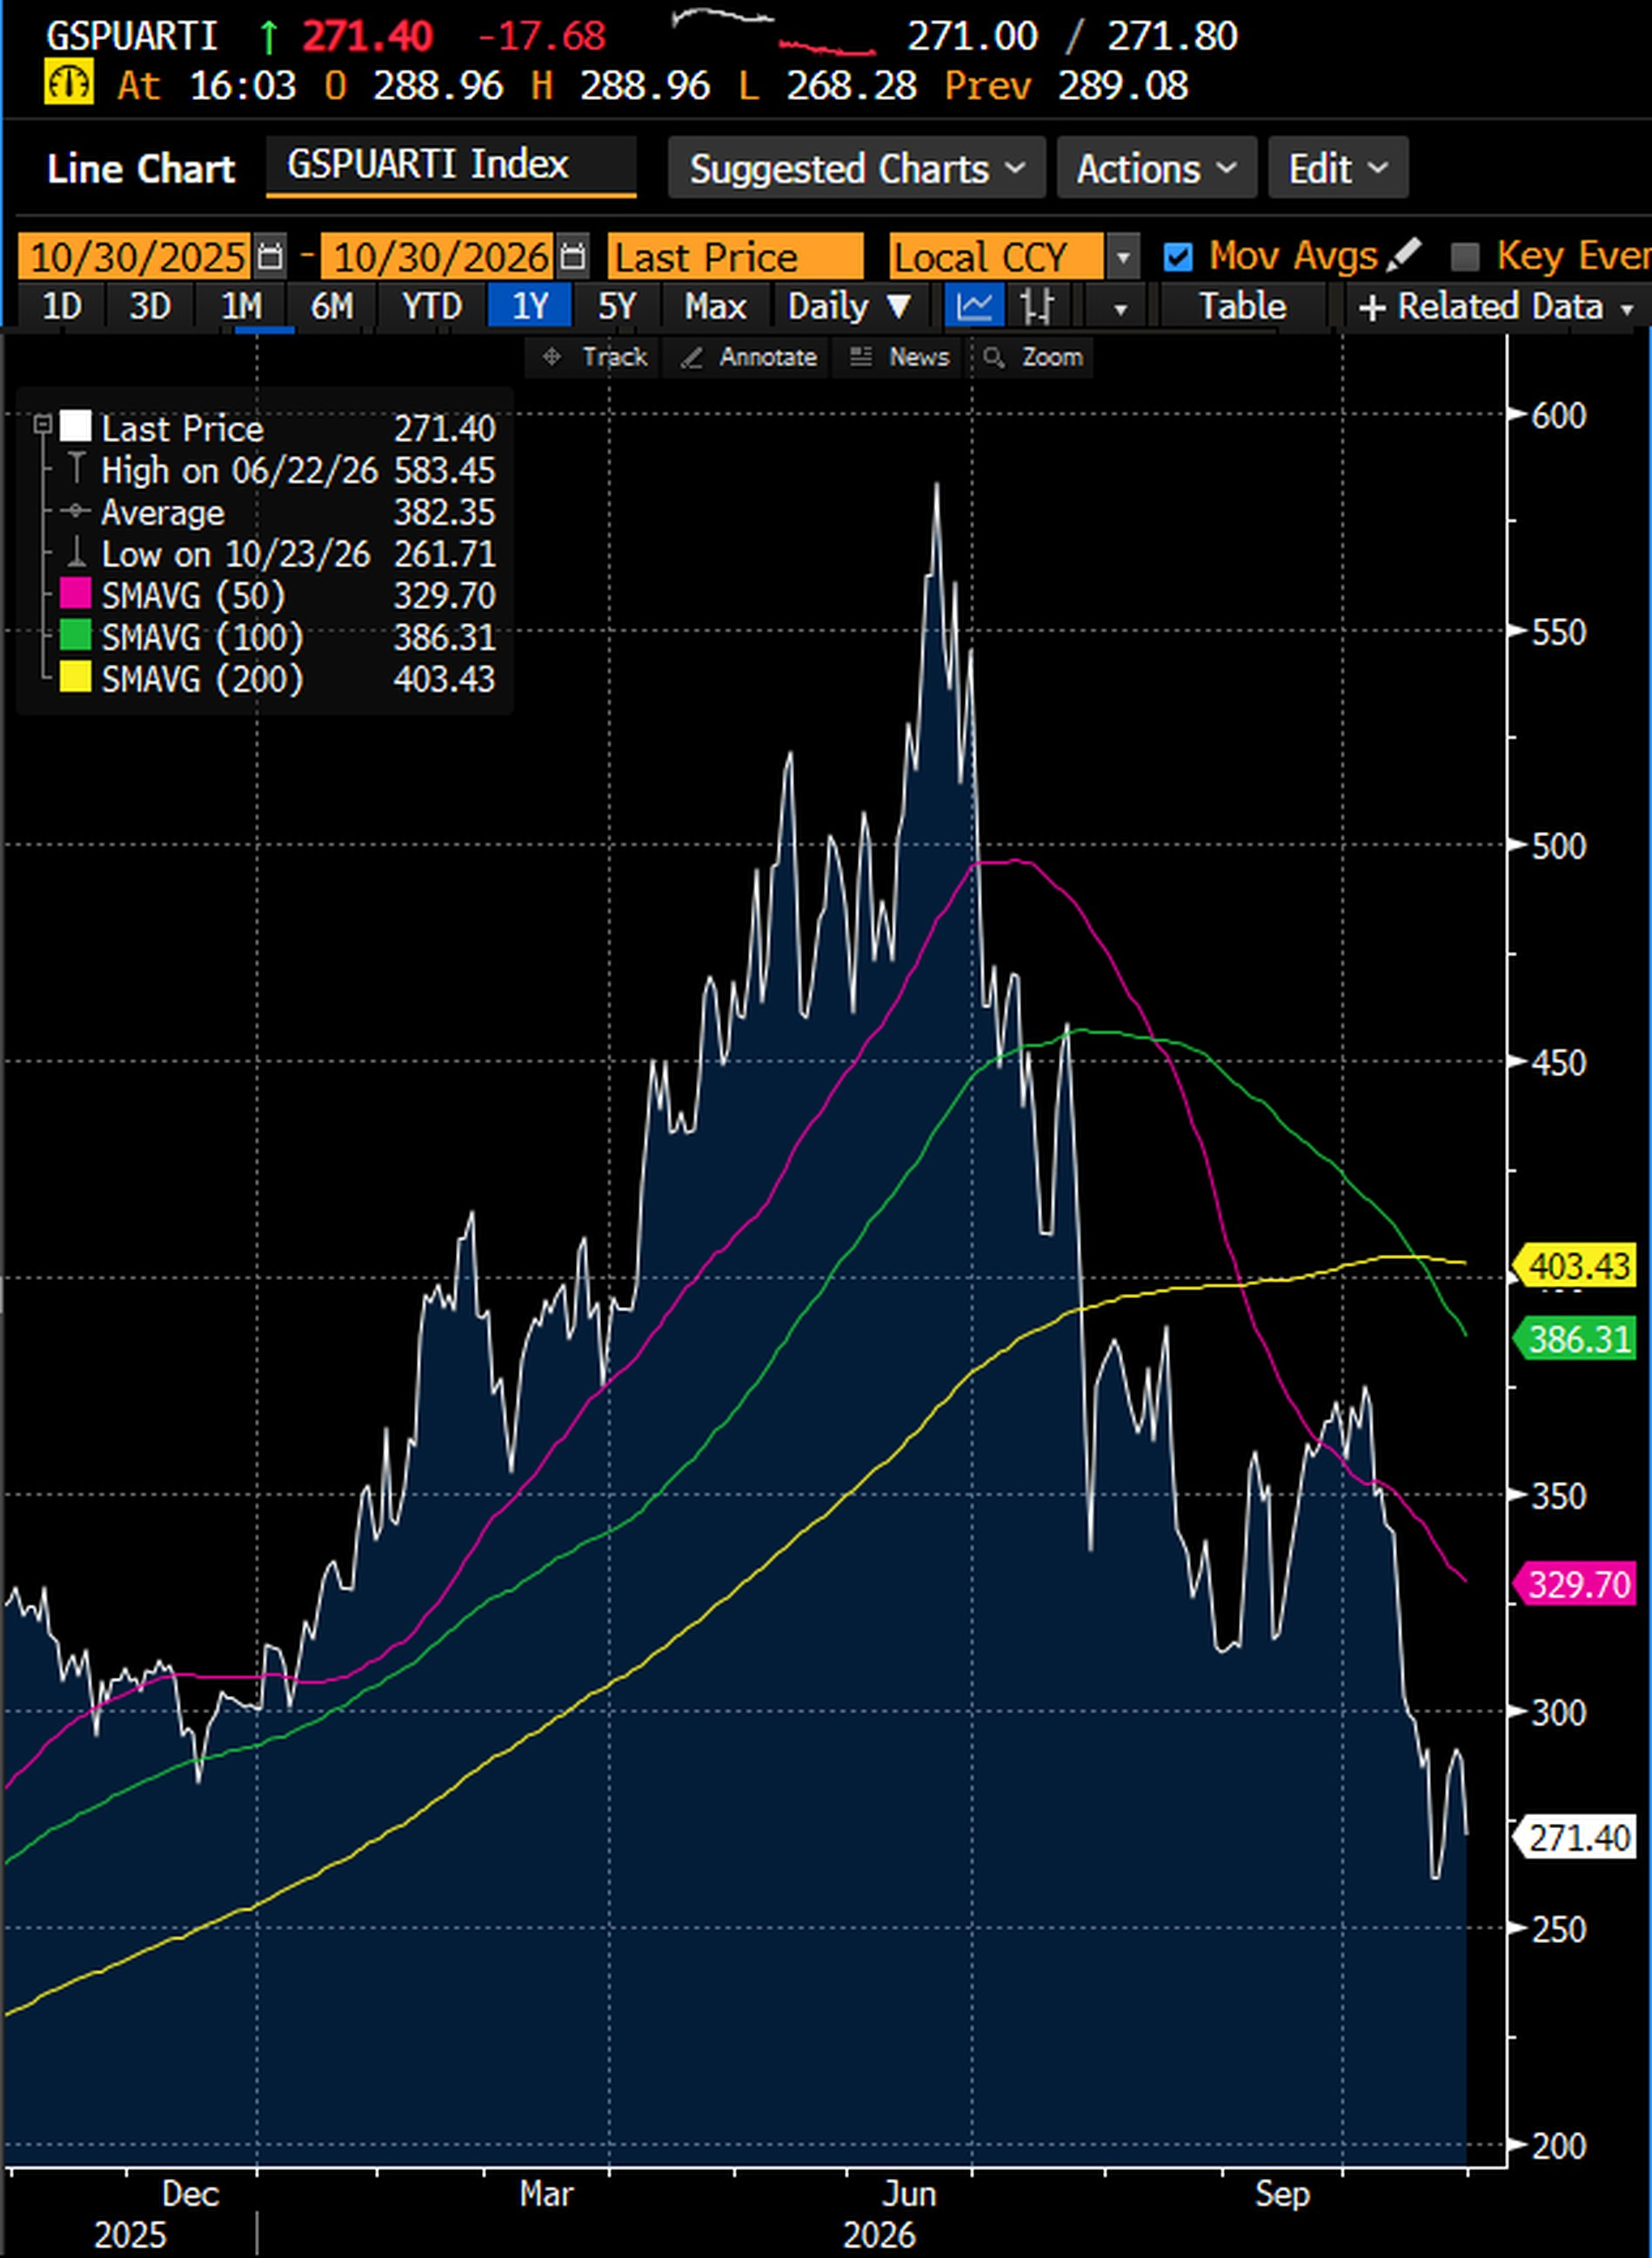
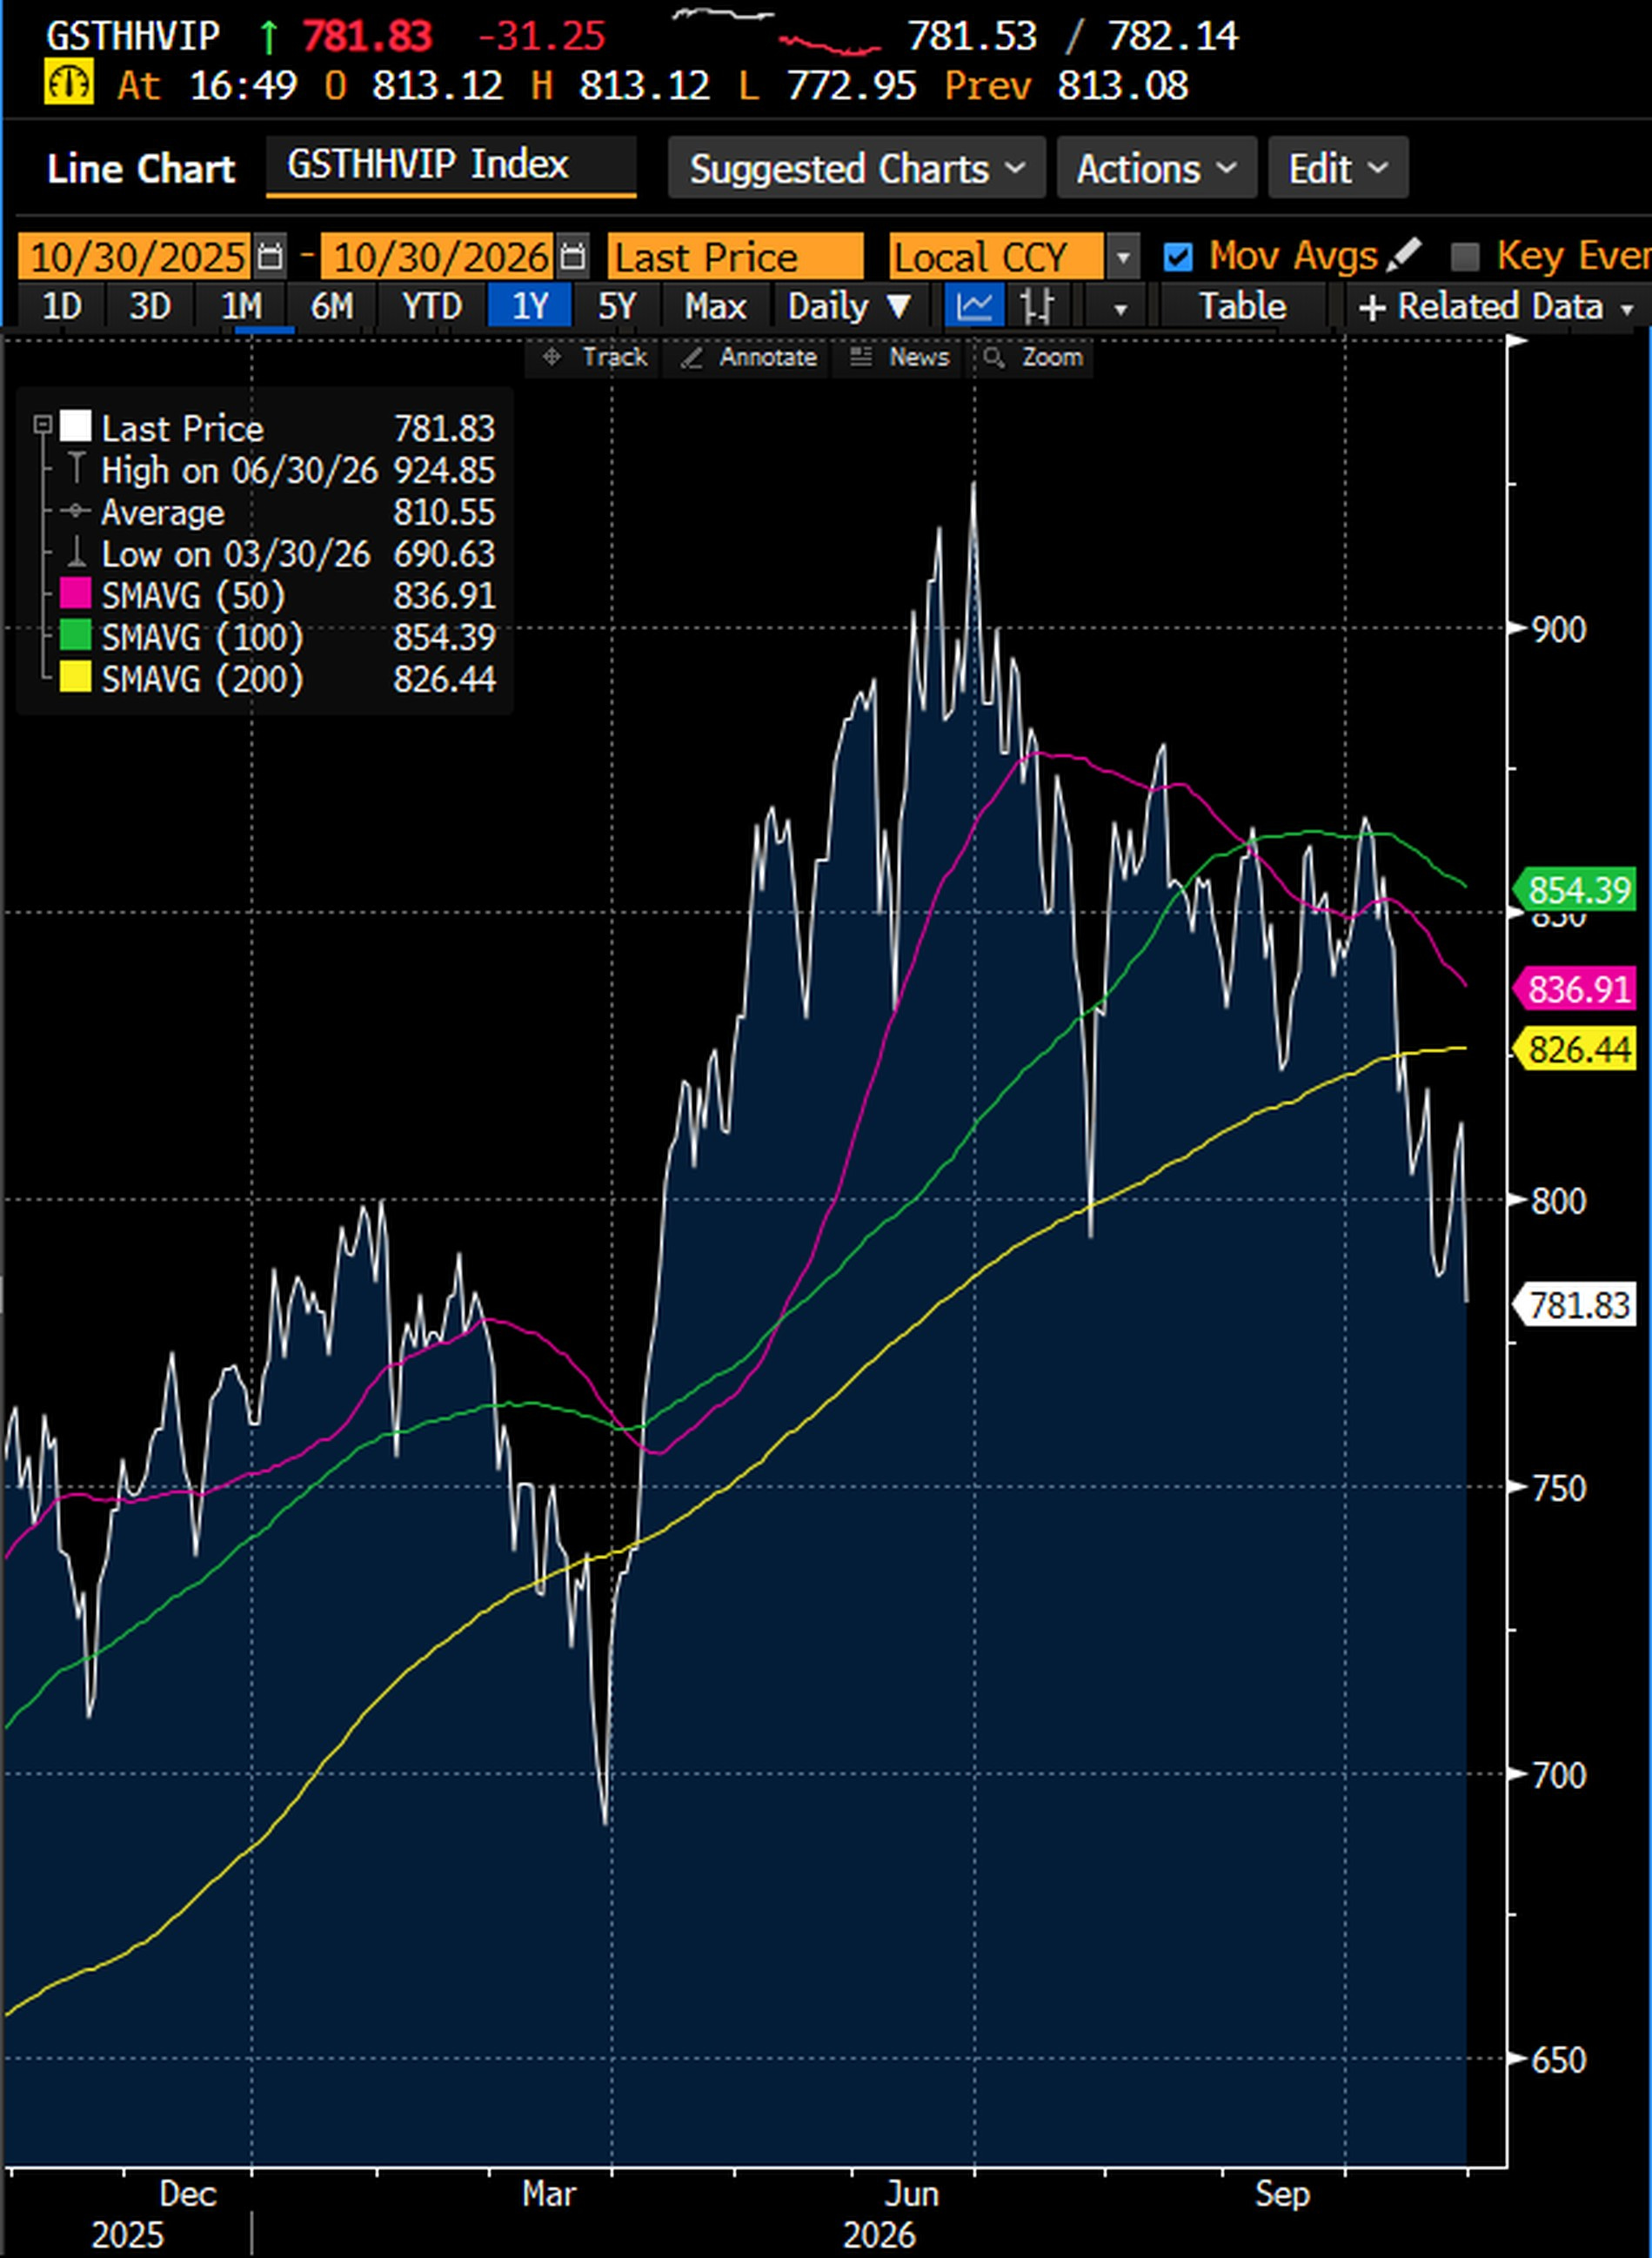
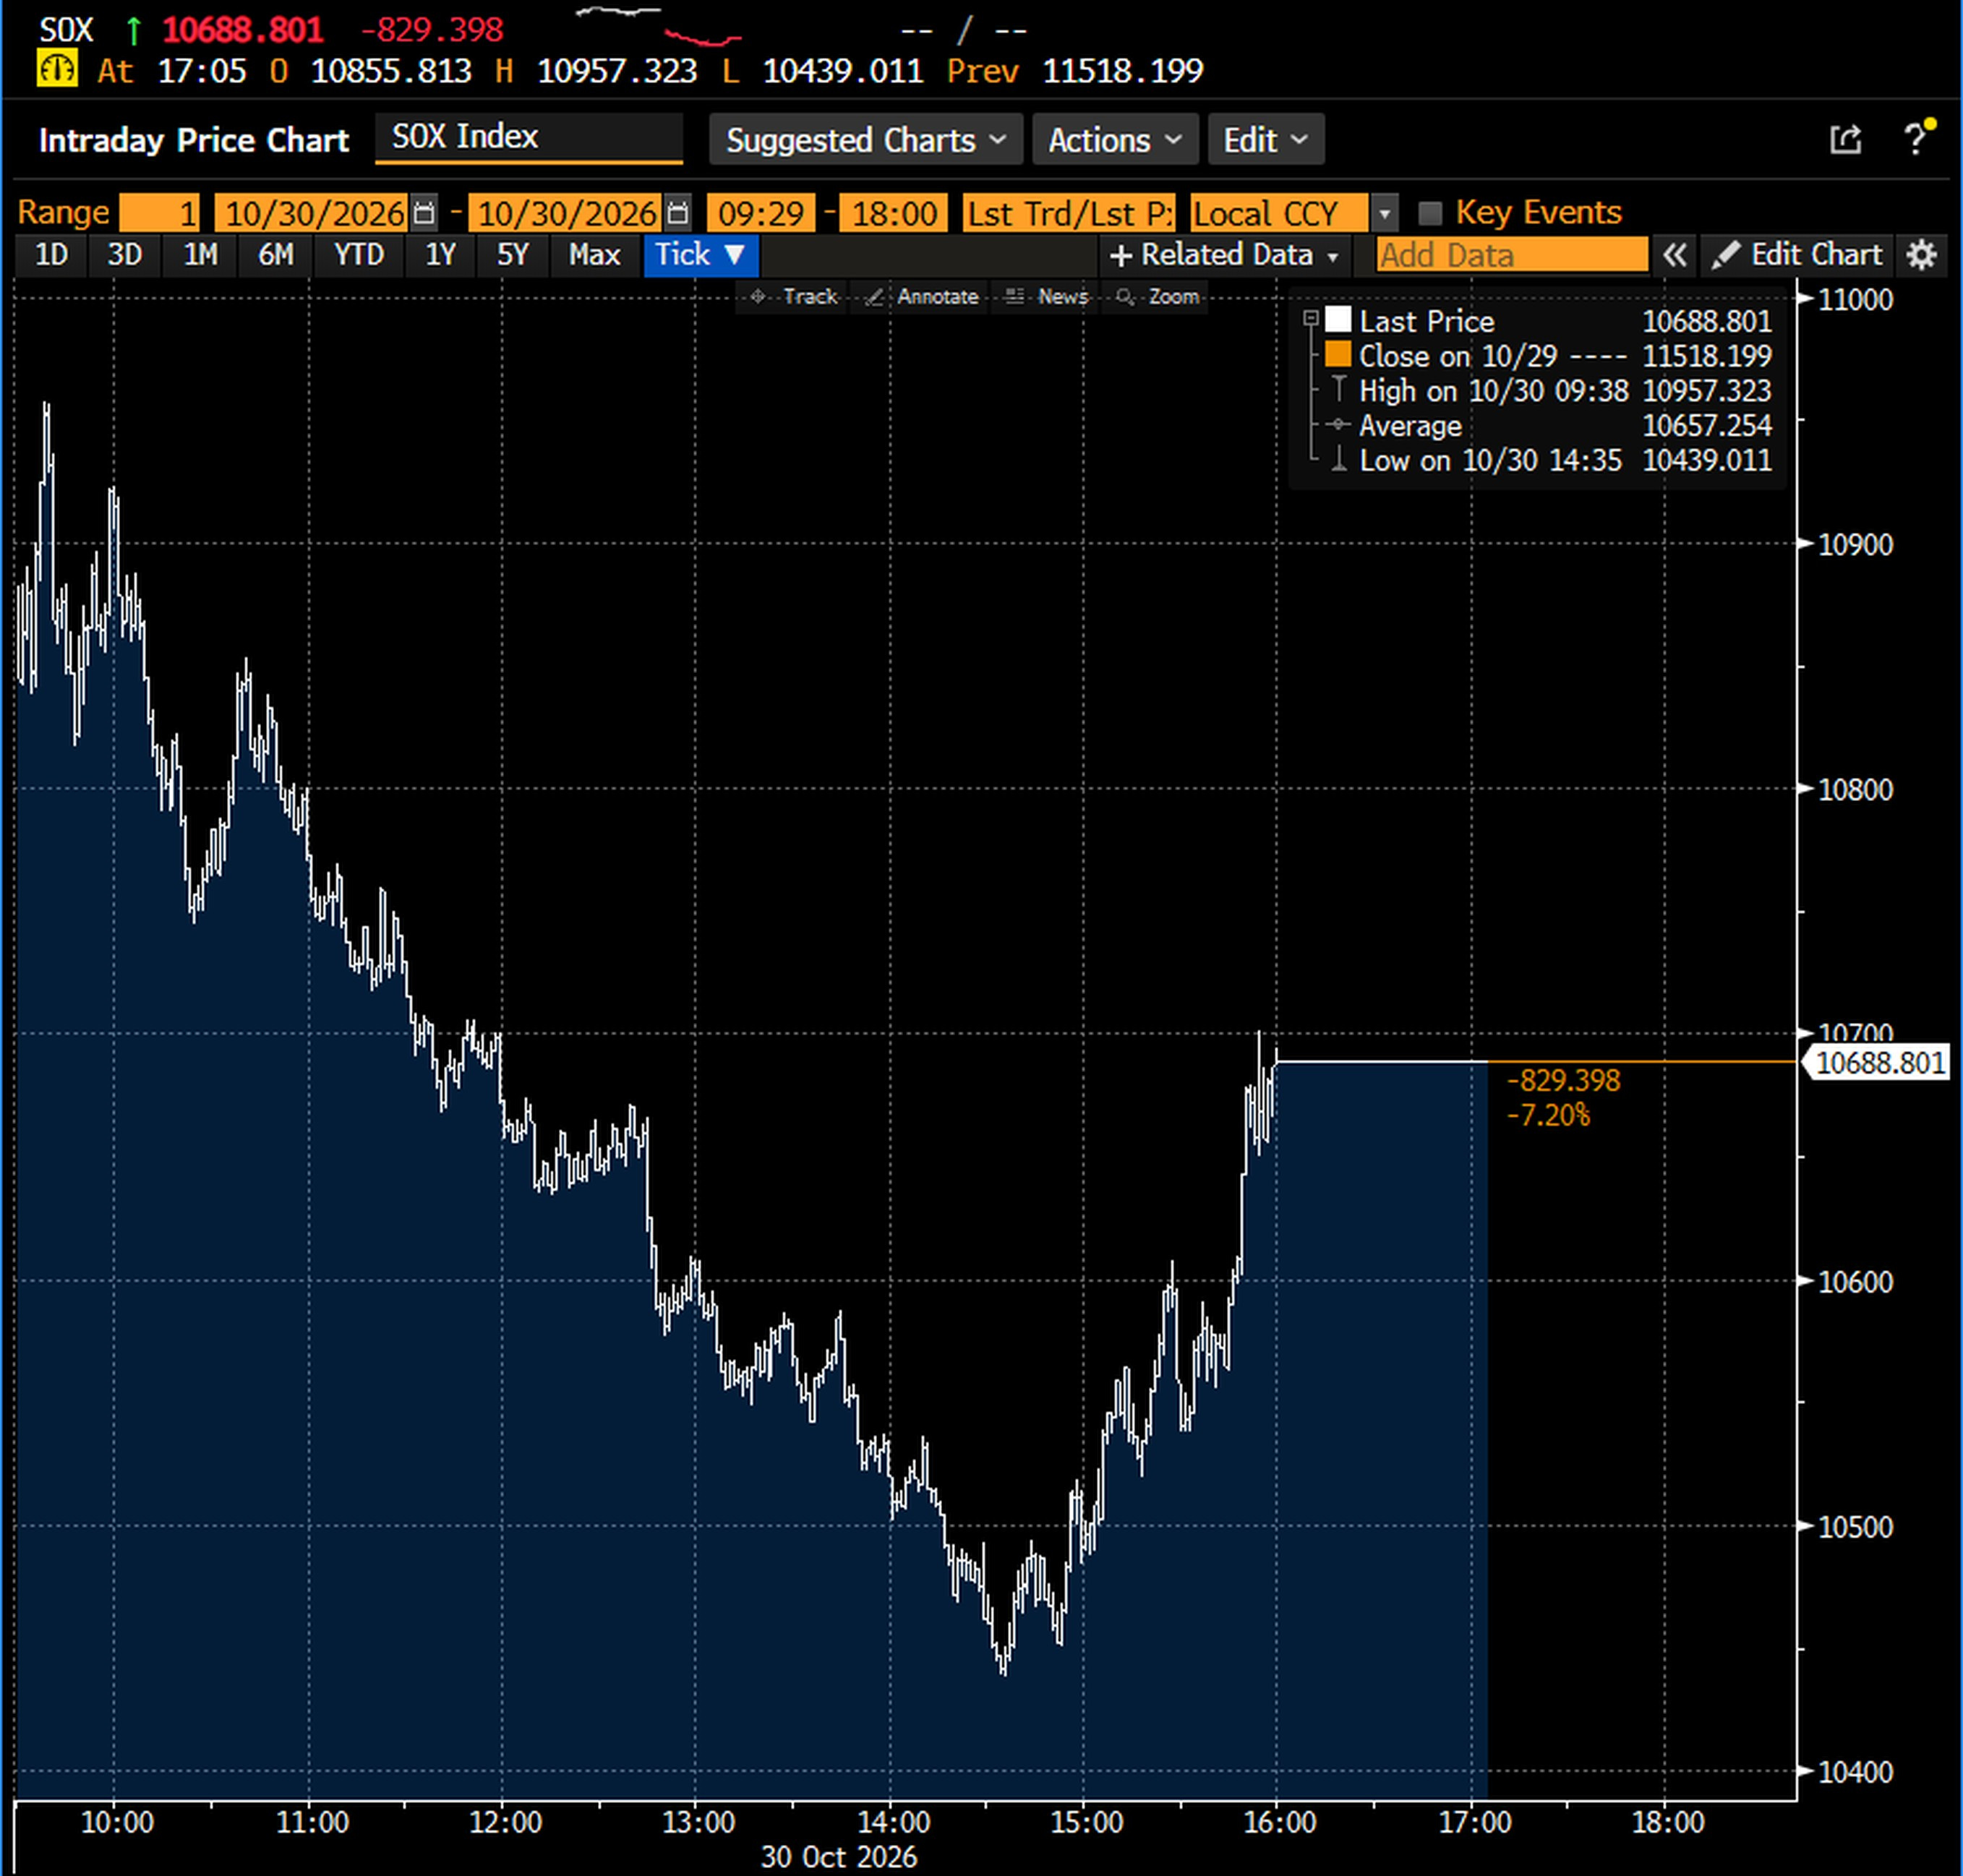
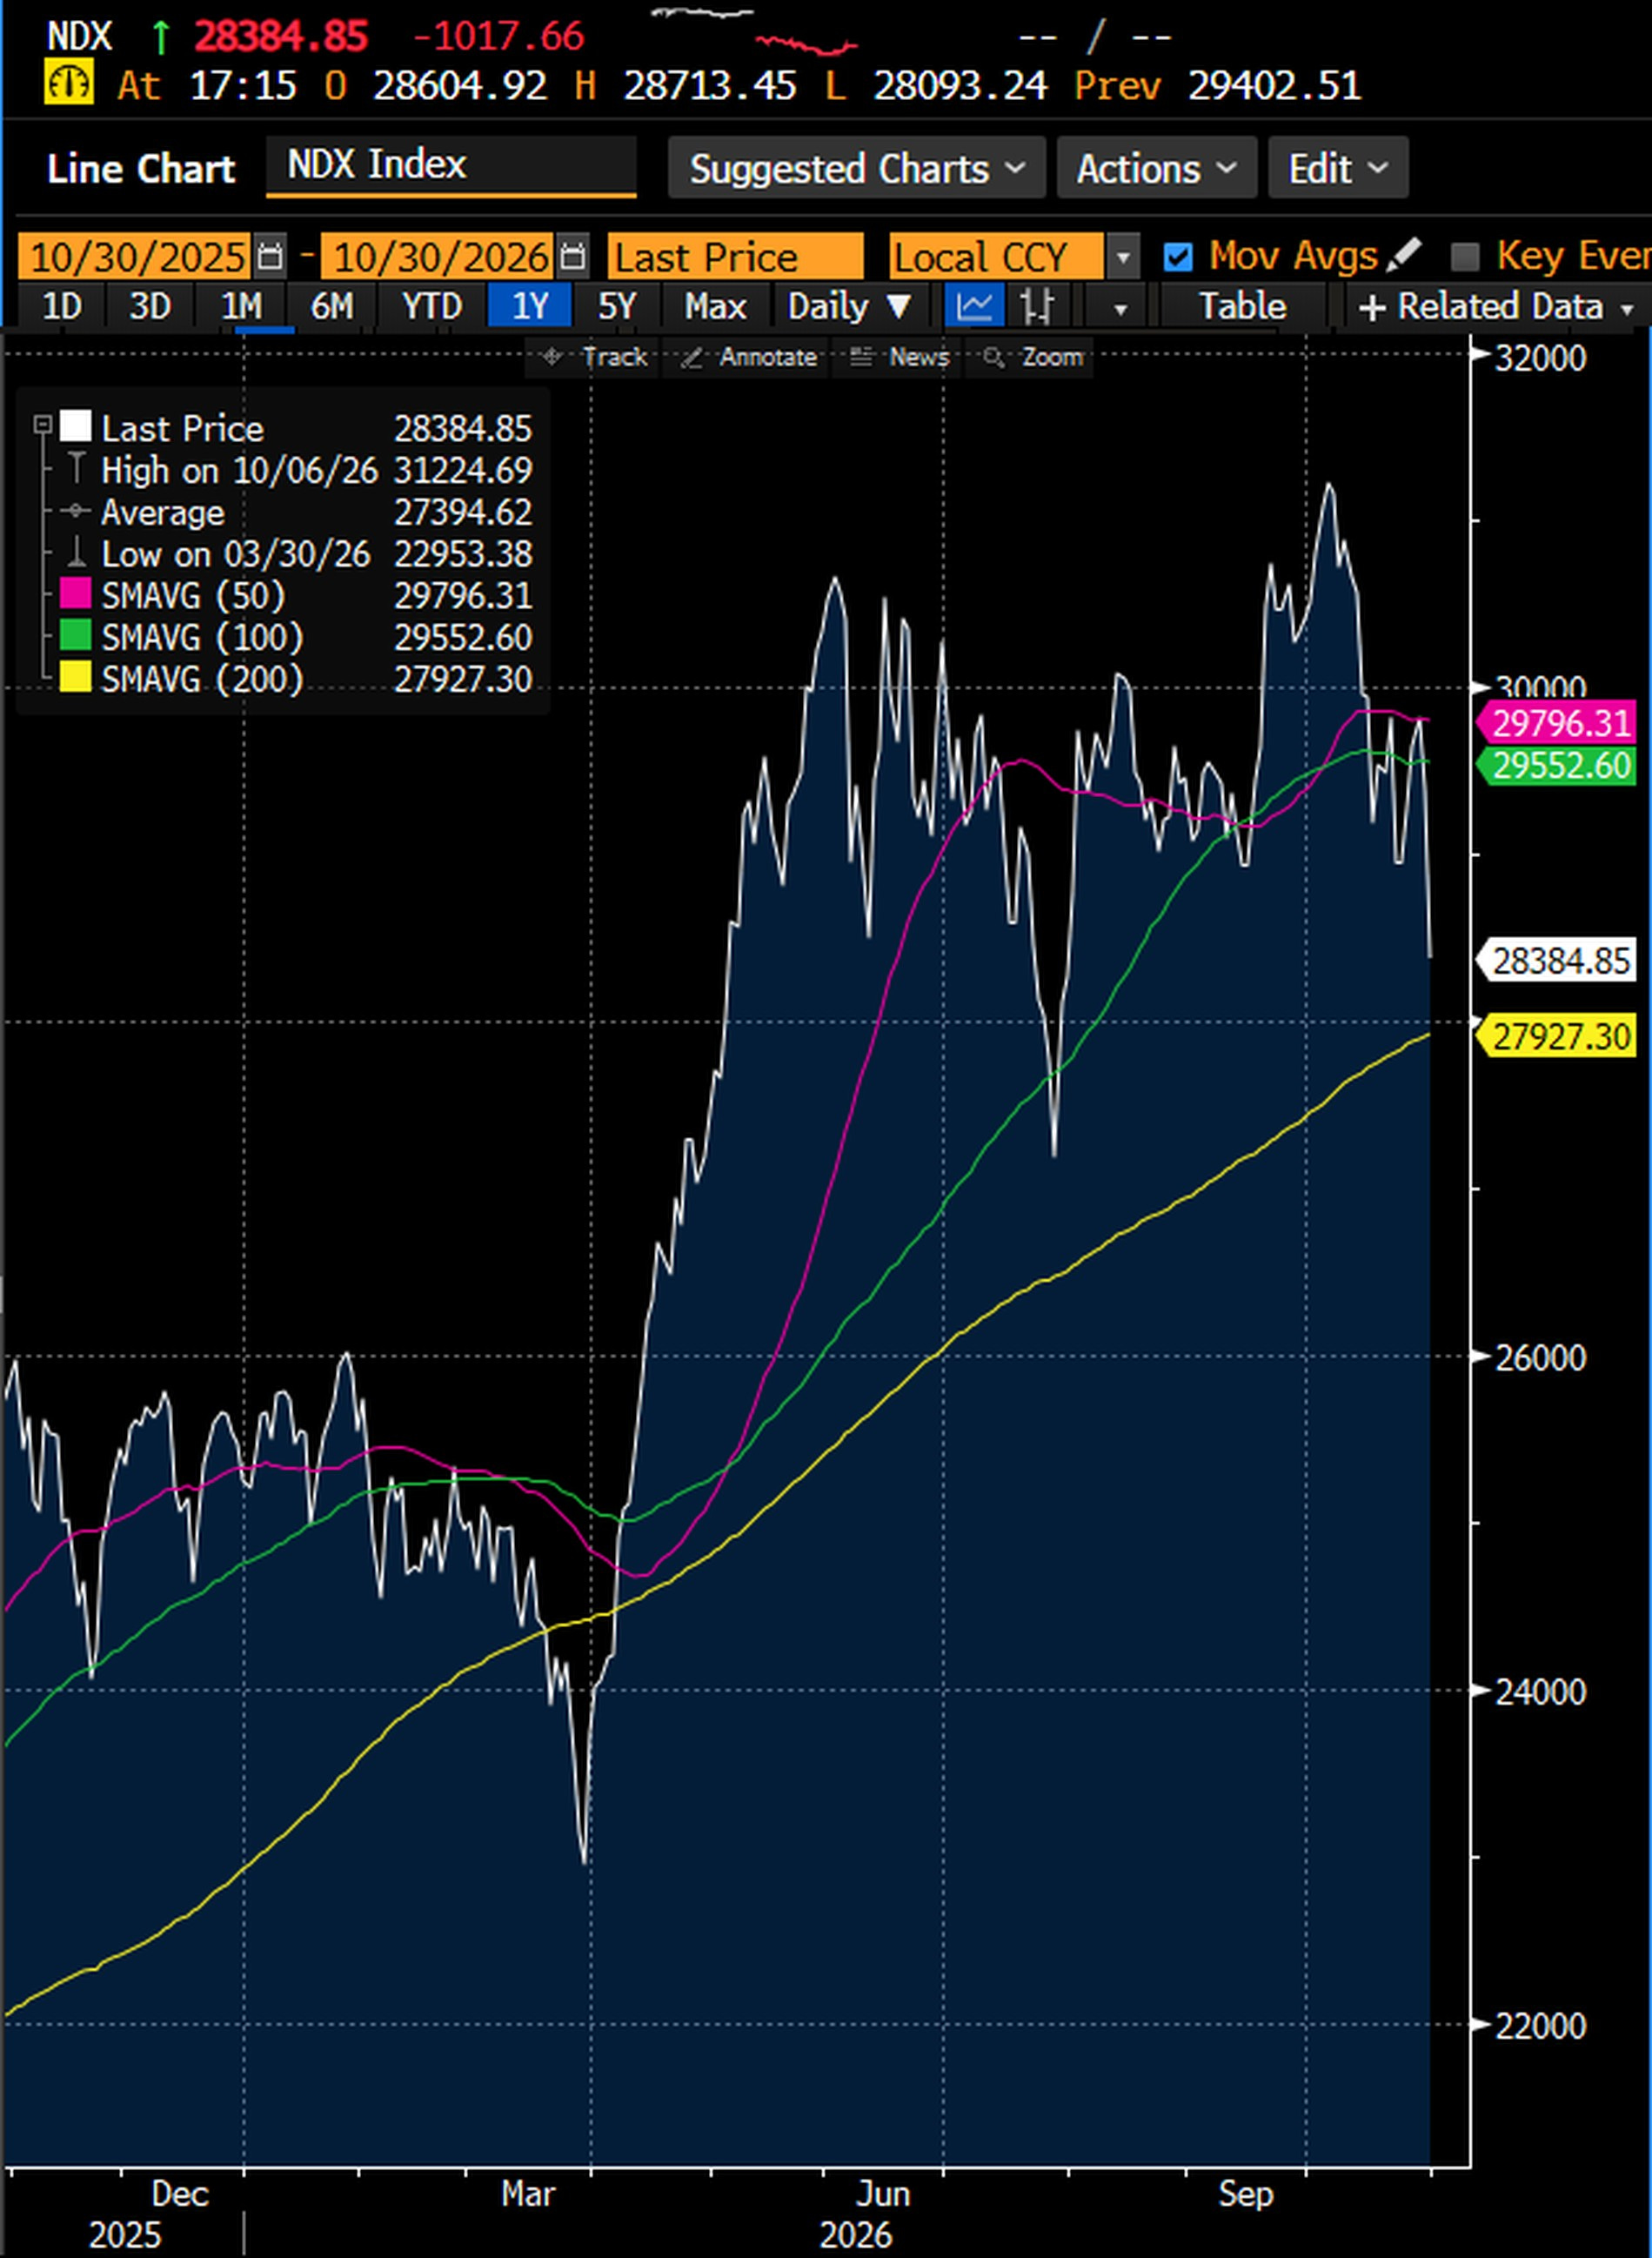
Since Thursday the market has stopped rotating out of AI and started to empty it. On Thursday Alphabet fell 12.6% after its results, and Amazon and Intel reported after the close. On Friday the selling reached the whole chain. Intel lost 28.6%. The Philadelphia semiconductor index closed 7.2% lower, at 10,688.80, and the Nasdaq 100 3.5% lower, at 28,384.85. During the session the Nasdaq 100 had fallen 10% from its October high, the usual definition of a correction, and it closed 9.1% below it. Over the two sessions from Wednesday's close, Alphabet lost 13.9%, AMD 12.7%, the semiconductor ETF (SMH) 8.0%, Amazon 5.6%, Nvidia 5.0% and Microsoft 1.7%, while Meta gained 0.4%. The Nasdaq 100 ETF (QQQ) lost 4.8% while the equal weighted S&P 500 ETF (RSP) gained 0.4%. On Friday Goldman Sachs' AI beneficiaries versus AI at risk pair lost 6.1%, to 271.40, 3.7% above its October 23 low and 53.5% below its June 22 high. Goldman's Hedge Fund VIP basket, the stocks most widely held by hedge funds, lost 3.8%, to 15.5% below its June 30 high. Morgan Stanley's momentum pair lost 2.3%.
Crowded is the word. On the Goldman prime brokerage figures in our October 25 review, hedge funds held a record 22% of their exposure in the Magnificent 7. A trade that crowded is not sold on news alone. It is sold by the funds that have to cut their gross exposure.
Hedge funds are cutting gross exposure. Gross exposure is the size of a fund's book, its longs plus its shorts. Net exposure is the difference, its bet on the direction of the market. Degrossing cuts both at once, selling longs and buying back shorts, to shrink the risk without changing the bet. It started before the results. In the week to October 15, hedge funds sold technology stocks at the fastest rate in at least a decade, on Goldman Sachs' prime brokerage data. Goldman's figures then showed degrossing on 7 of 8 sessions, and October 22 was the fifth largest degrossing in its data, almost entirely long selling, and the strongest of the year in our hedge fund monitor.
Yet the books stayed big. Gross leverage, longs plus shorts against capital, was still 312.3% in Goldman's prime book, in the 96th percentile of five years, while the net leverage of US long short funds had fallen to 43.4%, the lowest in at least five years. The funds were hedged, not small, and a book that large has a long way to shrink. It is shrinking now. Our monitor flagged degrossing during Friday's session, though not at the close, after the strongest degrossing day of the year on October 22. On our estimate, gross leverage has come down since October 26 while net leverage has held steady: the funds are making their books smaller, not turning bearish.
Why now? Because volatility sets the size of a book. When volatility rises, the same gross carries more risk, and risk managers cut it to stay inside their limits, fastest at the multi-manager platforms, where the limits are tight. That is why degrossing feeds on itself: the selling raises volatility, which forces more selling, first in the stocks the funds own most. On Friday, as the VIP basket fell 3.8%, Goldman's pair of hedge fund favourites against the most shorted stocks lost only 0.5%, both legs falling together. And it does not stay in stocks. The largest multi-strategy funds run equity books and relative value trades in rates side by side, under one risk budget. When they cut gross, the Treasury basis trade is part of the gross.
For Act 4 the order matters. Credit went first, the AI leaders took the hit on their results, and now the funds that own them are reducing. After the close the story came back to credit, with S&P's negative outlook on Meta. The cap weighted index is the last step, and on Friday it started to move.
Rates: the haven is back
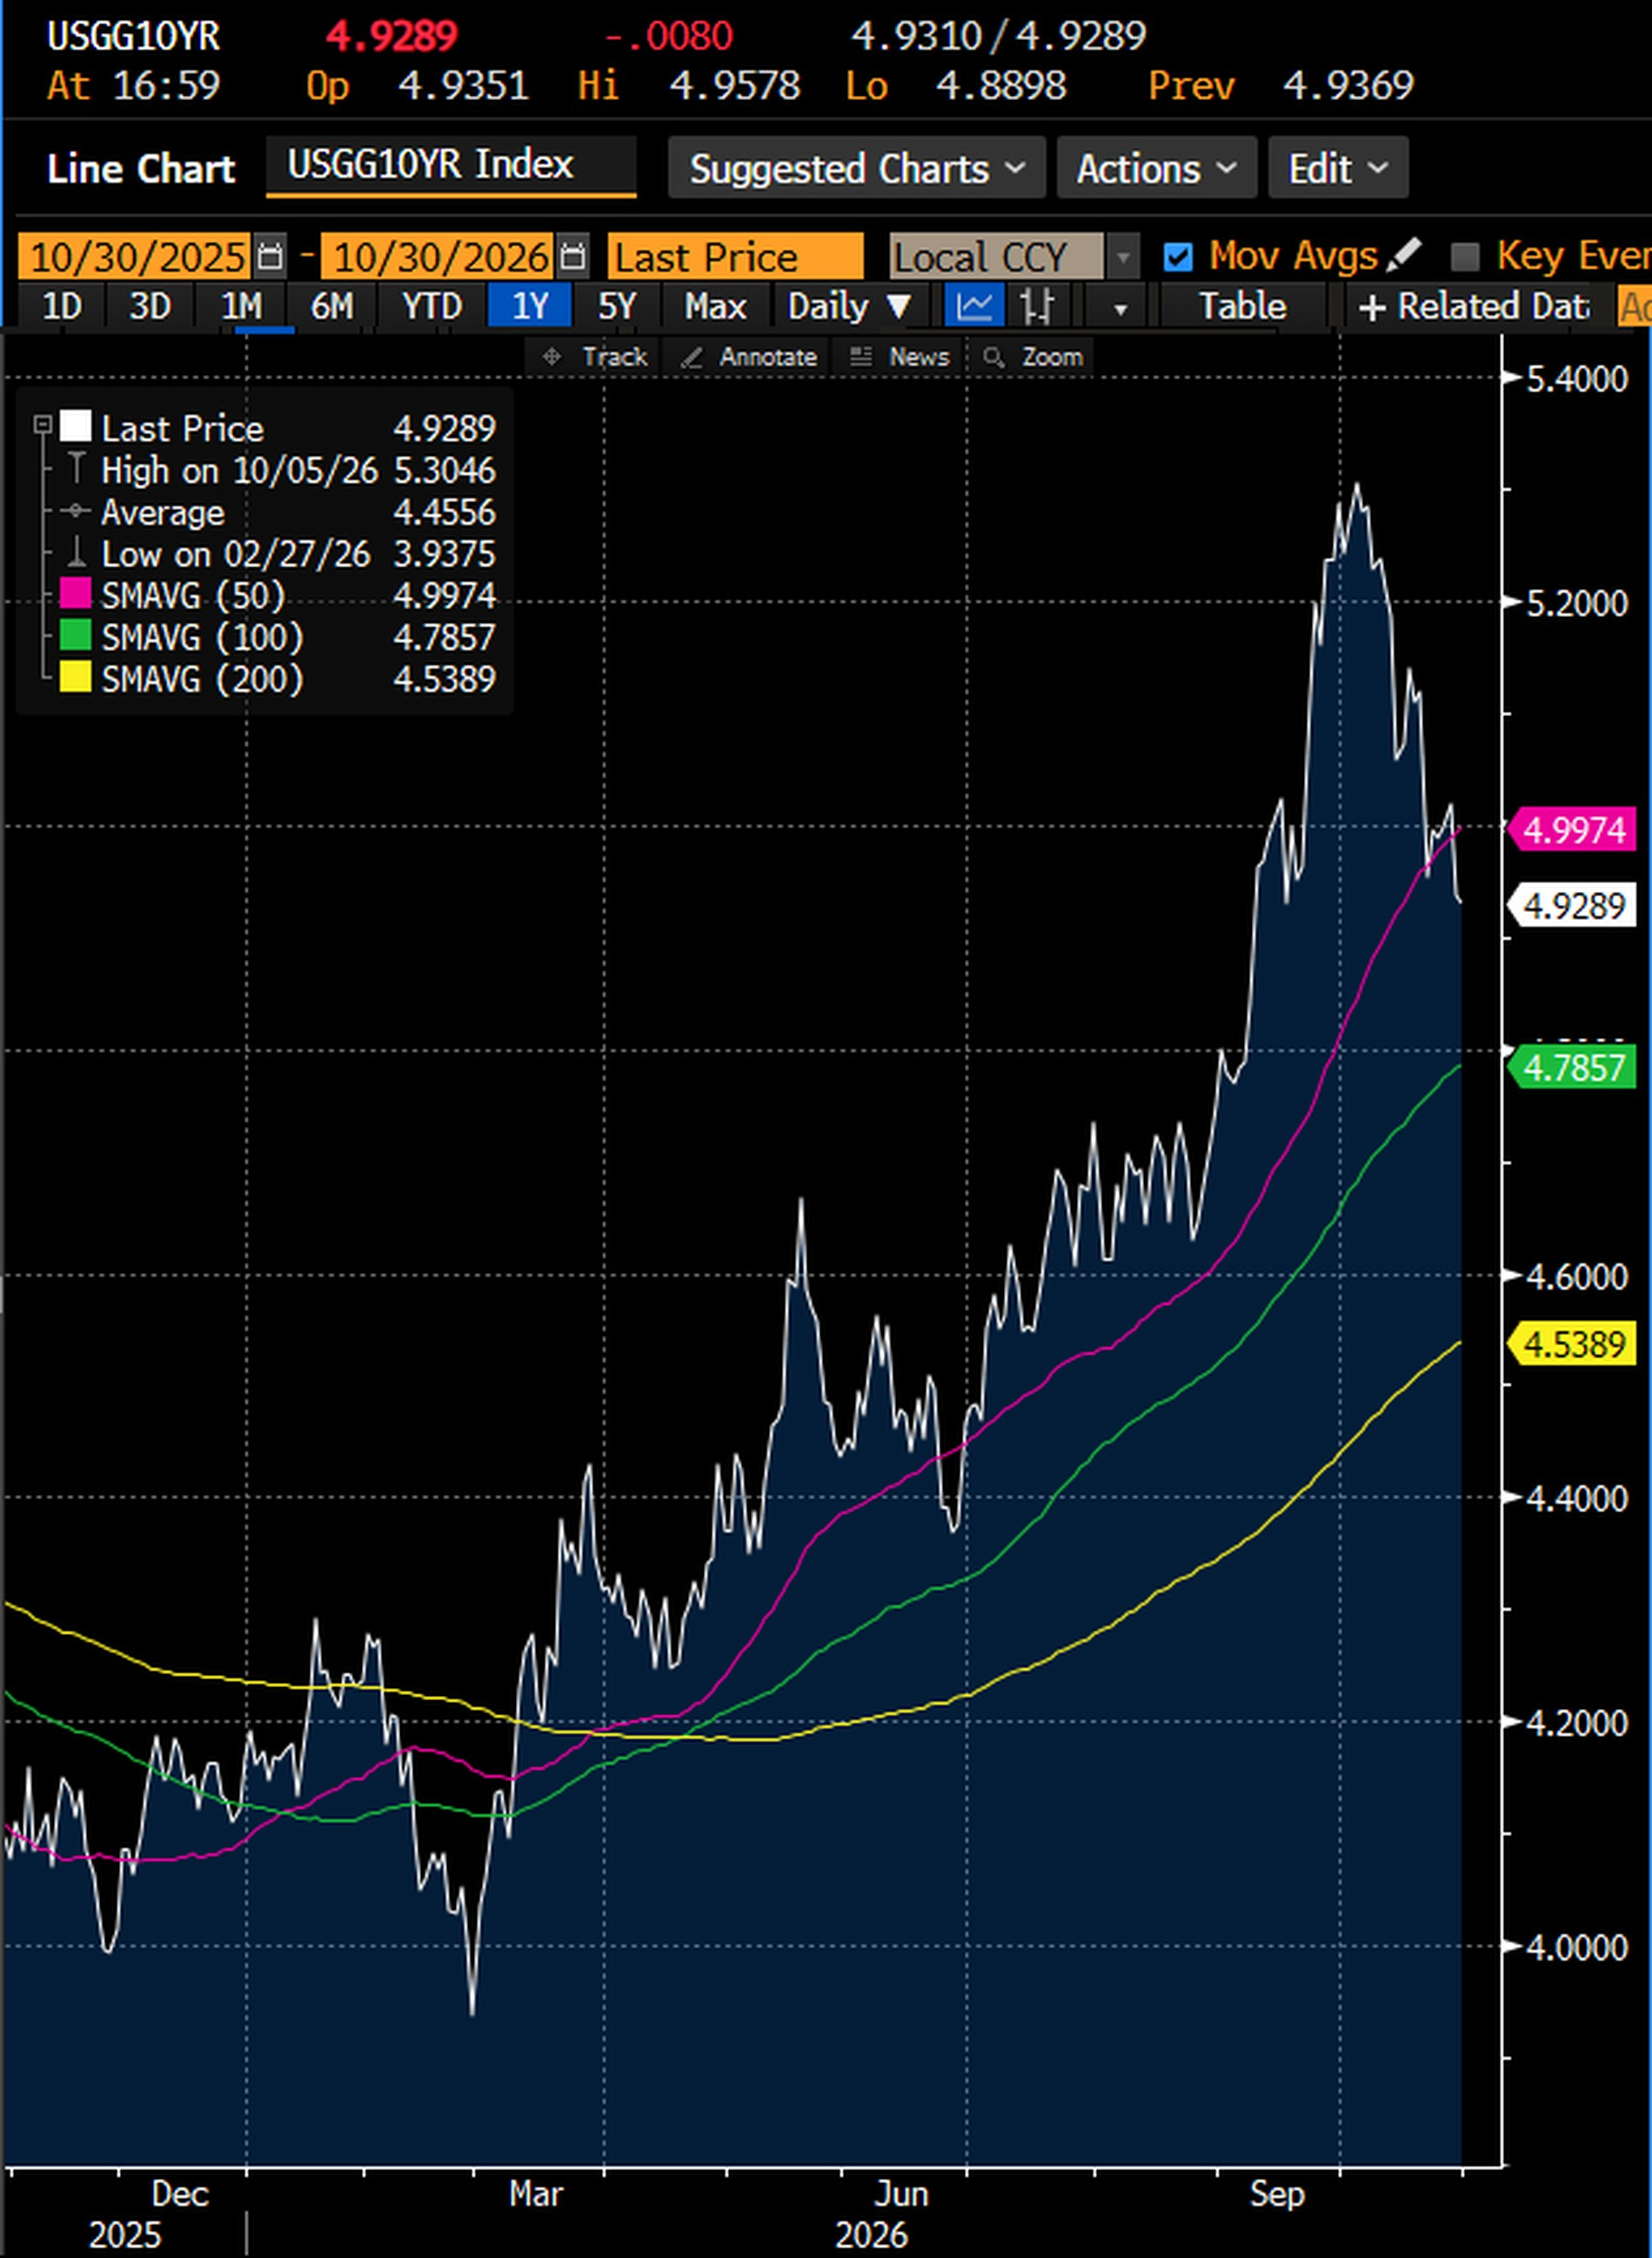
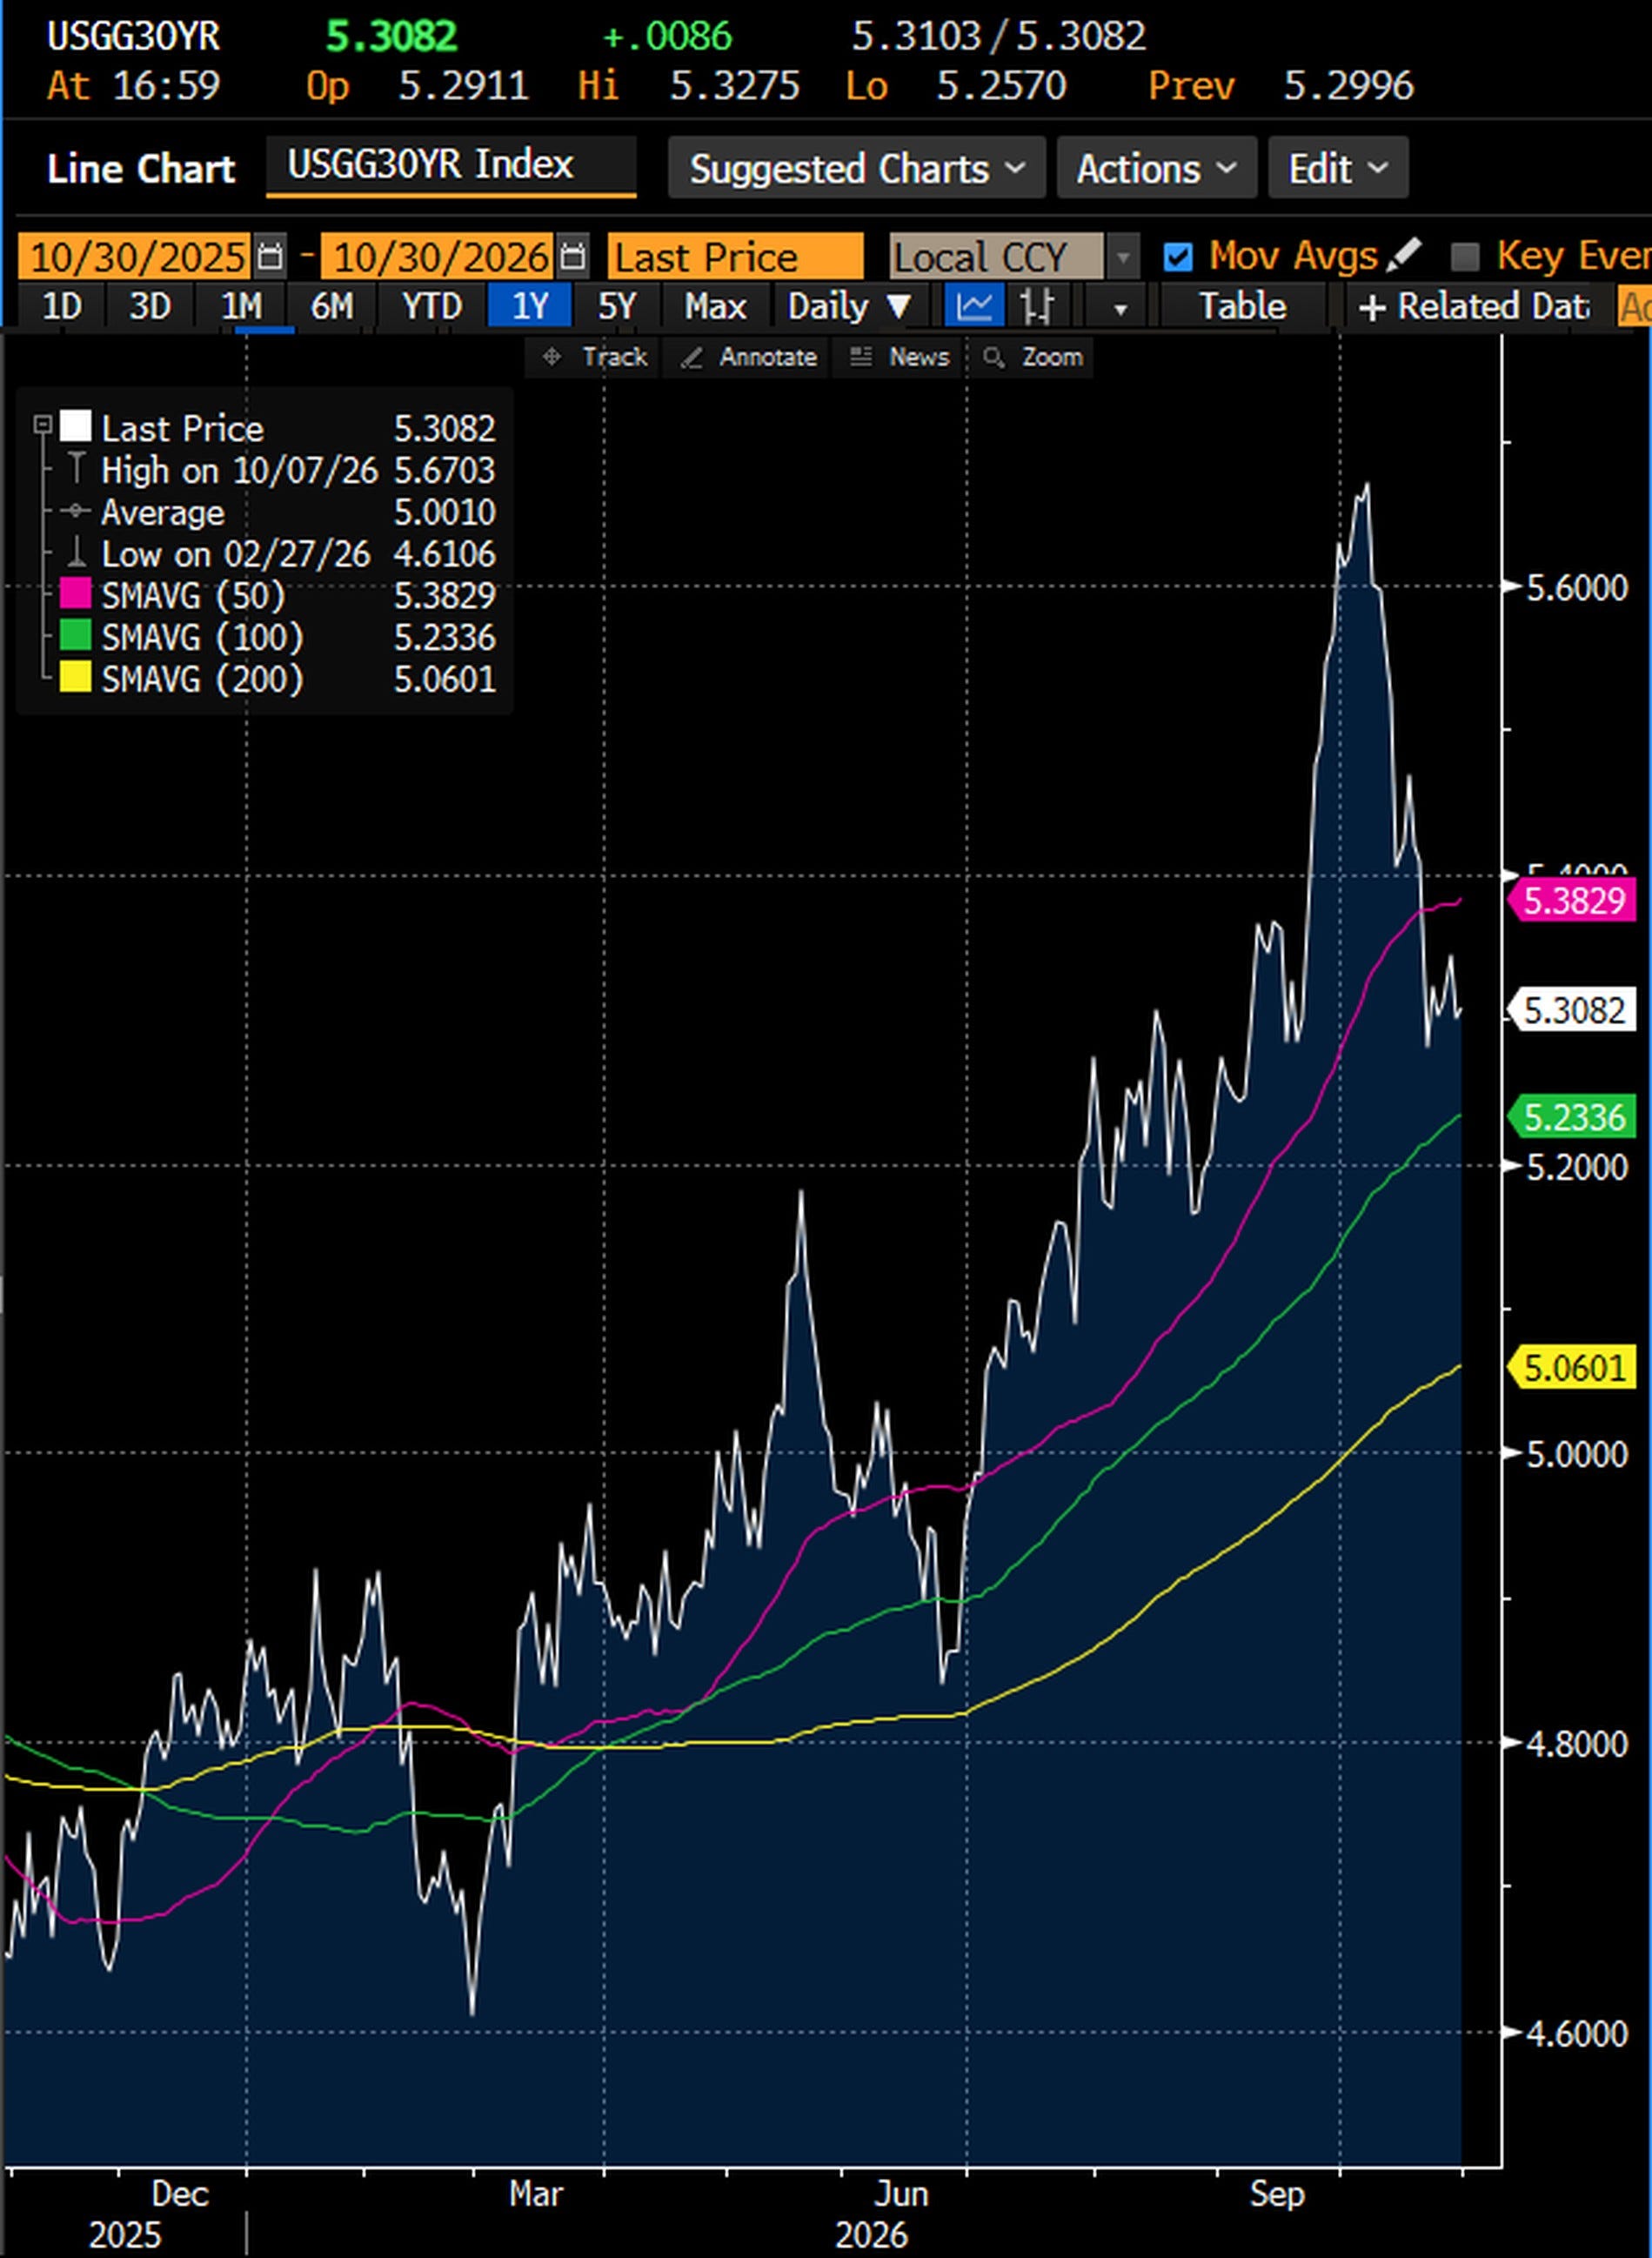
The 10 year yield closed Friday at 4.93% on Bloomberg, 38 bp below its October 5 high and below its 50 day average of 5.00%. The 30 year closed at 5.31%, against 5.67% on October 7. On the Treasury's own closing curve, from October 5 to October 29 the 2 year fell 23 bp, the 10 year 33 bp and the 30 year 34 bp.
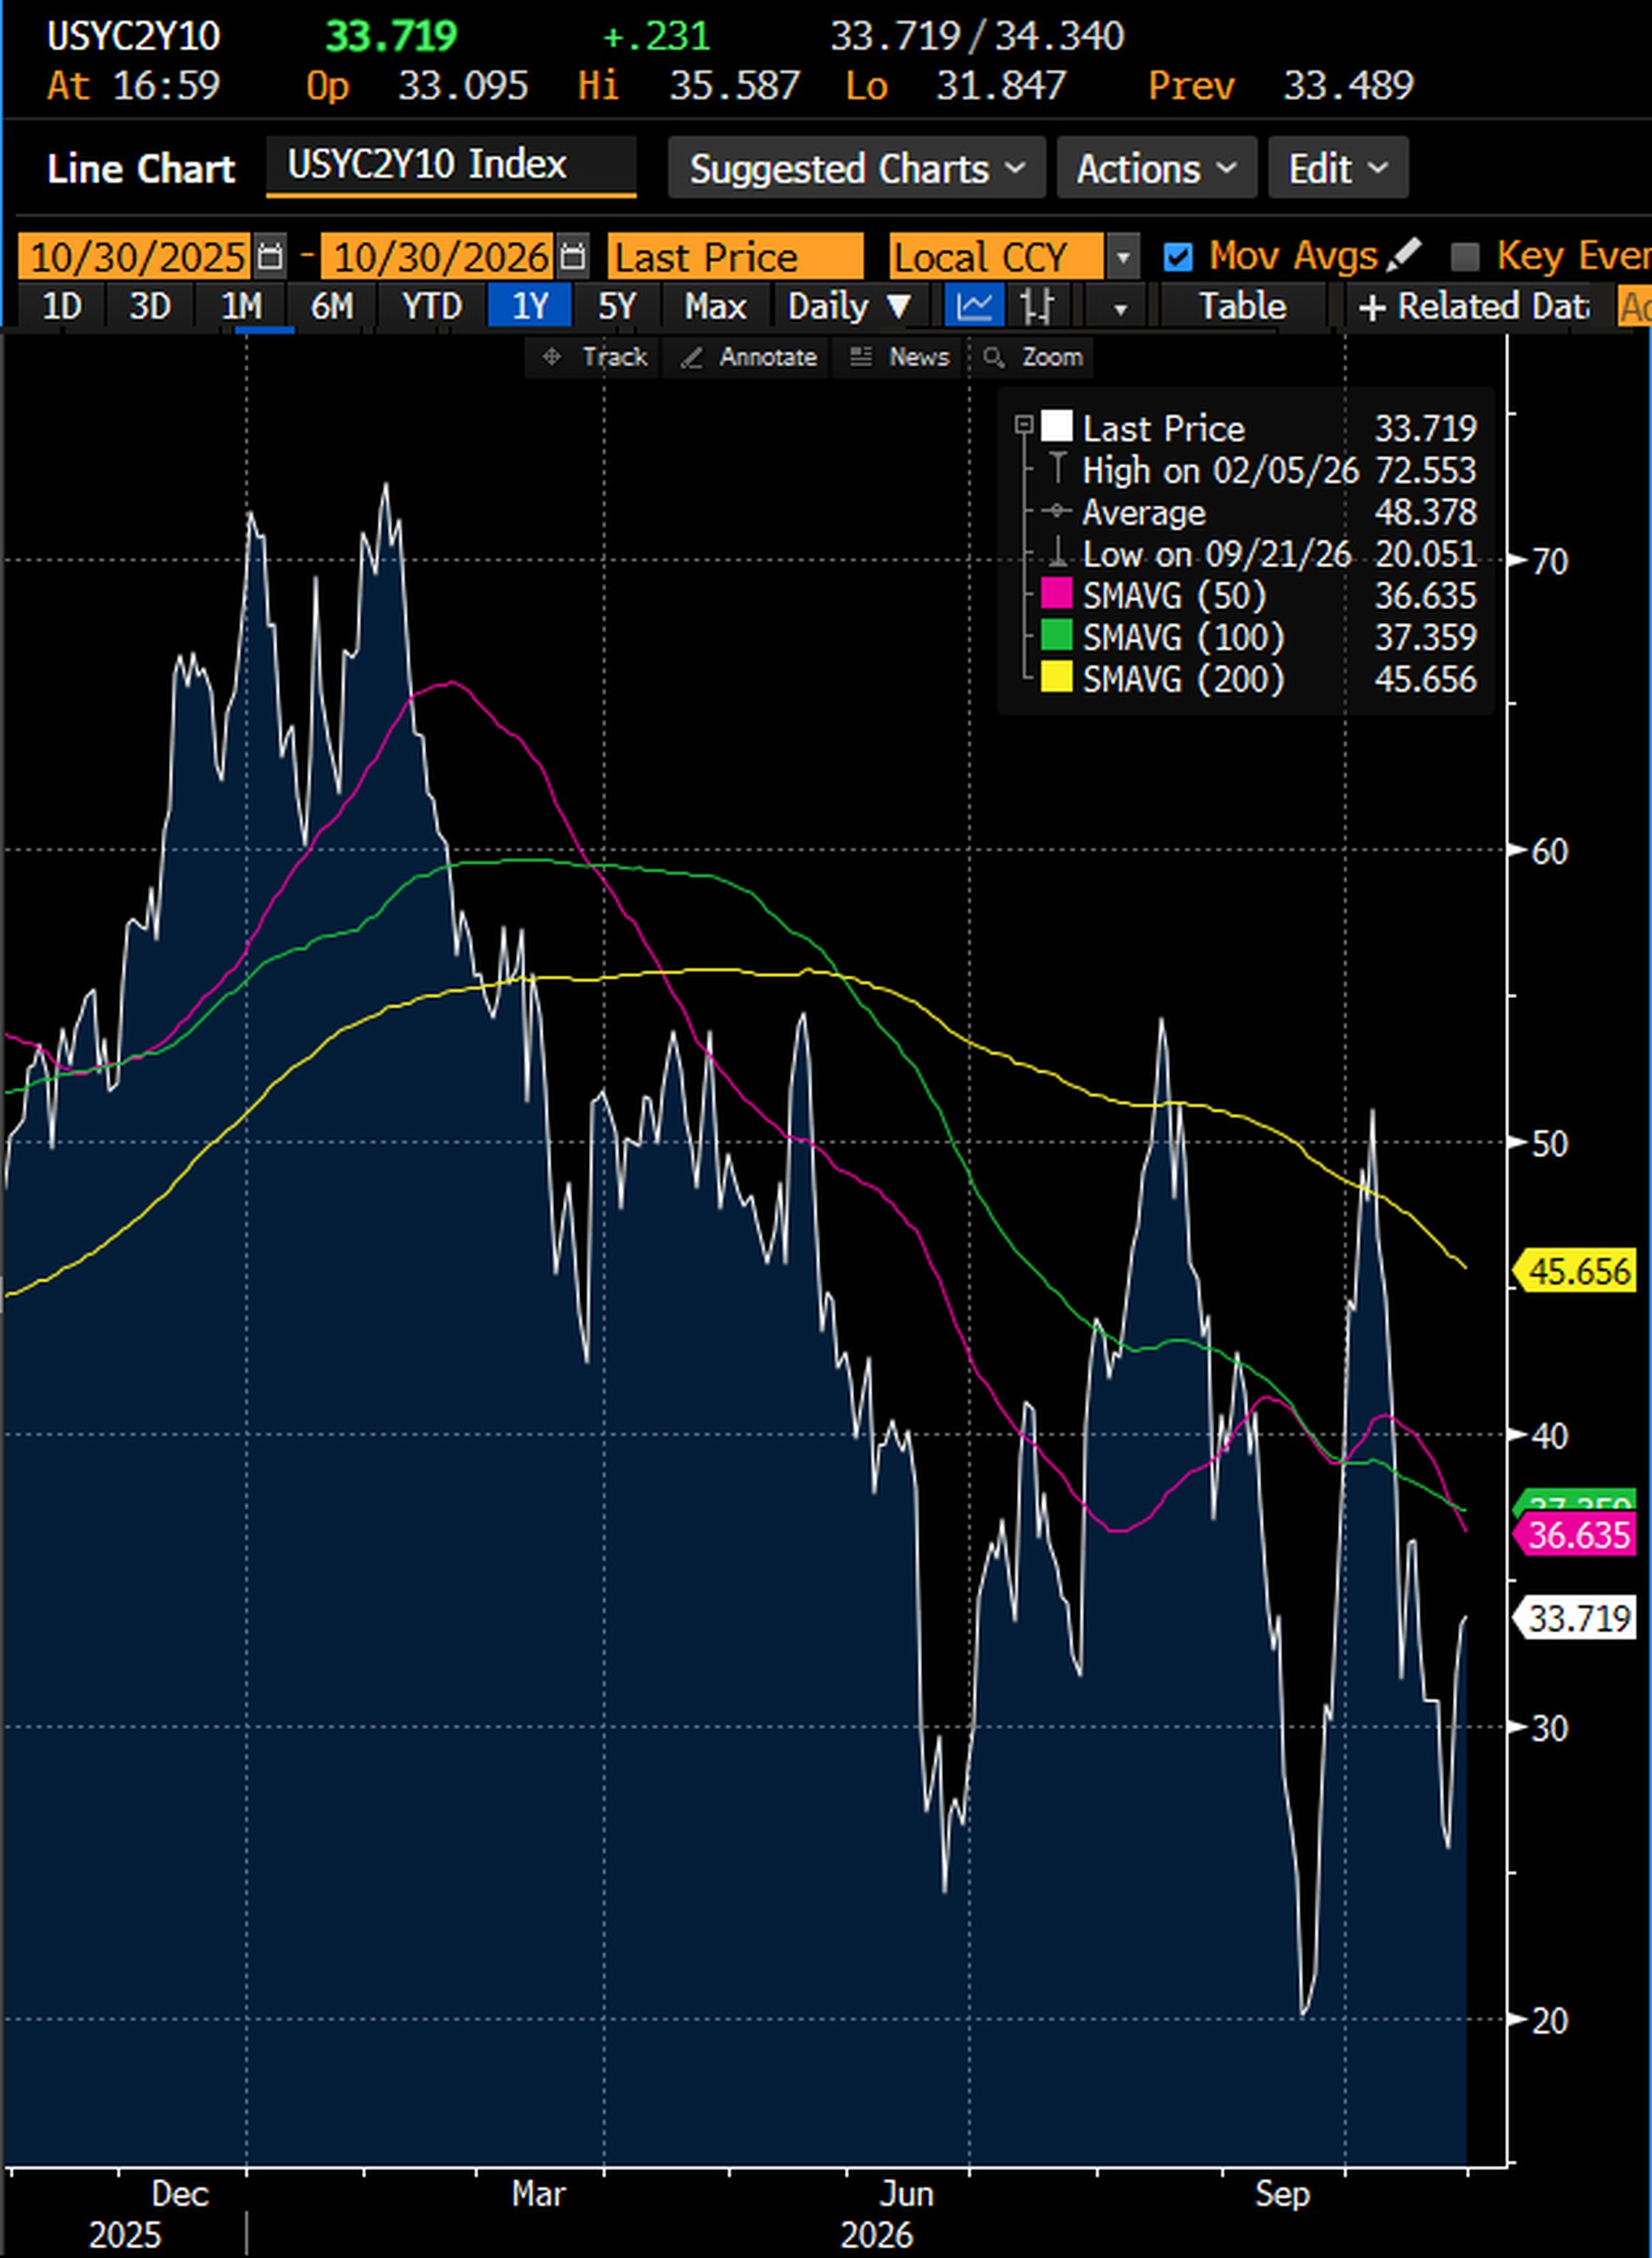
Long yields fell more than short ones. That is a bull flattener: a rally in which the long end does most of the work, because the haven bid lands on duration while the front end, held up by a Fed that is still priced to hike, falls less. On the Treasury's curve the gap between the 10 year and the 2 year yields went from 47 bp on October 5 to 37 bp on October 29. On Bloomberg's generic yields it closed Friday at 33.7 bp, from 33.5 on Thursday.
Who bought? On the crash days themselves, the front end beat the long end. On October 22, when the semiconductor index lost 6.7%, the 2 year fell 16 bp and the 30 year only 13 bp, with the 10 year down 17 bp. In our intraday test during US hours, on October 16 and on October 22, the yield implied by the 2 year note future fell more than that of the ultra bond future. That fingerprint is a Fed repricing: when stocks fall, the market takes hikes out.
Between those days, the long end had a slower buyer, in my view: the pension money I described on October 15, which would show over weeks, not in a single session. At the end of September Goldman Sachs expected US pension funds to sell about $33 billion of equities around quarter end, at the 98th percentile of its estimates since 2000, with the proceeds going to bonds, and JPMorgan Asset Management expected the full effect in the early days of the fourth quarter. The 30 year peaked a week into the quarter, at 5.67% on October 7. I cannot show the pension flows yet, and our intraday test found the front end, not the long end, leading on both big down days since October 15. The 100 largest US corporate plans were 114.5% funded on September 30 according to Milliman, the best since June 2001, and at that level their glide path sells equities and buys long bonds. Milliman's October index, due in early November, will show where funded ratios stand, and the Treasury's October STRIPS data, due November 5, how much long duration was bought.
The trend followers added to the front end bid. Nomura's estimates, reported on October 24, showed that they had covered about $68 billion of bond futures and $38 billion of short rate futures in two weeks. Our trend model tells the same story: the largest single session of buying was October 22, mostly in the 2 year note, and very little in the long end. Their short term signals have turned long across the curve. Their medium and long term signals are still short.
That leaves a second stage loaded. Nomura's estimates, reported the same day, showed that a further 2% rally in bond futures would force about $256 billion of global bond buying by trend followers, and a 2% rally in short rate futures about $264 billion more, against only about $53 billion and $33 billion of selling on a 2% sell off. Our own model points the same way: the trend followers would buy far more on a rally than they would sell on a drop.
The basis trade sits in the way
The basis trade is one of the largest leveraged positions in the Treasury market. A hedge fund buys a Treasury bond, borrows the cash overnight in the repo market with the bond as collateral, and sells the matching futures contract. Asset managers like to hold long futures, which give them duration without tying up cash, so futures trade slightly rich to the bonds they track. The hedge fund collects that small gap until delivery. Because the gap is thin, the trade runs with leverage, often fifty times.
In the CFTC's weekly report on Treasury futures, leveraged funds were short about $474 million per basis point on October 20, and asset managers long about $652 million. That measure is the DV01, the dollar change in value for a one basis point move in yields. The leveraged short is 25% below its record of $632 million of November 18, 2025, but it has been growing again since October 6, when it stood at $458 million. On the 10 year note future alone, leveraged funds were short 2.1 million contracts, more than in 86.5% of the weeks of the last five years. The report for October 27, published on Friday, showed them adding about 120,000 contracts, to 2.23 million, shorter than in 90% of the weeks of the last five years. In Bloomberg's summary of the same report, speculators sold the front end ahead of the Fed, adding 153,000 contracts of shorts in 2 year notes, while buying 5 year notes, ultra 10 year notes and bonds.
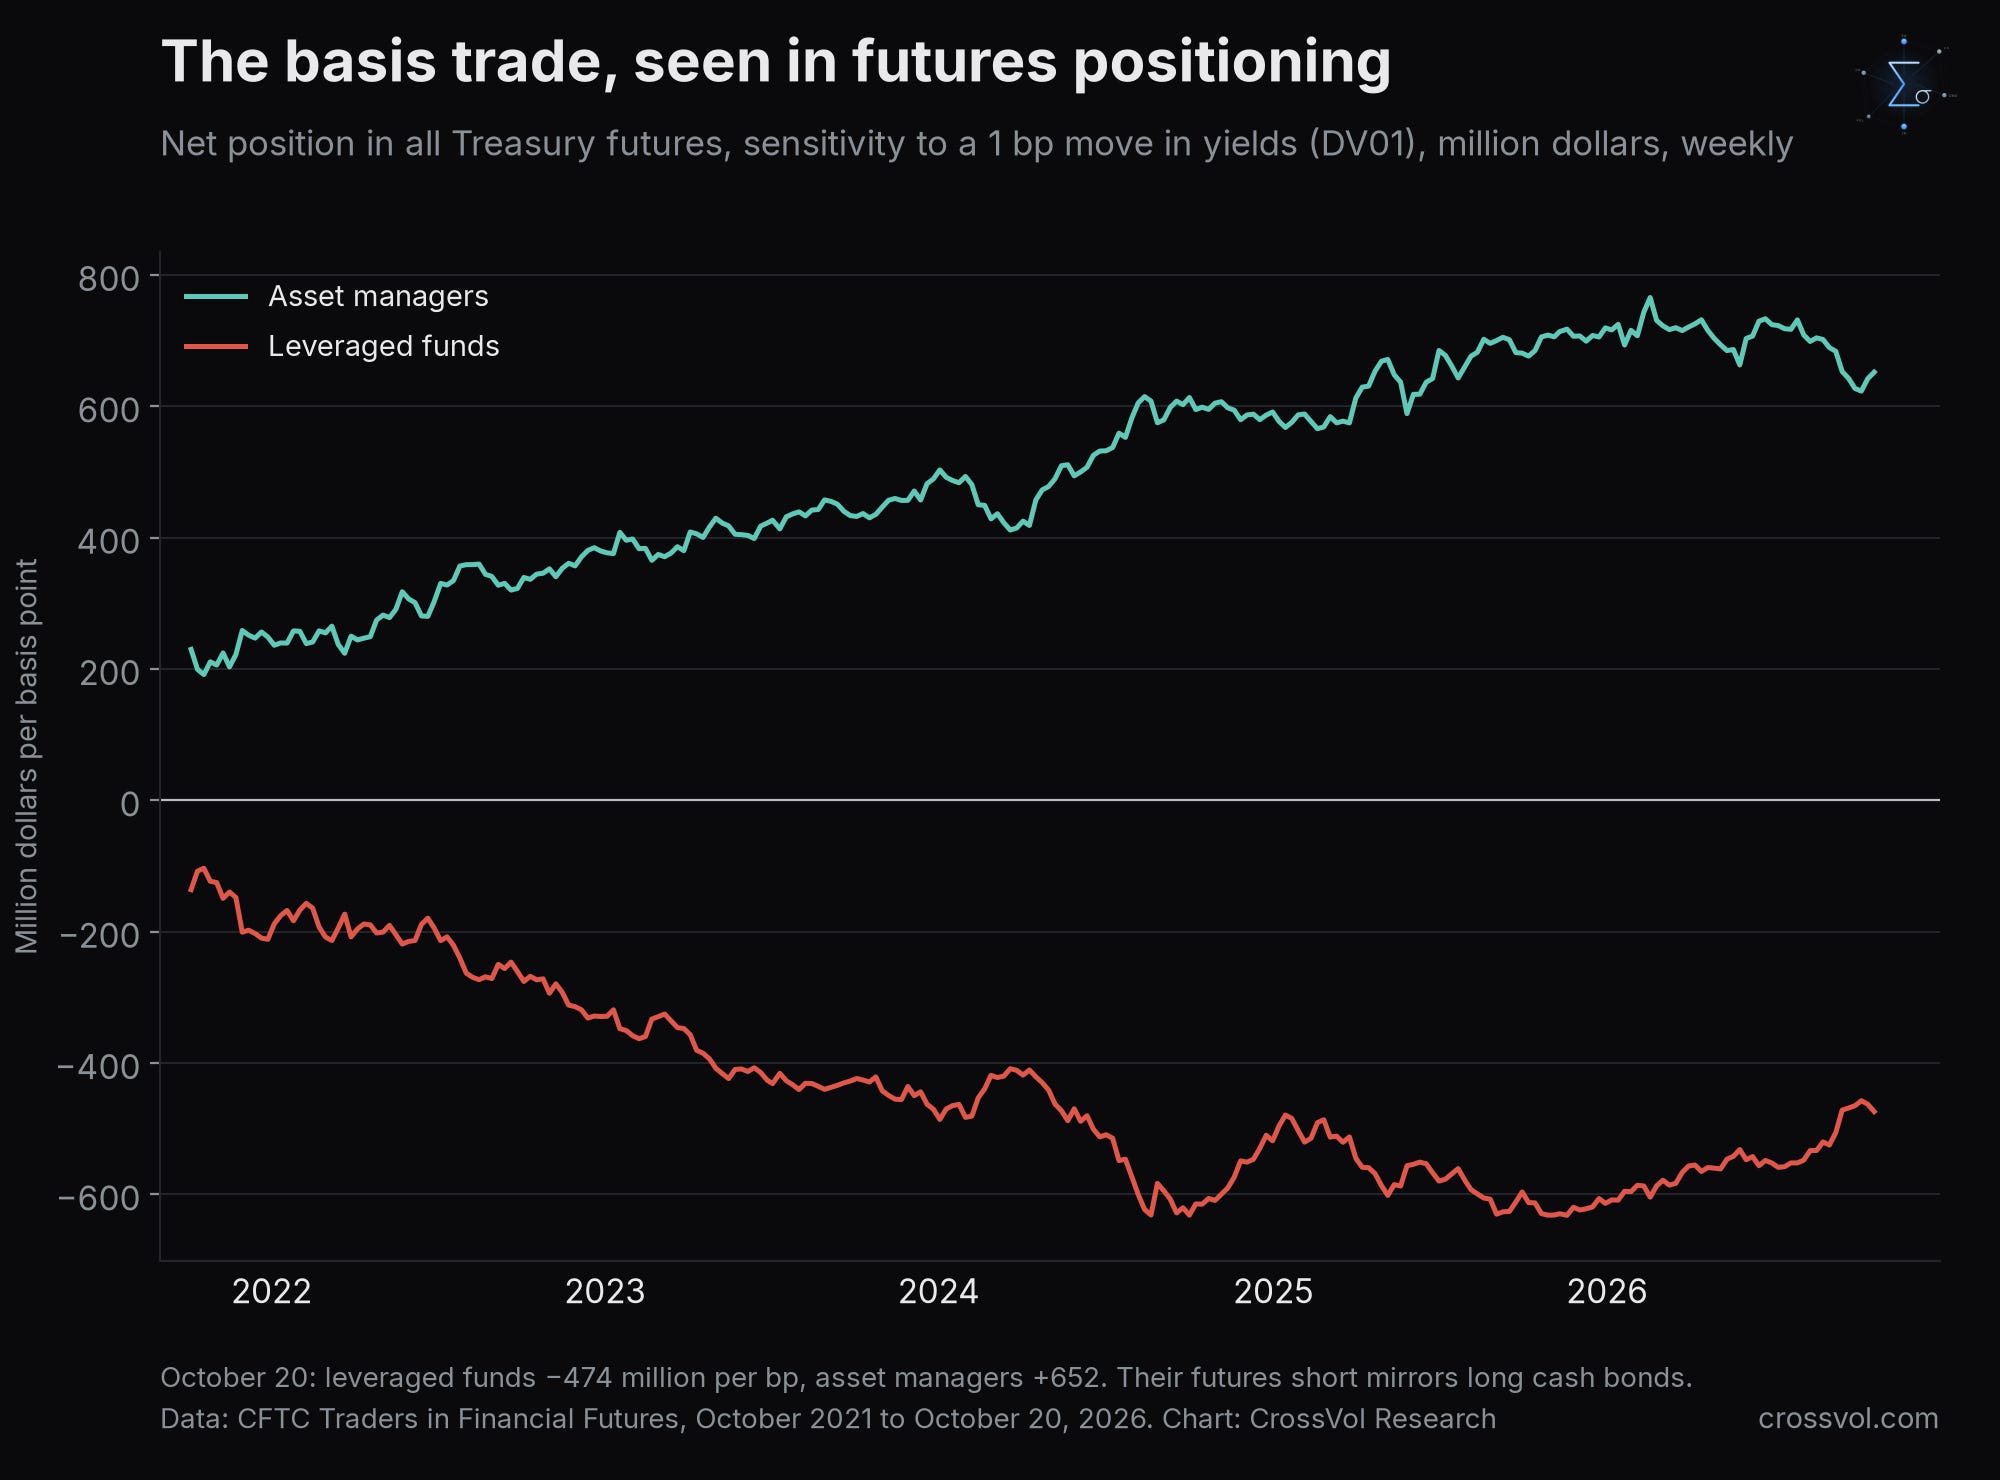
The trend followers are a small part of that short, on our model. Most of the rest is the basis trade and other relative value positions.
On September 22 I wrote that the basis book had shrunk, to about $900 billion from $1.26 trillion at the start of the year, while its long end had grown: "The number got smaller. The risk got sharper." A blog post by two researchers of the Office of Financial Research, the Treasury's research office, estimated in August that hedge funds held about $2.0 trillion of cash Treasuries at the end of 2025, a record 7% of the marketable debt, and warned: "If repo rates spike or futures margin requirements increase abruptly, hedge funds may be forced to unwind positions rapidly." Here is why a haven bid is the danger now. The trade is hedged against the level of yields, not against the way they get there, and three things break it.
Futures that run ahead of cash. When the haven bid comes through futures, as it does when trend followers cover or asset managers add duration, futures rise faster than the bonds they hedge. The fund that is long the bond and short the future loses on the gap. It pays the full loss on its short futures in cash every day, as variation margin, while the gain on the bond comes back through the repo lender, which revalues the collateral every day but keeps a haircut. That is what the trend followers' buying of October 22 does, and it came mostly in the 2 and 5 year futures, where leveraged funds hold their largest shorts in face value: 1.29 million 2 year and 2.12 million 5 year contracts on October 20, about $470 billion.
Margins. Exchanges raise the margin required on futures when volatility jumps. The MOVE index, the implied volatility of Treasury options, went from 95.9 to 106.8 on October 22, fell back to 93.5 by October 29, and jumped to 100.2 on Friday.
Funding. The trade is financed overnight. If repo rates rise or lenders demand bigger haircuts, the carry disappears and the position has to shrink. SOFR printed 3.94% on October 28 and 29, near the top of its October range of 3.87% to 3.95%, and above the rate the Fed pays banks on their reserves, by more than usual.
The order of magnitude: with a short of $474 million per basis point, a fall of about 30 bp in yields across the curve, which is what October 5 to October 29 delivered, means about $14 billion of variation margin paid on the futures leg over those weeks, if the position had not changed. Most of it came back through the bonds, which are revalued every day in repo. The danger is the day the two legs stop matching: a squeeze in futures, a higher haircut or a spike in repo. In March 2020 the haven bid went to bills and futures while cash bonds were sold, the basis blew out, and the funds had to unwind into a market that could not absorb them. The Fed had to buy Treasuries on a scale never seen before.
Nothing in the bond market shows forced selling yet. The 30 year swap spread, the swap rate minus the Treasury yield, was minus 64.1 bp, inside its six month range of minus 79.9 to minus 59.2. Our hedge fund deleveraging gauge is high, a little below its peak of the year, after a sharp rise in October. What I watch: the next CFTC report, due on November 6, the Treasury's refunding announcement on November 4, which says how many more bonds it will sell, and SOFR against the rate on reserves into year end, when banks shrink their balance sheets.
Inflation is not cooperating, and the Fed knows it
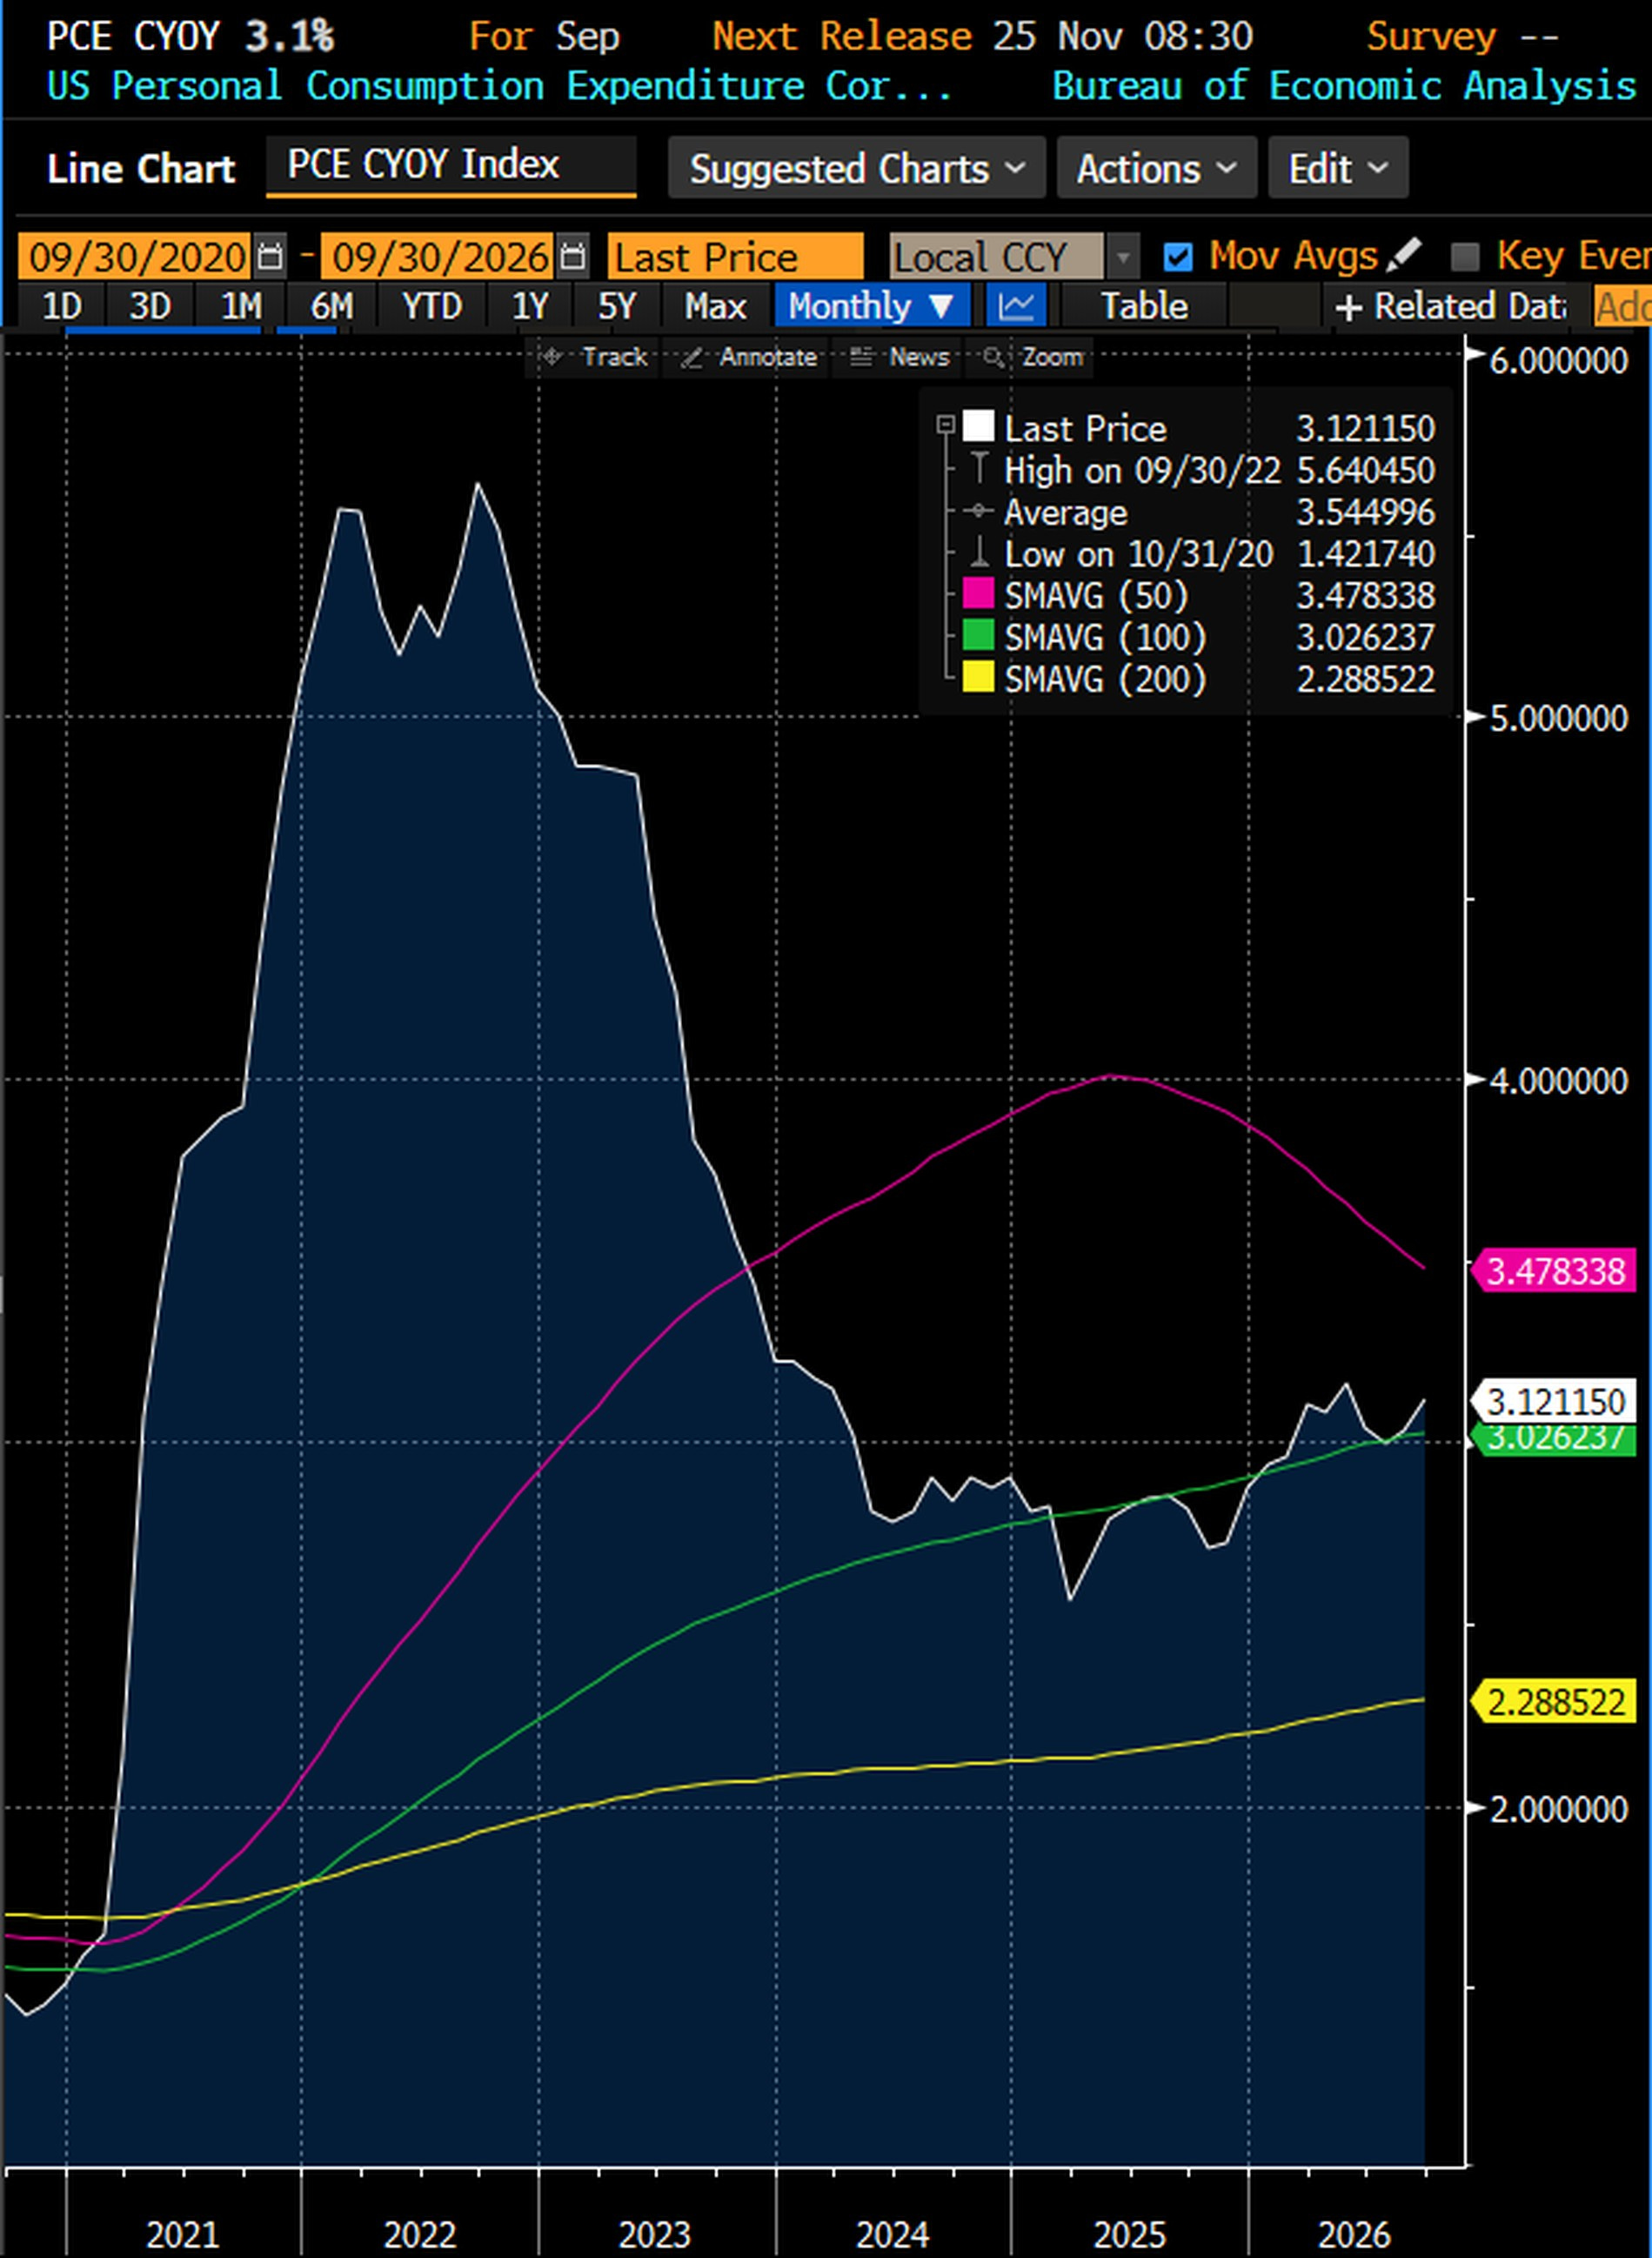
The data first. The PCE price index rose 3.6% in the year to September, up from 3.4% in August. Core PCE, which excludes food and energy and is the Fed's preferred gauge, rose 3.1%. Consumer prices rose 3.7% in the year to September. The five year chart of core PCE shows the problem: the fall from the 2022 peak of 5.6% stalled in 2024, and the line has turned up since late 2025.
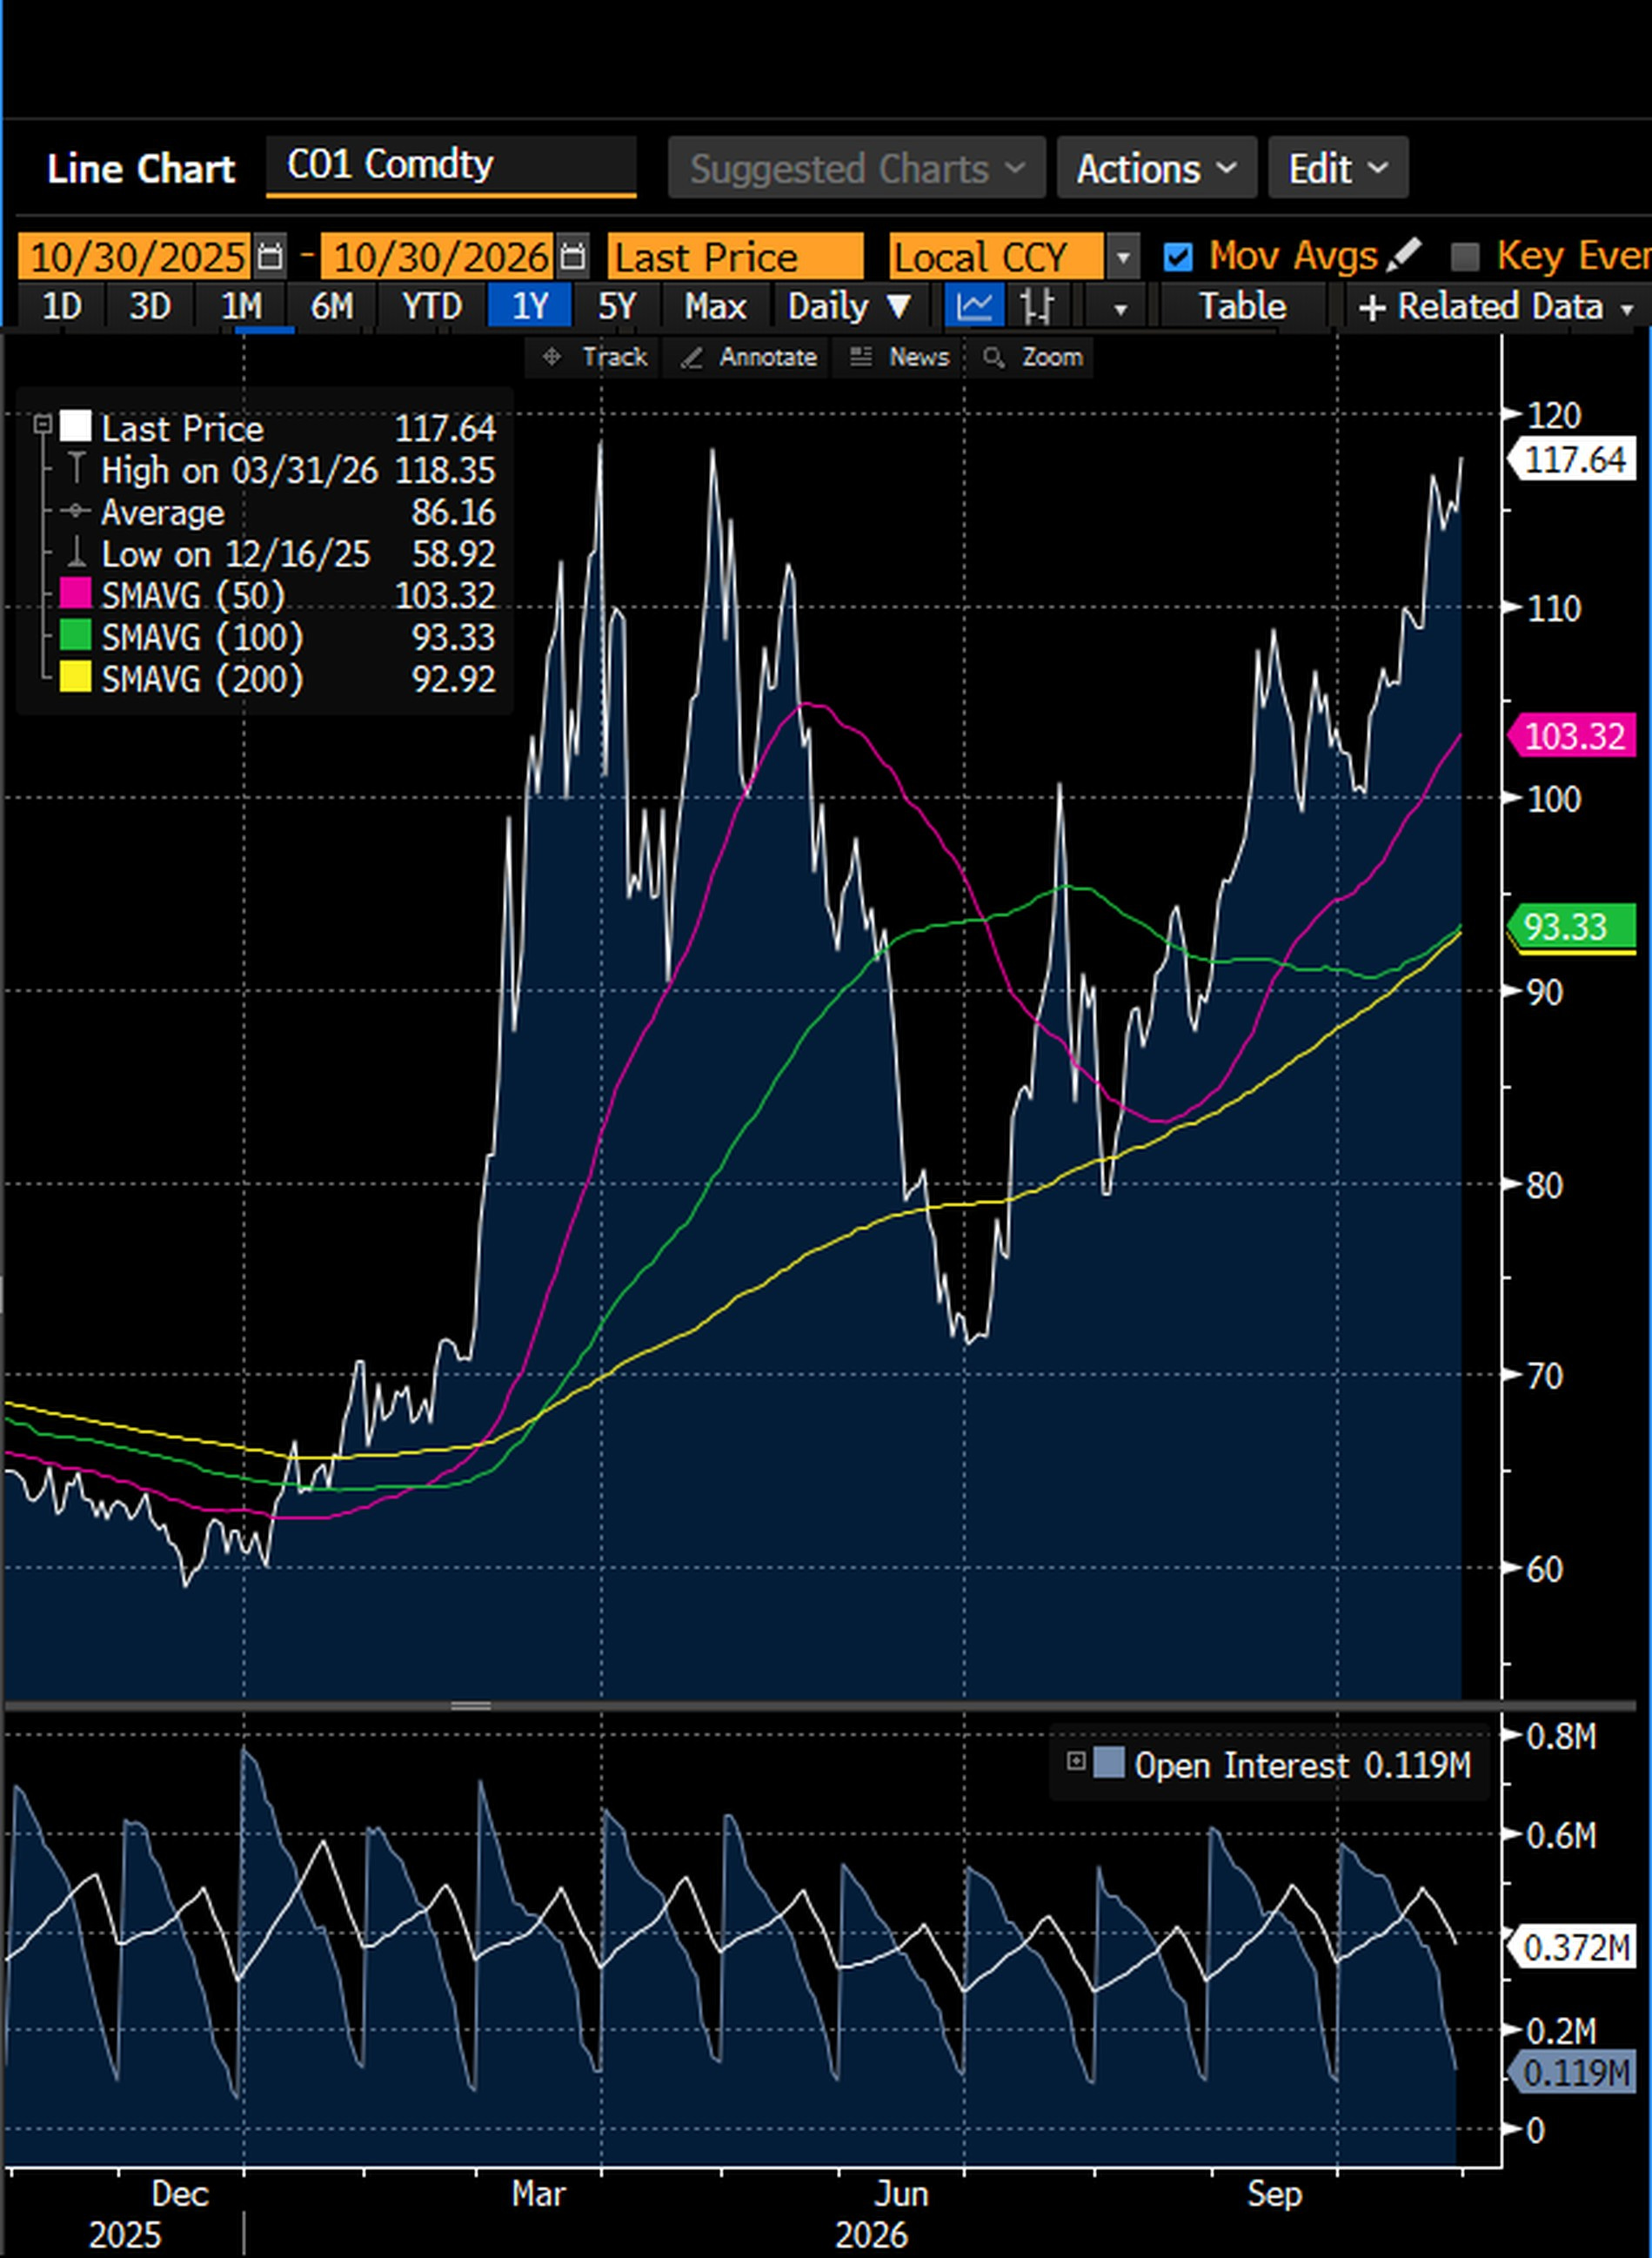
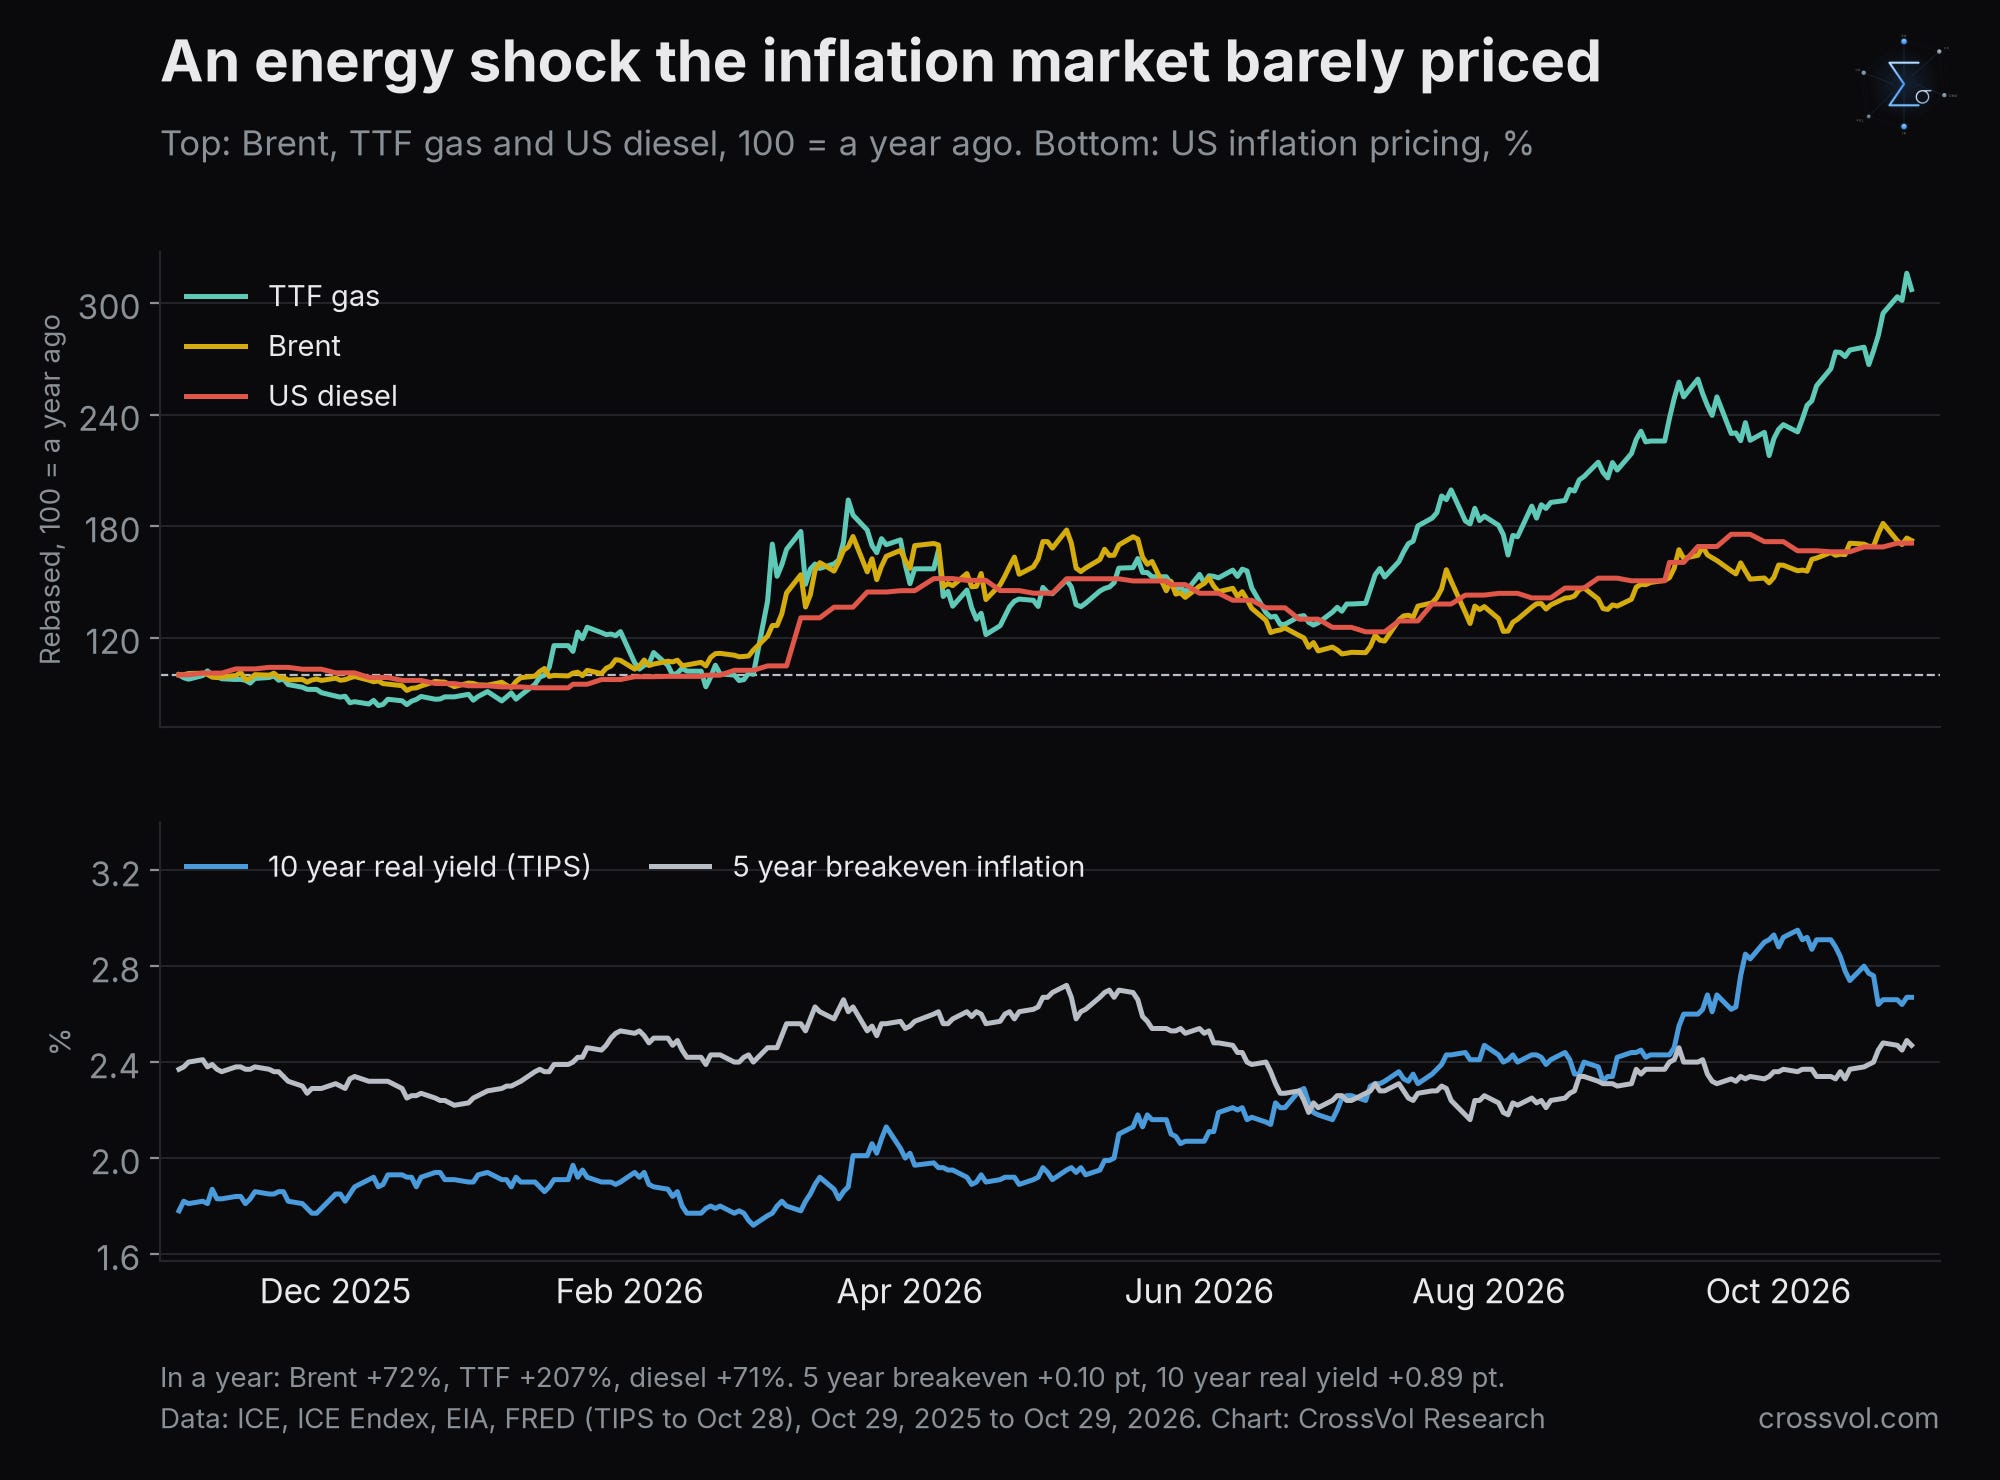
The source is energy. In a year, Brent crude has risen 72%, European gas (TTF) 207% and US diesel 71%. The January Brent contract, the front month since Friday's expiry, ended Friday's session at $112.33, against $110.80 on Thursday. The contract for delivery nine months ahead closed at $93.08 on Thursday, close to its one year high: the oil market prices expensive energy well into 2027. European gas closed at €103.19 per megawatt hour on Friday, up 4.7% on the day.
Oil is trading like a haven. On Friday, as AI stocks, gold and the hedge fund favourites were sold, two markets took the money: Treasuries and crude. The December Brent contract, which expired that day, traded as high as $118.00 and settled at $117.64, up $2.76, close to the year's highest close of $118.35 on March 31 and far above its one year average of $86.16. After the close, Bloomberg's Markets Live strategist Frank Monkam made the same observation: besides Treasuries, oil was arguably the only major market left to hide in, with the risk of a new escalation with Iran behind the bid. He also noted that the six month average of Brent's expiry spreads is near its highest in at least a decade: buyers pay up for barrels now rather than later, the sign of a market short of supply, not of demand. Bonds price the slowdown and oil prices the shortage. Together they are what stagflation looks like before it reaches the data. And they tie the Fed's hands. With inflation still elevated and energy adding to the upside risks, the same strategist wrote, the Fed has "considerably less room" to soften the blow.
What the bond market prices is much less. The 5 year breakeven, the inflation rate that equalizes a regular and an inflation protected Treasury, rose only 0.10 point in a year. The market priced the shock in real rates instead: the 10 year real yield rose 0.89 point. In other words, the bond market trusts the Fed to kill this inflation by keeping real rates high, and expects the slowdown to finish the job.
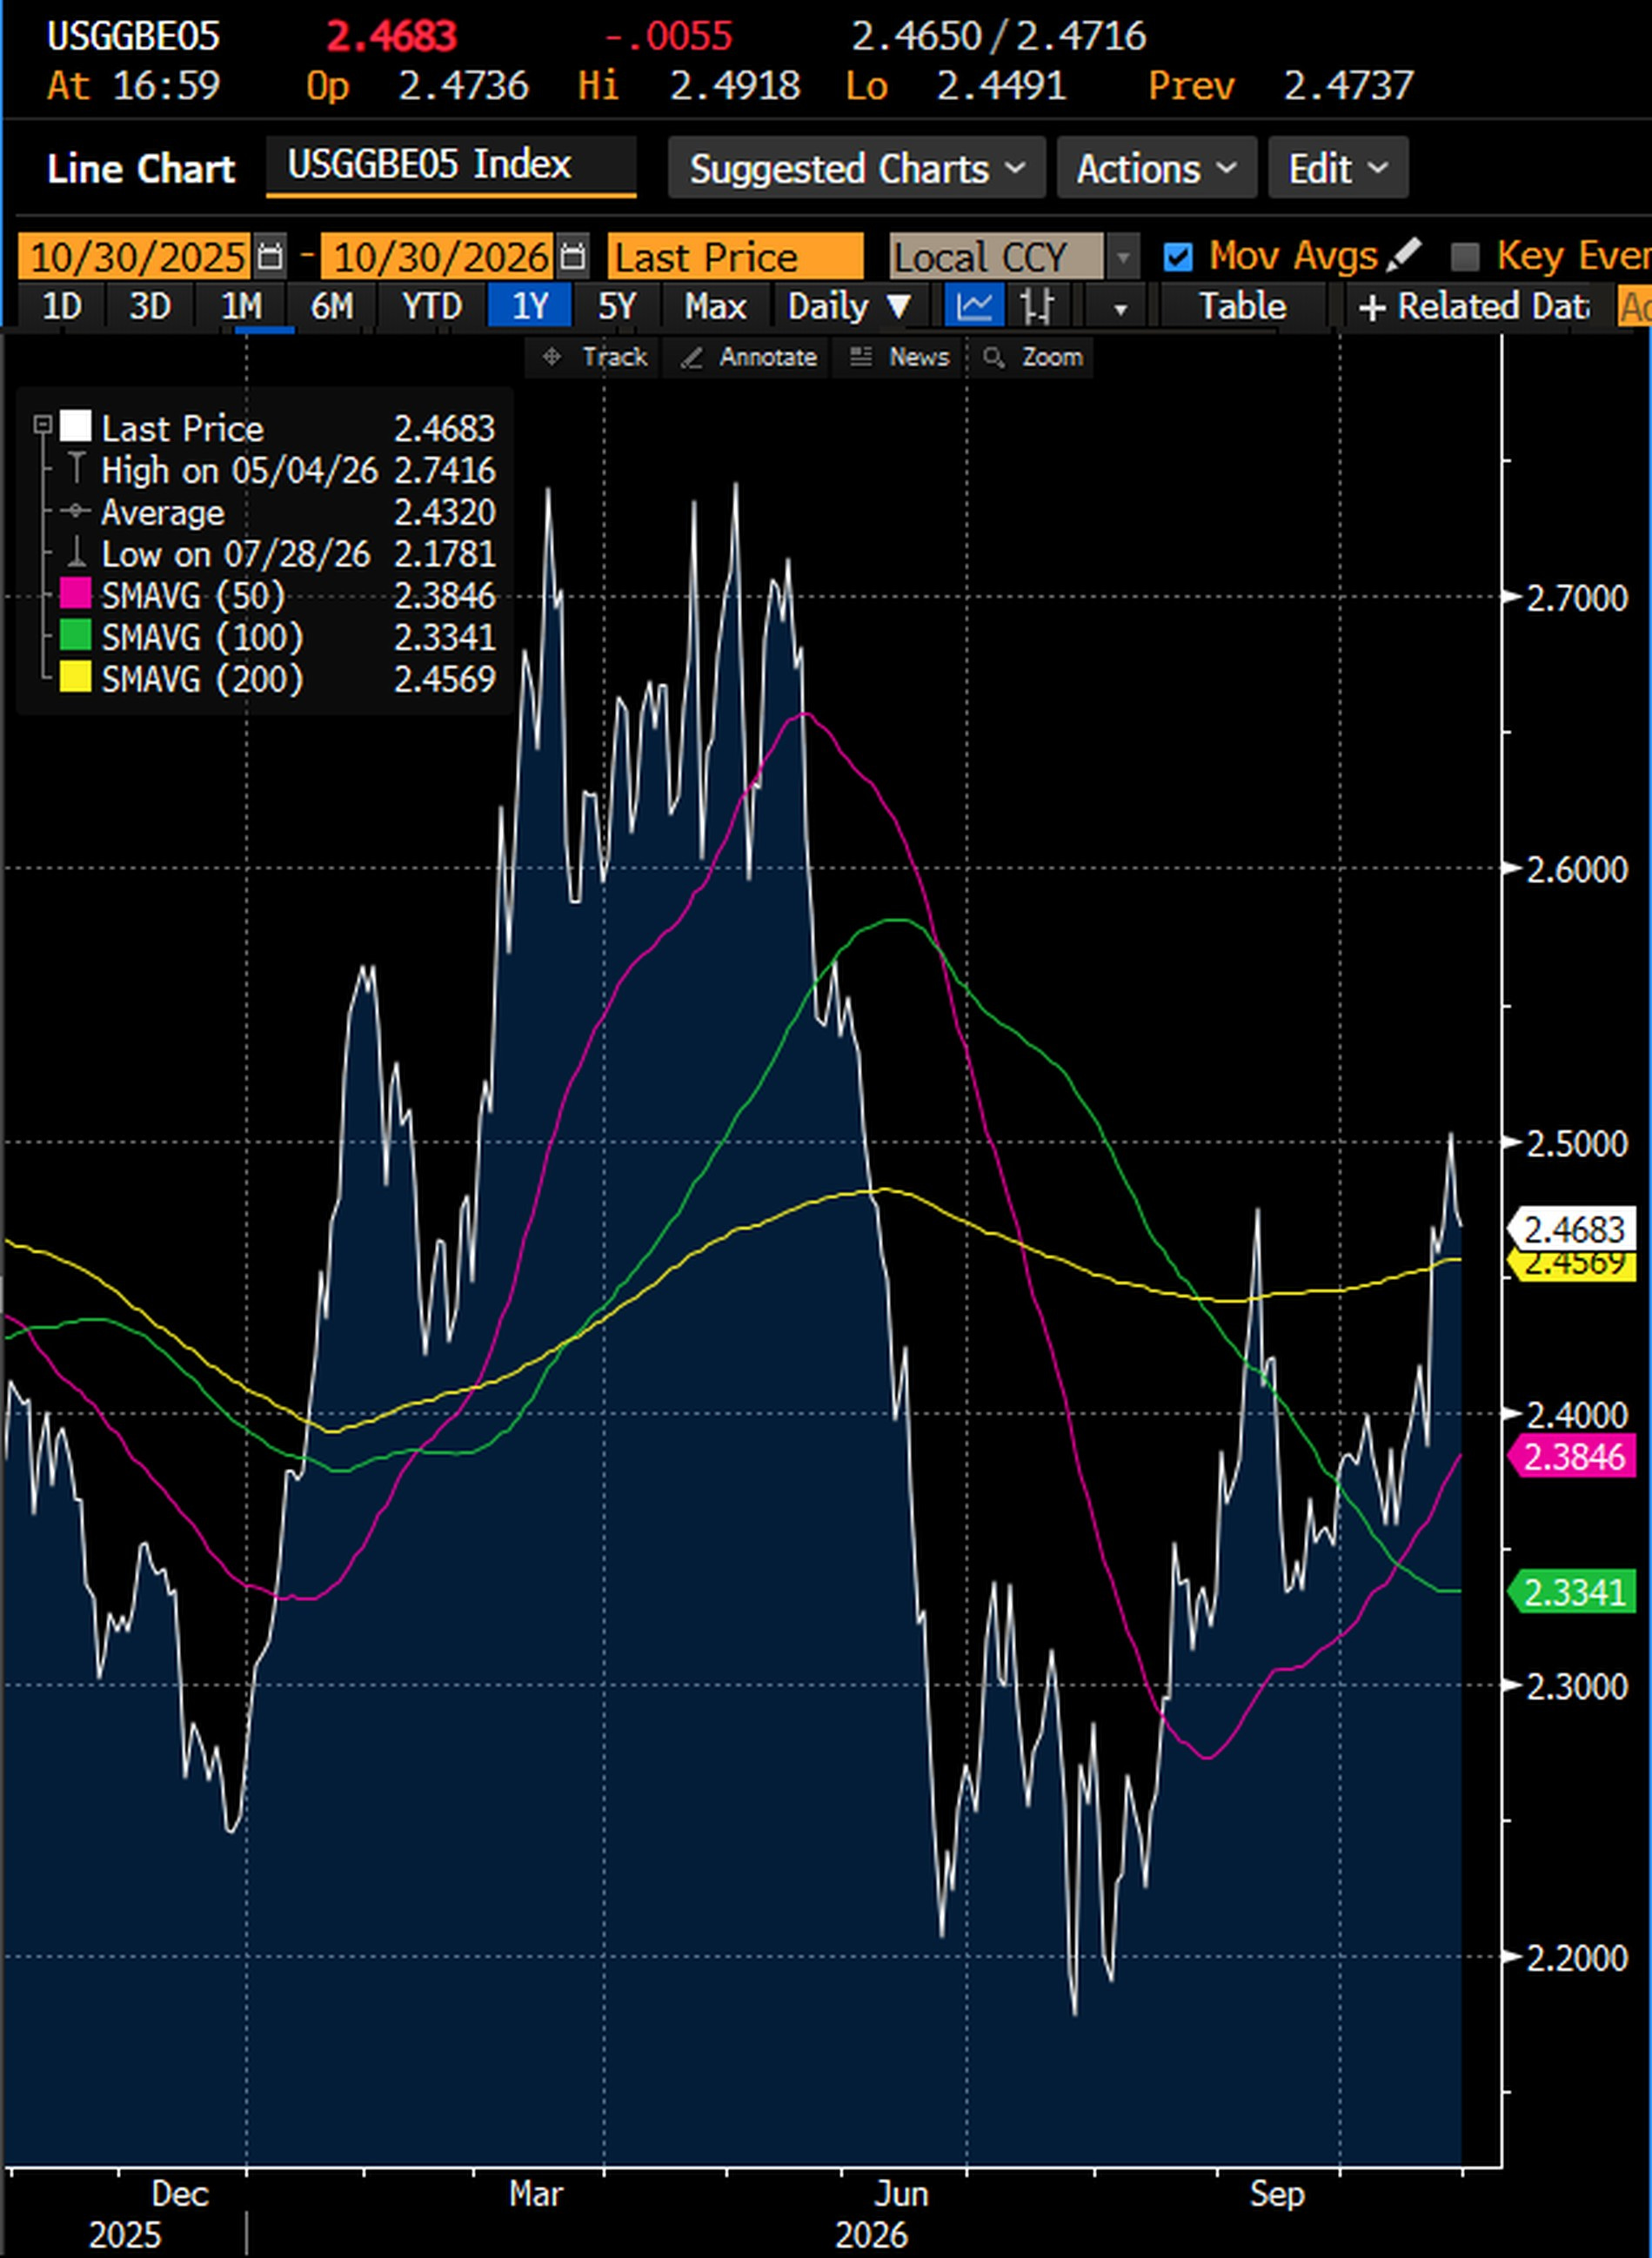
The breakeven is not asleep, though. At 2.47% at Friday's close it is 29 bp above its July 28 low of 2.18%, and below its May 4 high of 2.74%. And since October 5 the mix has turned: the 10 year real yield fell 28 bp while the 5 year breakeven rose 11 bp. Falling real yields with rising breakevens is how the bond market starts to doubt that the Fed will hold the line.
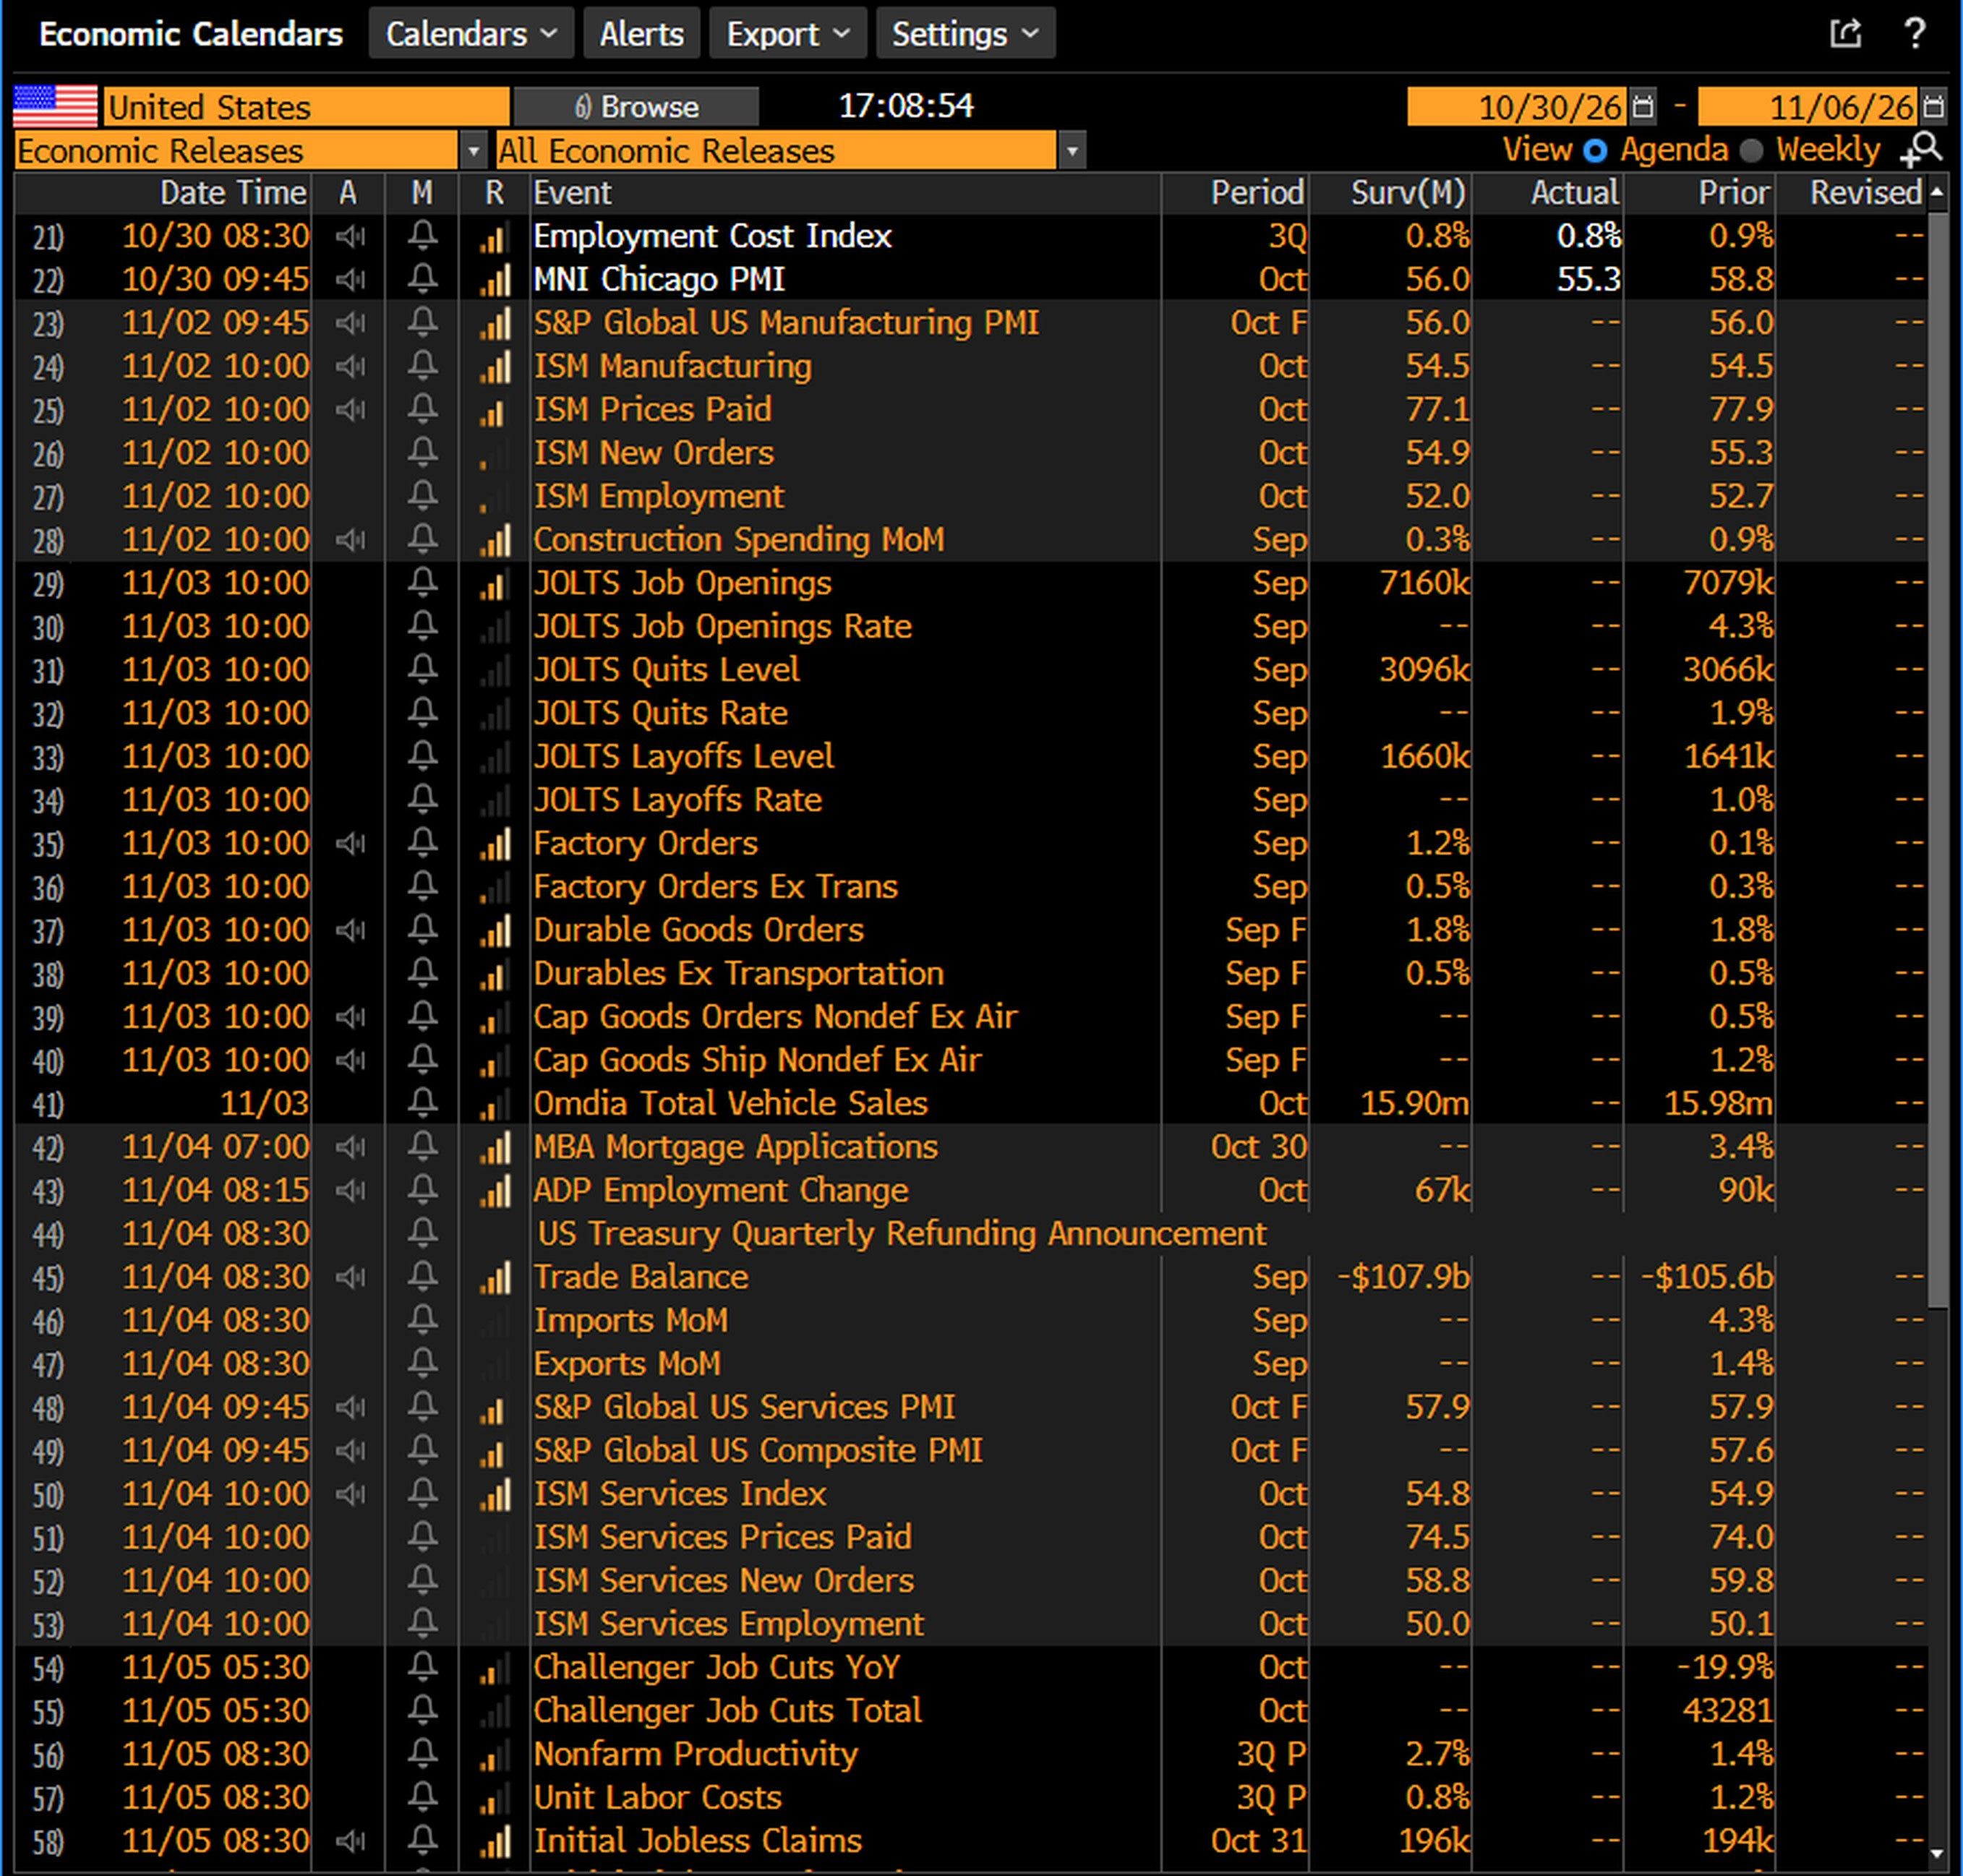
Wages are not the problem yet. The employment cost index rose 0.8% in the third quarter, in line with forecasts, after 0.9%, and 3.4% over a year. Prices paid by companies are. The ISM manufacturing prices index was 77.9 in September and is forecast at 77.1 for October. In services, the forecast is 74.5 after 74.0.
The Fed's choice. On Wednesday the Fed kept its target range at 3.75% to 4%, by 10 votes to 2. The two dissenters, Governor Lisa Cook and Cleveland Fed President Beth Hammack, wanted a quarter point hike. The statement says that activity "is expanding at a strong pace" and that "Inflation remains elevated." With the effective fed funds rate at 3.88% and PCE inflation at 3.6%, the real policy rate is about 0.3 point. That is barely restrictive, with energy near one year highs.
So why hold, with strong growth and elevated inflation? There are two readings. In the first, the Fed is behind the curve and knows it, which is what the two dissents say. In the second, the Fed sees the slowdown coming, in AI and in credit, and lets it do the work. Chair Warsh pointed that way, with a caveat. He said financial and credit conditions "have tightened for some businesses and households, much as we would expect," but that he was "unwilling and unable to call them tight." And: "You've seen credit spreads for certain assets widen out, gap out." This week the bond market chose the second reading. After the hold and a PCE print in line with forecasts, the 2 year yield fell 6 bp on Thursday, SOFR futures priced fewer hikes, and the 5 year breakeven eased.
But futures still price a hike in December. On Bloomberg's World Interest Rate Probability page at Friday's close, fed funds futures gave a 72.9% probability of a hike on December 9, and the implied rate peaks at 4.464% in September 2027, about 2.3 quarter point hikes above the effective rate of 3.88%. The Fed is not alone. Overnight index swaps, the contracts that price the average policy rate over a period, gave 82.3% to an ECB hike on December 17, 95.6% to a Bank of England hike on November 5, 80.3% to a Reserve Bank of Australia hike on November 3, and 80.9% to a Bank of Japan hike on December 18.
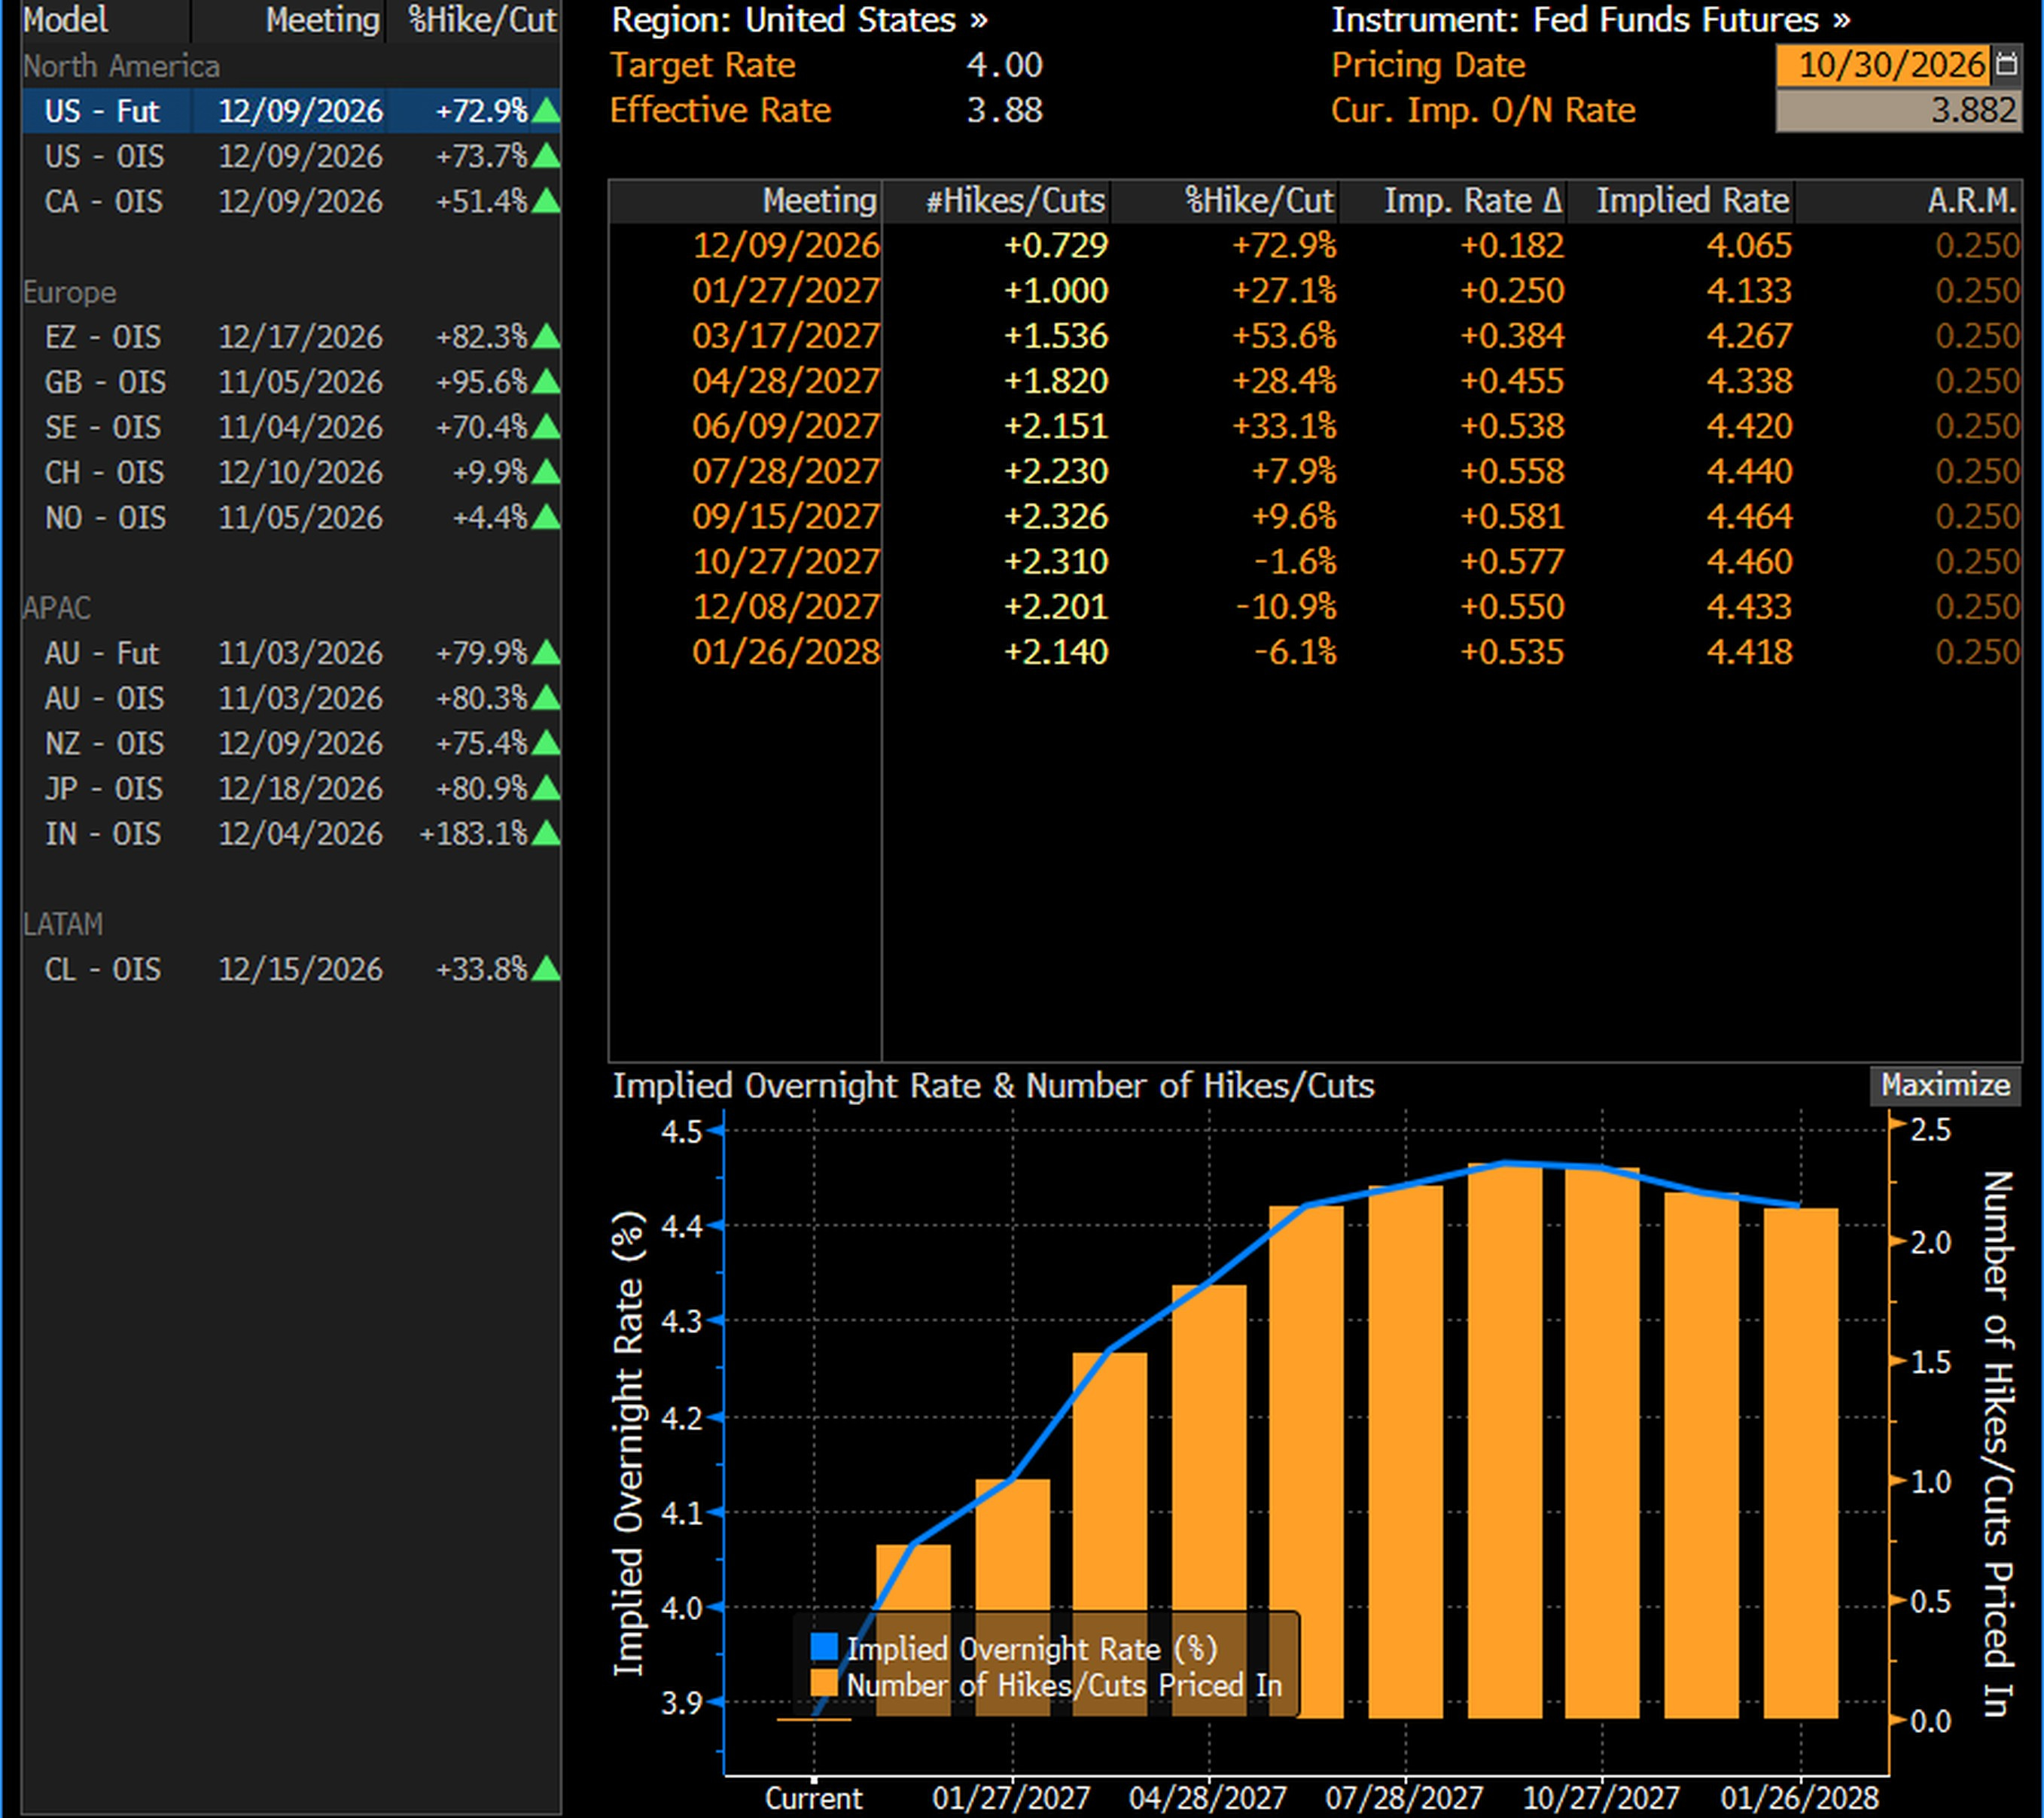
That is what an energy shock does. Almost every large central bank is priced to tighten while growth slows. Here is the bet I question. The bond market is betting the slowdown will do the Fed's job. If it does not, the Fed is late, with inflation at 3.6% and energy near one year highs, and 2027 starts with a central bank that has to choose between growth and prices.
Credit: stress where the leverage is
On October 13 I wrote that Act 4 would arrive through the credit that finances AI. It did, and it peaked a week later.
Bloomberg's US high yield index spread reached 338 bp on October 22, its widest of the year and 88 bp above its January 22 low of 250. The spread here is the OAS, the average extra yield over Treasuries after removing the value of the call options some bonds carry. It eased early this week, then widened again on Thursday, the day Alphabet fell 12.6%, to 323 bp. The investment grade spread is 87 bp, close to its one year high of 93 bp of March 16.
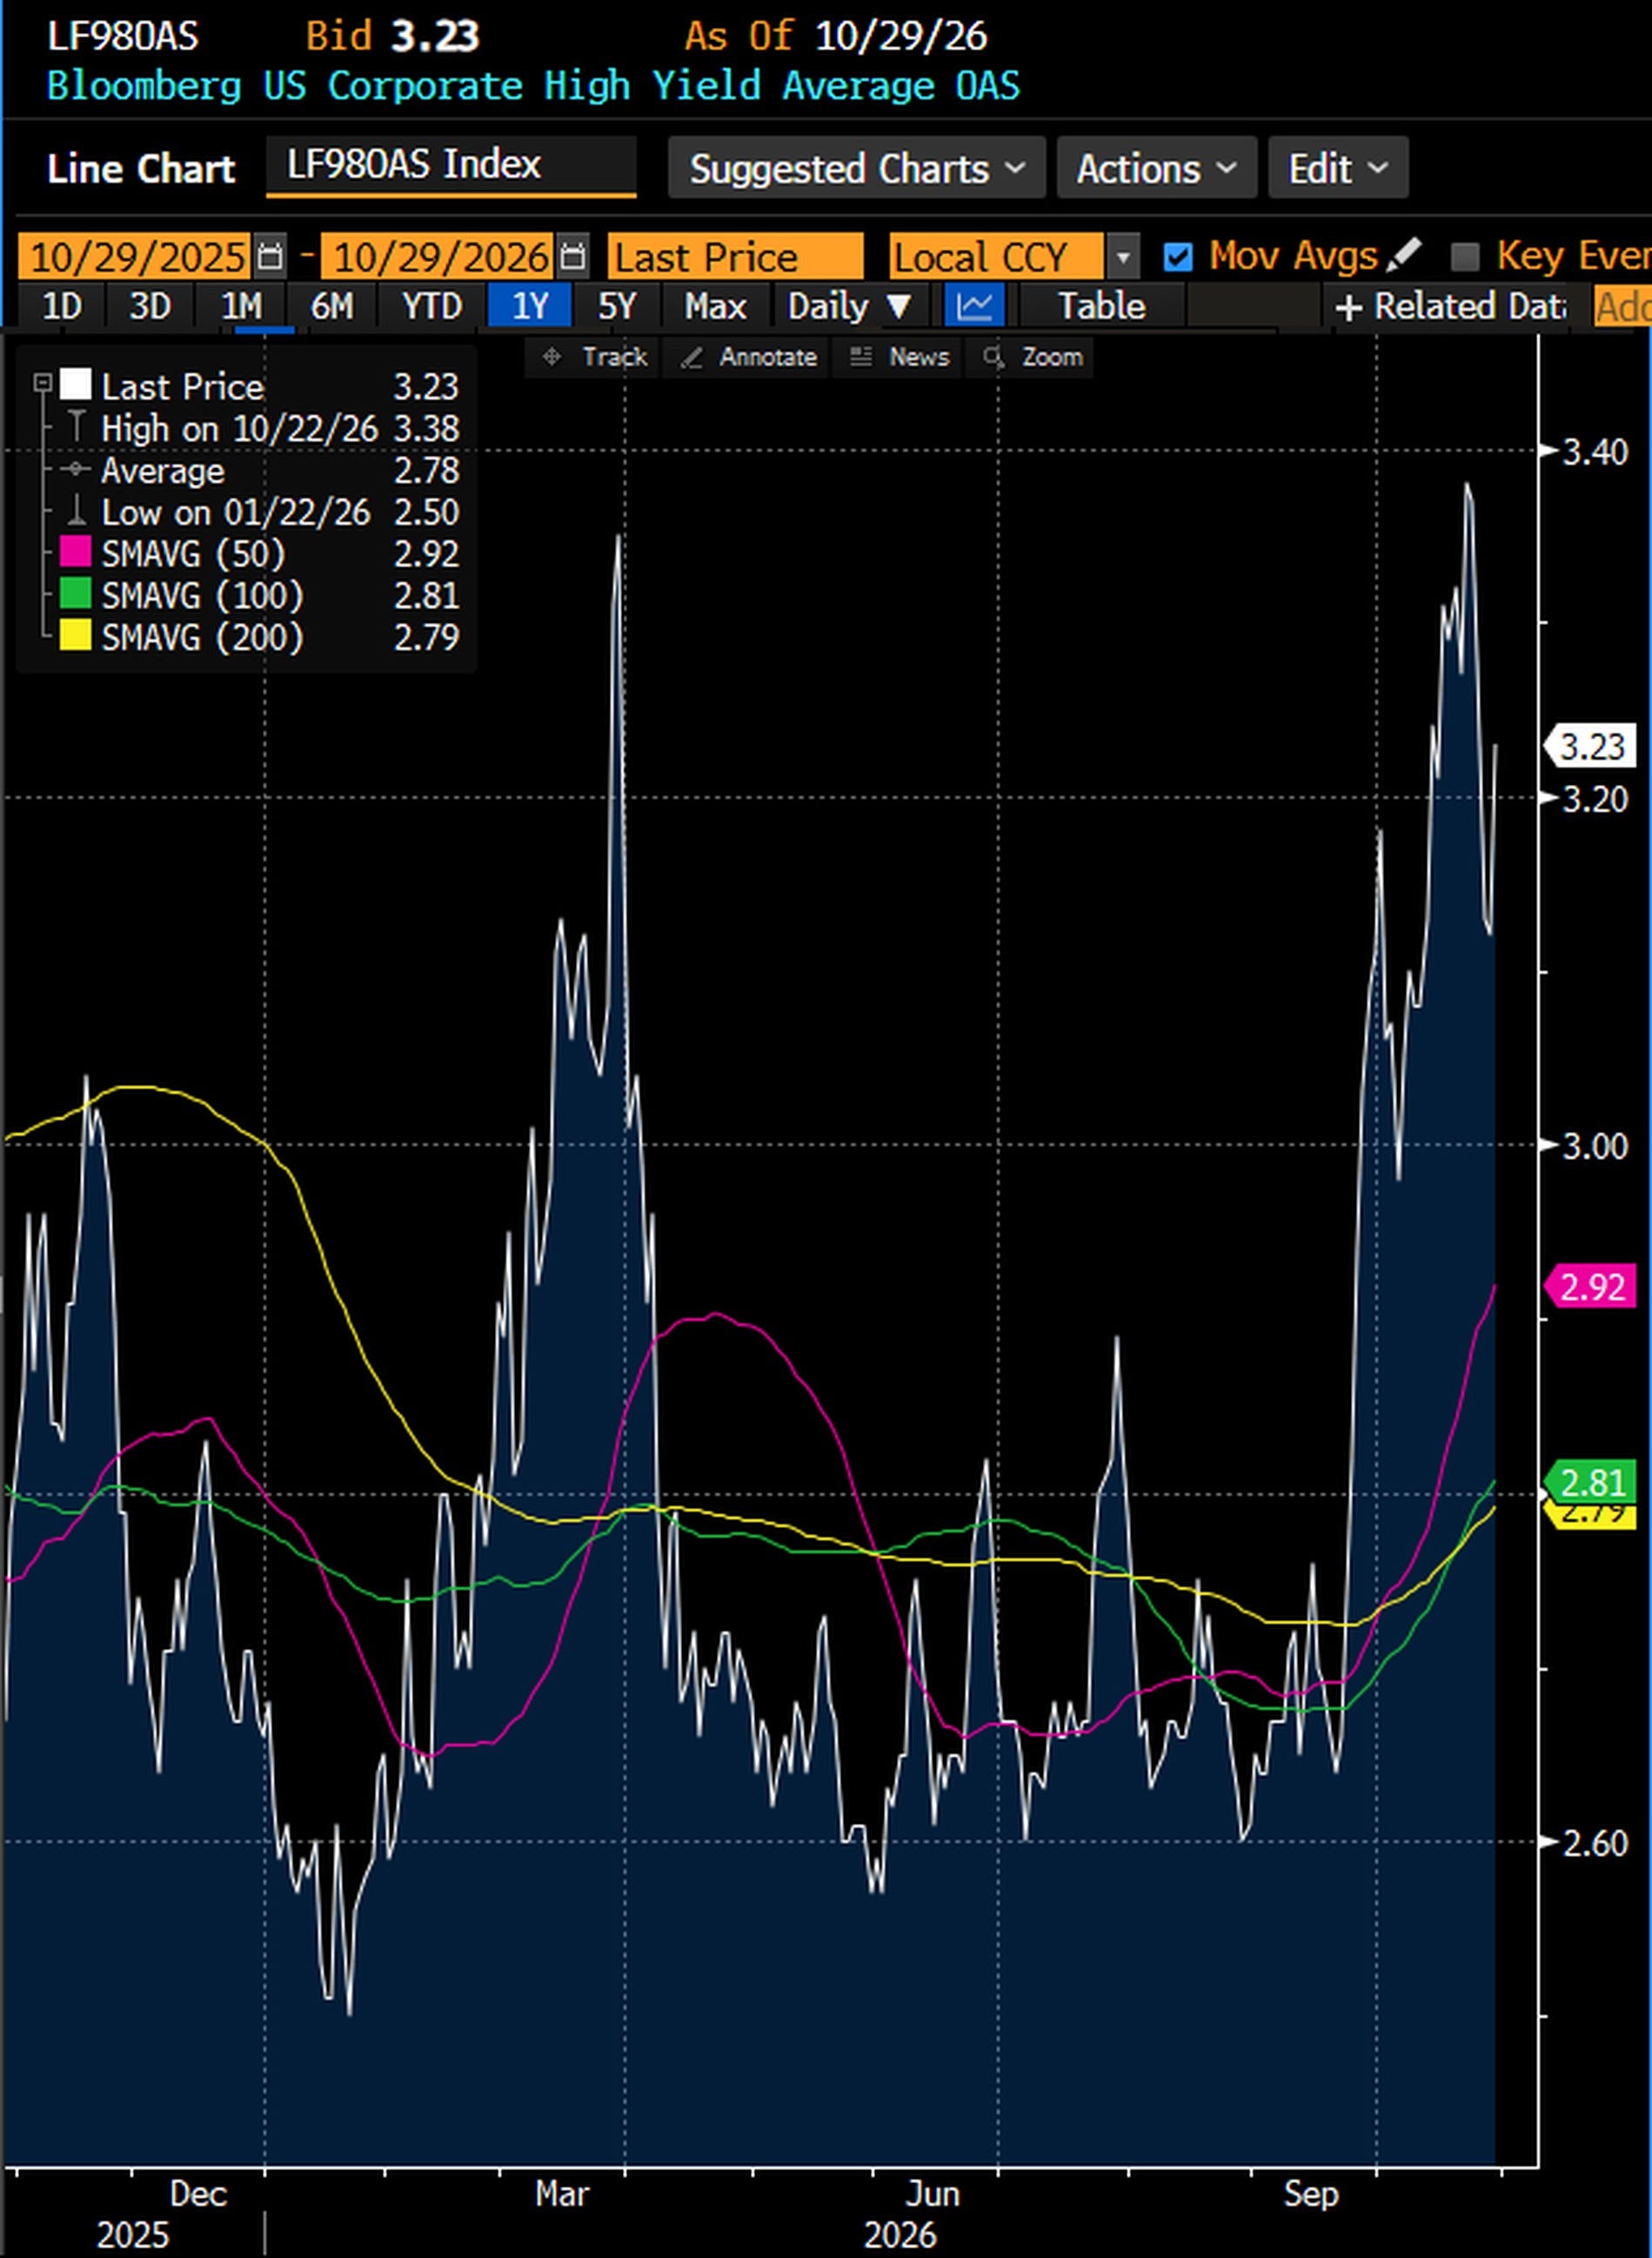
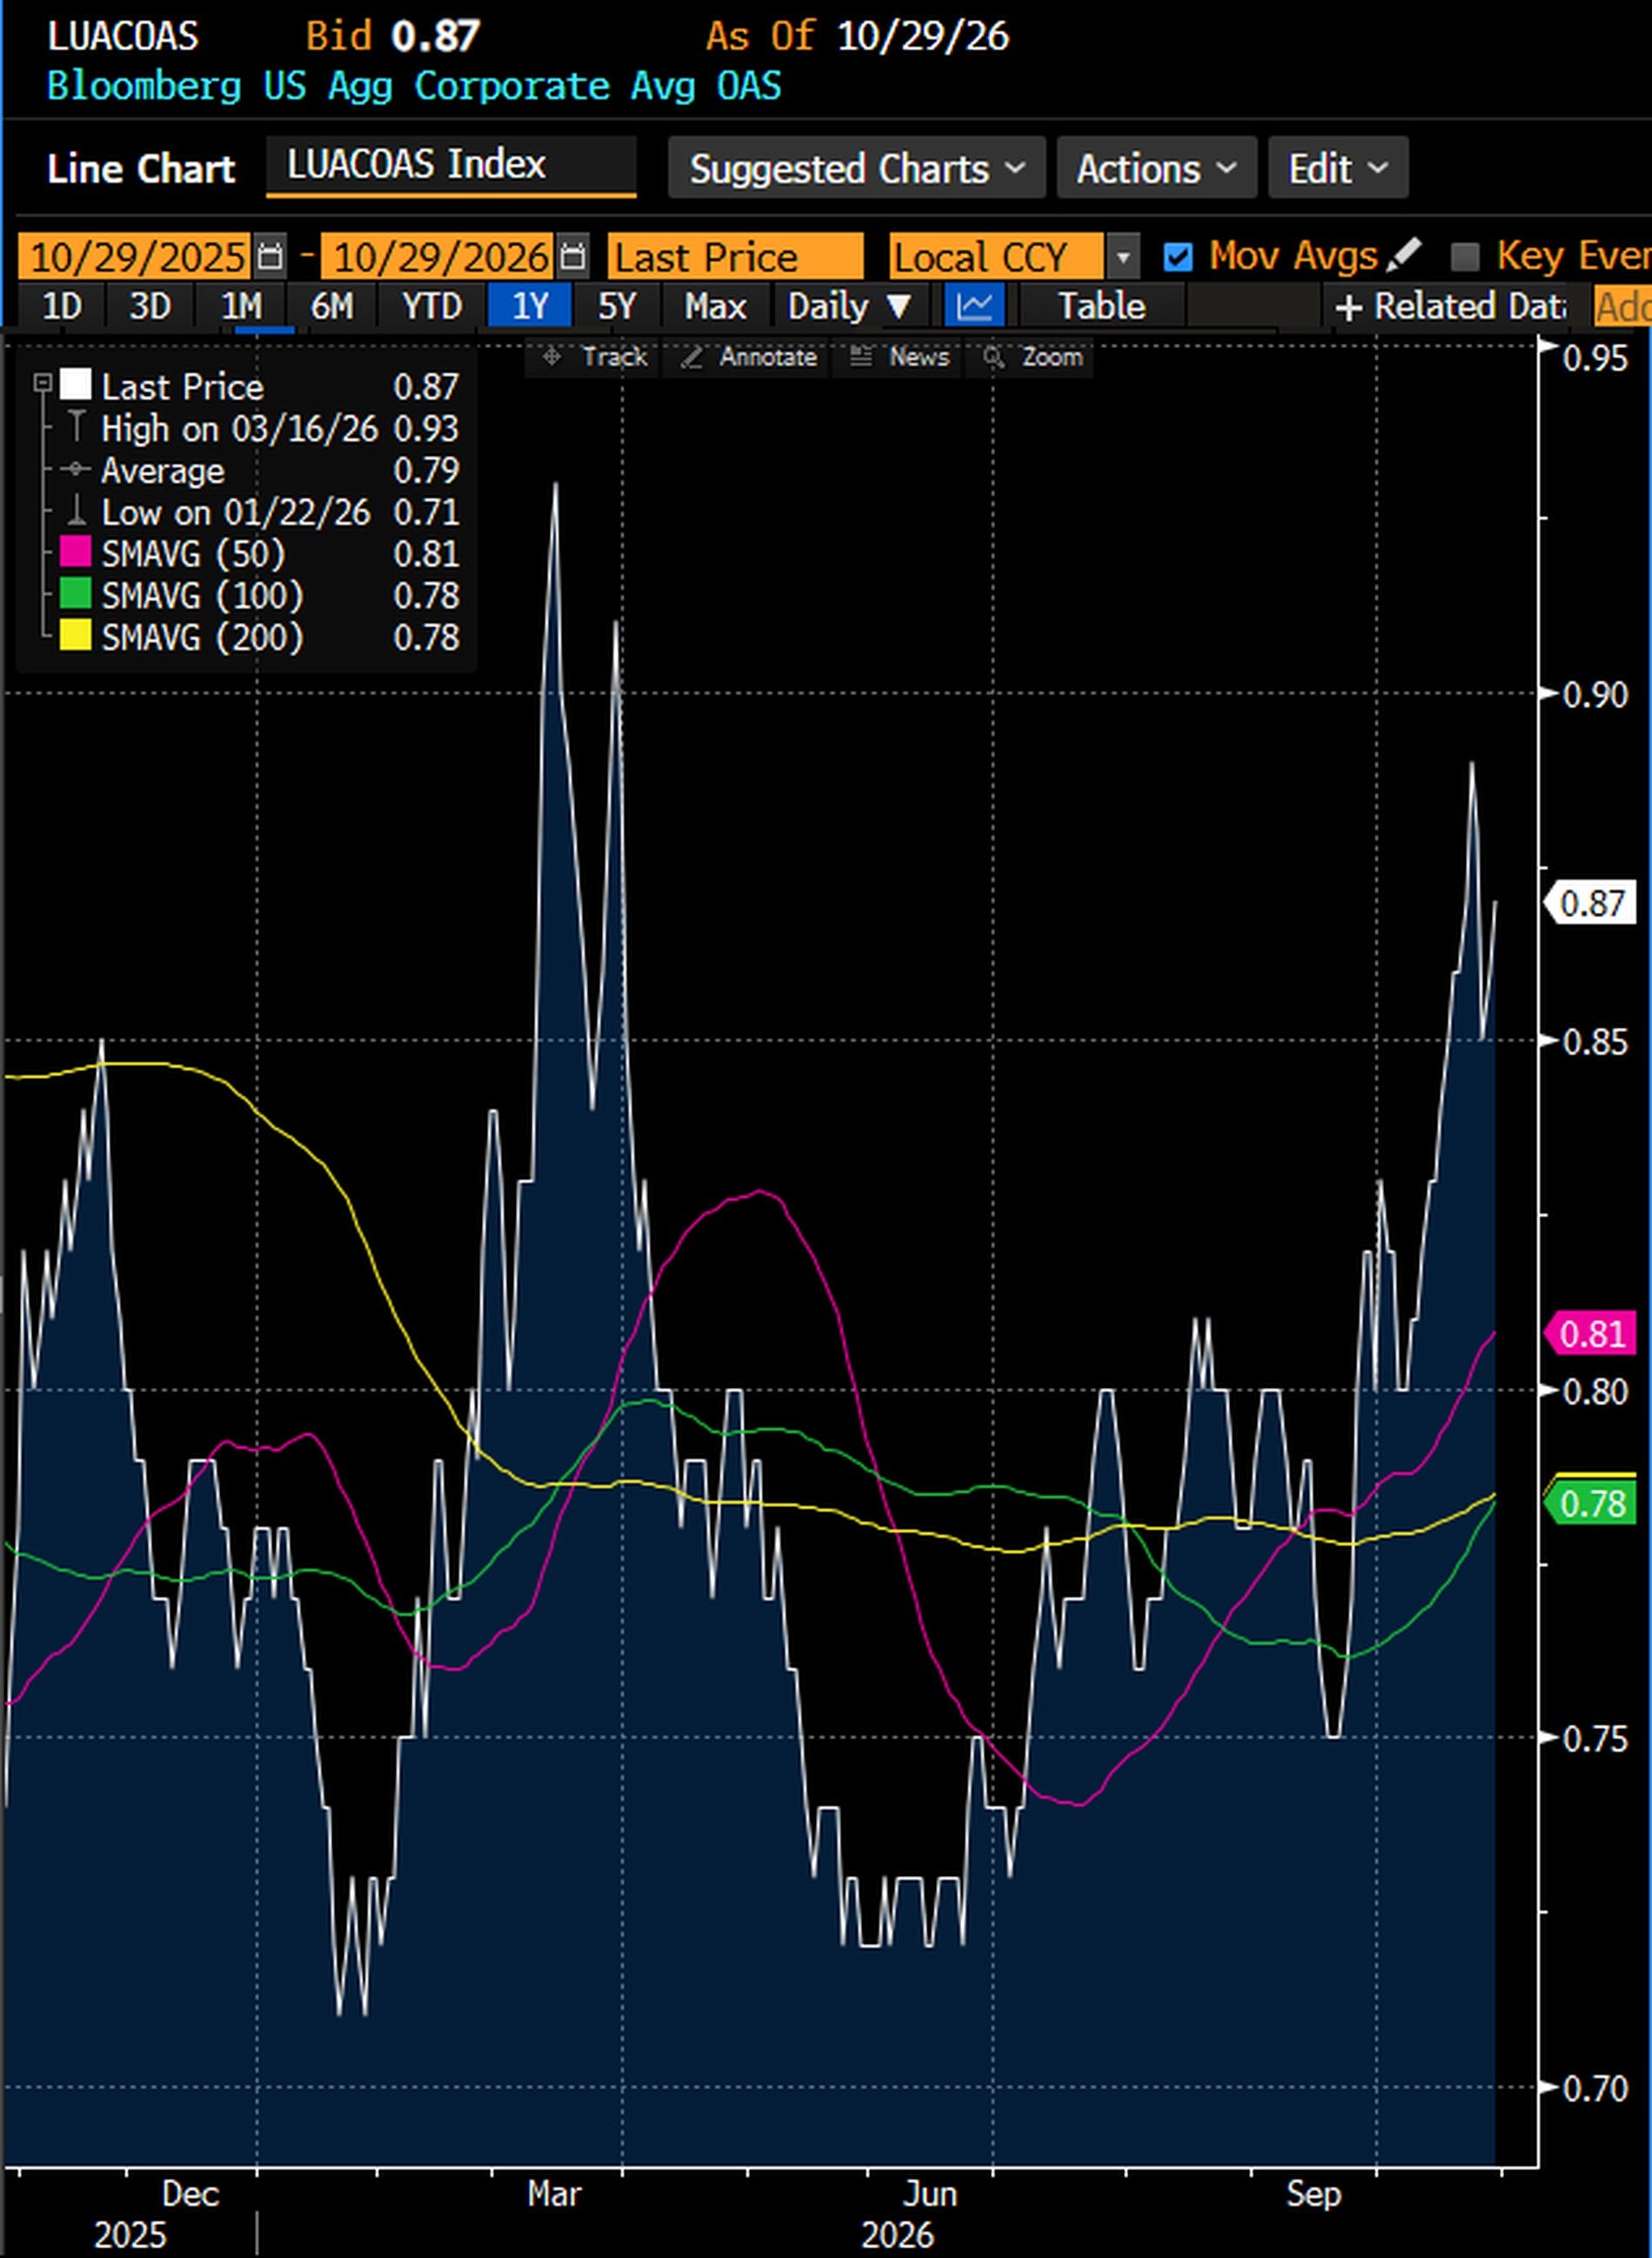
The stress sits where the leverage is.
AI borrowers. Oracle's five year CDS was 270.9 bp on Thursday, 3.4 times its level of a year ago, after its record of 329.1 bp on October 20. CoreWeave's was 1,016.7 bp, after 1,162.5 bp on October 22. Both are in the top 5% of their year. In a month the spread of Oracle's 4.95% bond of 2031 over Treasuries widened 61 bp to 232.9 bp, and that of CoreWeave's 9% bond of 2031 widened 237 bp to 971.3 bp.
Private credit. Blue Owl's two listed lending funds, OBDC and OTF, are business development companies, or BDCs, which lend to mid sized private firms. Both made one year closing lows on October 21, when OTF stood 34.5% below its January 5 high. They have bounced 6% to 9% since. Blue Owl itself is 37.6% below its 52 week high. In the unlisted funds, the exit door is narrow. In the second quarter, holders of Blue Owl's non traded technology lending fund (OTIC) asked to redeem 38.1% of their shares and received about 13% of what they asked (AltsWire). The third quarter tender, whose final results came on October 26, looked the same according to the Crowdfunded Wealth tracker, which compiles fund filings: 39% requested, 12.8% filled. These funds pay out pro rata at a 5% quarterly cap. It is not a suspension, but most of the money that wants out stays in.
Credit indices. On Thursday afternoon, the CDX investment grade index of North American credit default swaps traded at 60.1 bp, and Europe's high yield index, the iTraxx Crossover, at 312.3 bp.
What has not cracked: regional banks gained 4.3% in a month (KRE), and the broad high yield market is below the 350 bp I named on October 13 as the next marker. Credit stress is real on a one year view and concentrated in AI and private credit. It has not spread. The index, again, is the last to know.
The Bank of Japan sees it too. Its outlook report, published on Friday, lists "the profitability and financing of AI-related investment" and "developments in the foreign non-bank financial intermediary (NBFI) sector" among the financial risks it watches.
Why it matters for Act 4: lenders read cash flows, not stories. Alphabet reported about $9 billion of negative free cash flow and plans a "significant" increase in investment for 2027. When the largest AI spenders burn cash to build, the cost of the debt that finances the rest of the chain rises first.
Then the rating agencies. After the close on Friday, at 5:05 pm New York time, Bloomberg flashed that S&P had revised Meta's outlook to negative. The rating stays AA-, the fourth highest grade, and Moody's still rates Meta Aa3 with a stable outlook. An outlook change is not a downgrade. It is the agency's warning that one may come within six months to two years. But it shows how far Act 4 has travelled: what AI spending costs in cash is now a question for the credit rating of one of the strongest balance sheets in the world, not only for Oracle and CoreWeave.
And a sovereign. Seven minutes later, at 5:12 pm, Bloomberg flashed that Fitch had revised France's outlook to negative. Fitch keeps France at A+, the grade S&P also gives it, while Moody's has rated it Aa3 with a negative outlook since October 2025. I wrote on October 25 that France now pays more than Italy and Greece to borrow for ten years. On the same Friday evening, the agencies moved on the two places where debt pays for what income does not cover: AI spending and European budgets.
Japan: the Bank of Japan turns, and the carry trade listens
The Bank of Japan kept its policy rate at 1.25% on Friday, by 8 votes to 1. Board member Hajime Takata proposed a hike to 1.5%, arguing that with underlying inflation at the target the Bank must "step up the pace" toward the neutral rate. The majority judged underlying inflation "generally consistent with the price stability target of 2 percent" and wrote that "the Bank will continue to raise the policy interest rate." It also decided, unanimously, to sell its ETF holdings faster from January, about 860 billion yen a year instead of 330 billion. Governor Ueda named no month. The market did it for him: overnight index swaps price an 80.9% probability of a hike at the December 18 meeting, against about 57% before the decision according to investingLive, which may not use the same measure.
The yen firmed only a little. The dollar closed the week at 157.56 yen, against 157.71 at Thursday's close, after a low of 156.96 on Friday morning. The Nikkei 225 closed 2.12% lower, with Korea's Kospi down 3.48% and Taiwan down 2.49%: the AI sell off after Amazon's results came on top of the Bank of Japan.
The signal is in the bond market. The 10 year Japanese government bond (JGB) yield fell 6.4 bp to 2.782%, and the 30 year 6.7 bp to 3.850%. A hawkish turn usually lifts short yields more than long ones, and long yields can even fall if the market thinks the Bank will get ahead of inflation. Part of the move is that, part is the global haven bid, and part is money moving toward JGBs. On Bloomberg's generic yields, since its high of 3.125% on October 1, the 10 year JGB yield has fallen 34 bp, and the 30 year 40 bp since its high of 4.249% on October 6.
The Ministry of Finance's weekly flows show where it stands. Japanese investors were net sellers of foreign bonds for six weeks in a row through October 24, about 3.5 trillion yen in total, although the pace slowed each week, and Reuters reported in mid October that the selling came mostly from outside the life insurers. The buyers of JGBs have mostly been foreign: about 3.2 trillion yen in the four weeks to October 24. So money is leaving foreign bonds and money is moving into JGBs, but the large domestic holders, the life insurers, have not come home yet. A Bank of Japan that hikes in December is what could bring them.
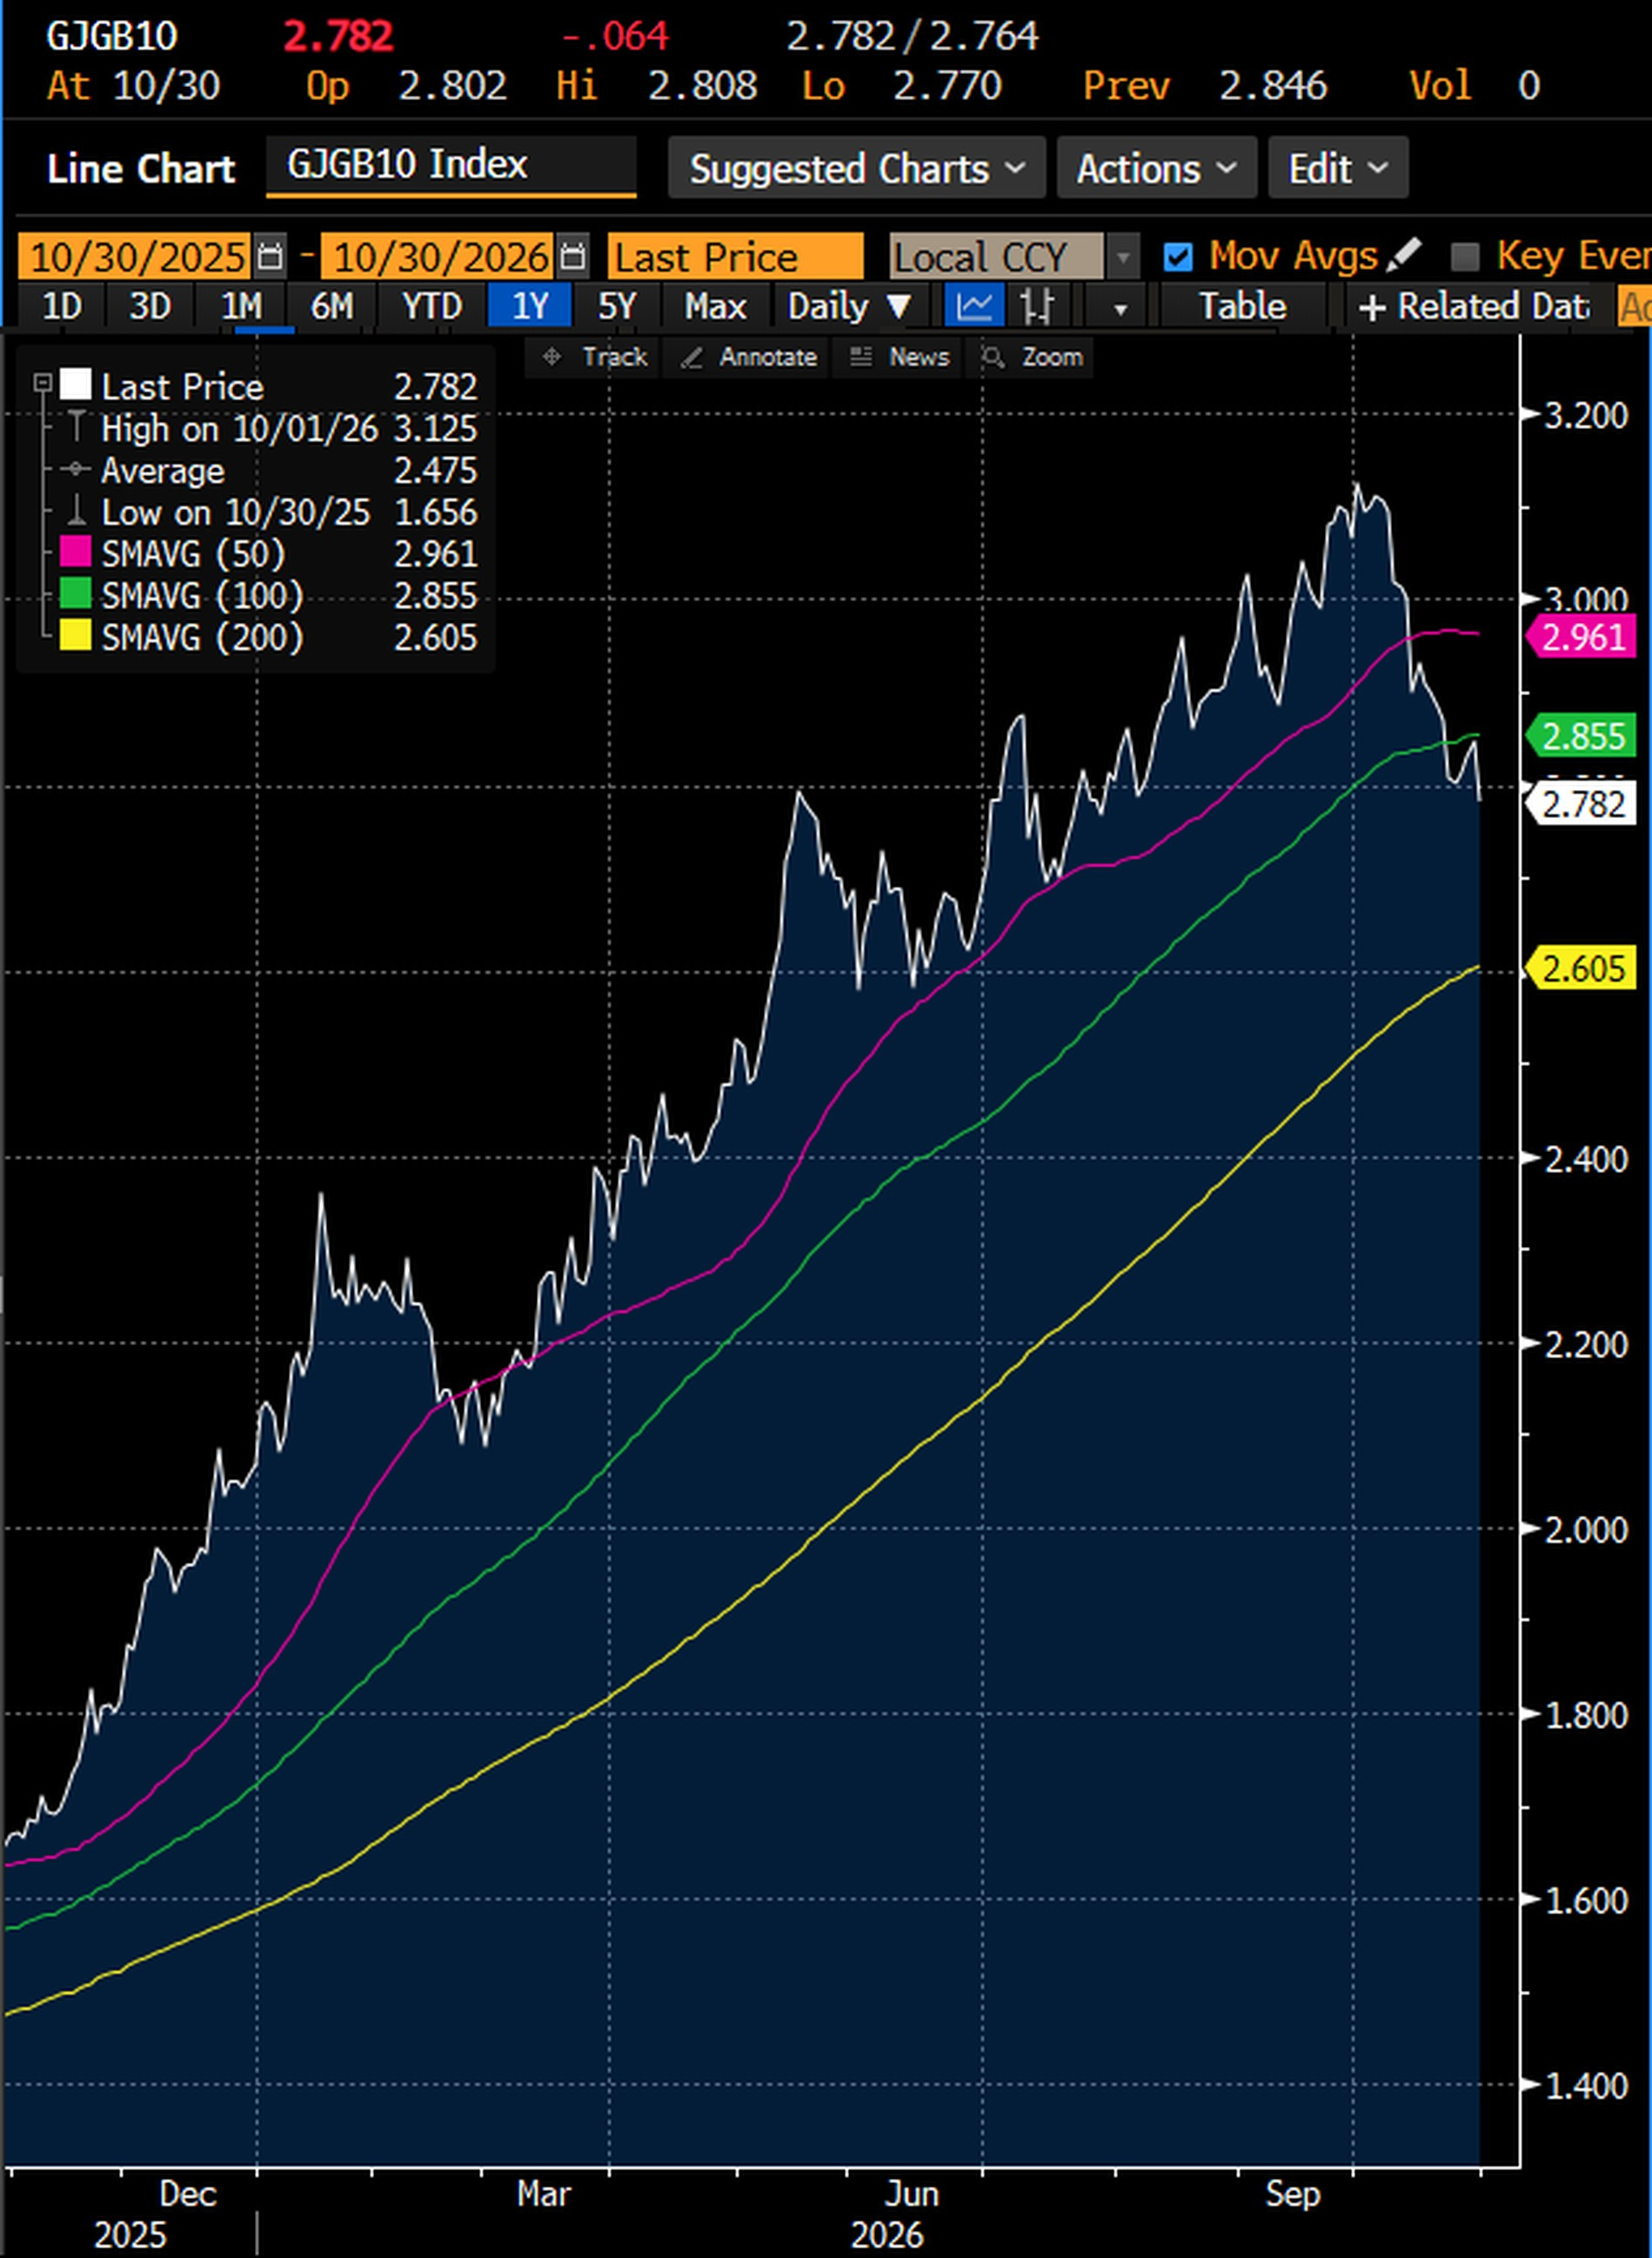
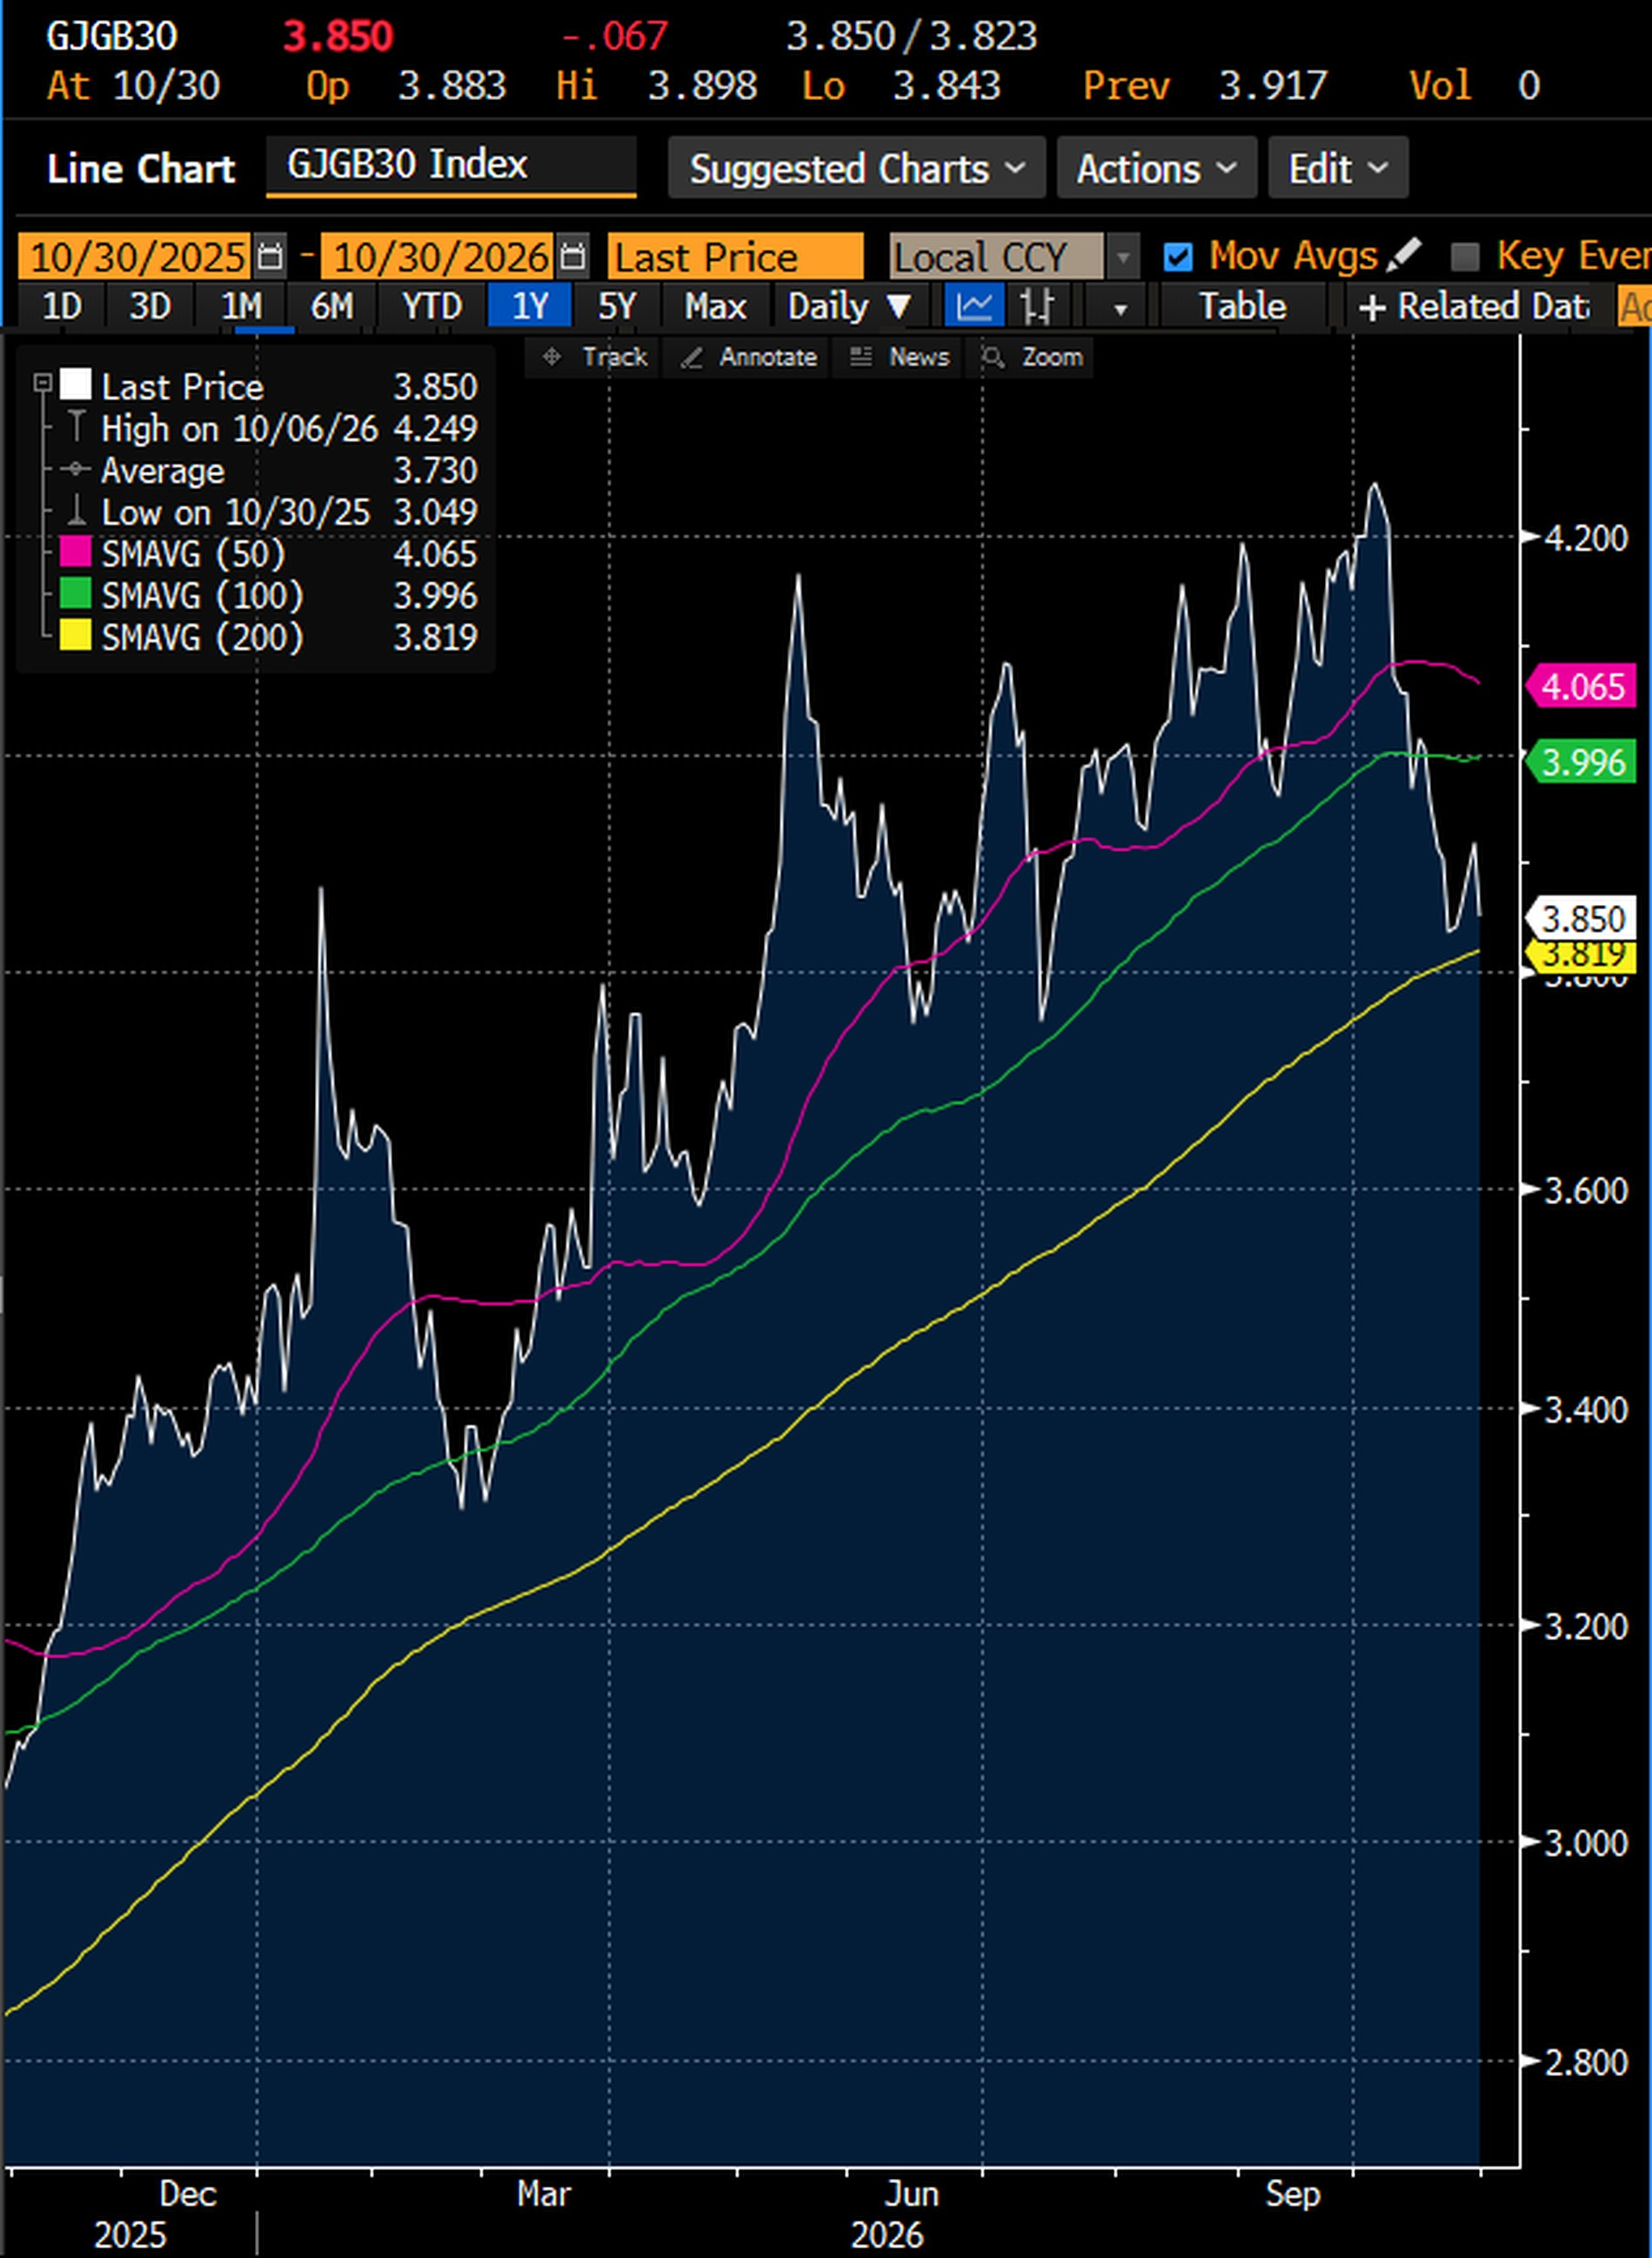
Why money would come home. On September 25, in The Crash Fuse Is Lit, I wrote that "On a hedged basis, the Japanese institutional bid for US duration is effectively closed at current levels." A Japanese insurer that buys a 30 year Treasury and hedges the dollar pays the gap between US and Japanese short rates plus a cross currency basis, 2.93 points a year on September 25. In late September that left the hedged 30 year Treasury at 2.57% against 4.15% for the 30 year JGB. Both legs have moved since, but the arithmetic has not: at 5.31% for the Treasury and 3.85% for the JGB, a hedge cost close to 3 points still leaves the JGB about 1.5 points ahead, on my estimate. The insurers who do not hedge carry the currency risk instead, and a hawkish Bank of Japan is that risk. Japanese and Taiwanese insurers hedged only 41% of their foreign currency exposure at the end of June, the lowest since at least 2015.
The carry trade works the same way at a faster speed. Borrowing yen at about 1.25% to hold dollar assets at about 3.88% earns some 2.6 points a year. A 2.6% rise of the yen wipes out a year of it. The speculative part is small: leveraged funds were short only about $1.8 billion of yen futures on October 20, and on our model the trend followers have been cutting their yen short this week. The large carry is structural, in the unhedged foreign assets of Japanese investors and in everyone who funds in yen. Japan's holdings of Treasuries fell by $135 billion in the five months to July, the latest data I checked, to $1,104 billion.
The precedent is August 2024. Helped by Japanese intervention in mid July, the dollar had already fallen from almost 162 yen to about 153 when the Bank of Japan hiked on July 31. A weak US jobs report followed on August 2, and on August 5 the dollar touched 141.7 yen, the day the Nikkei lost 12.4%. That last leg, 11 yen in four sessions, was the mix of a Bank of Japan that tightens and a US economy that slows. That is the mix the market is starting to price again.
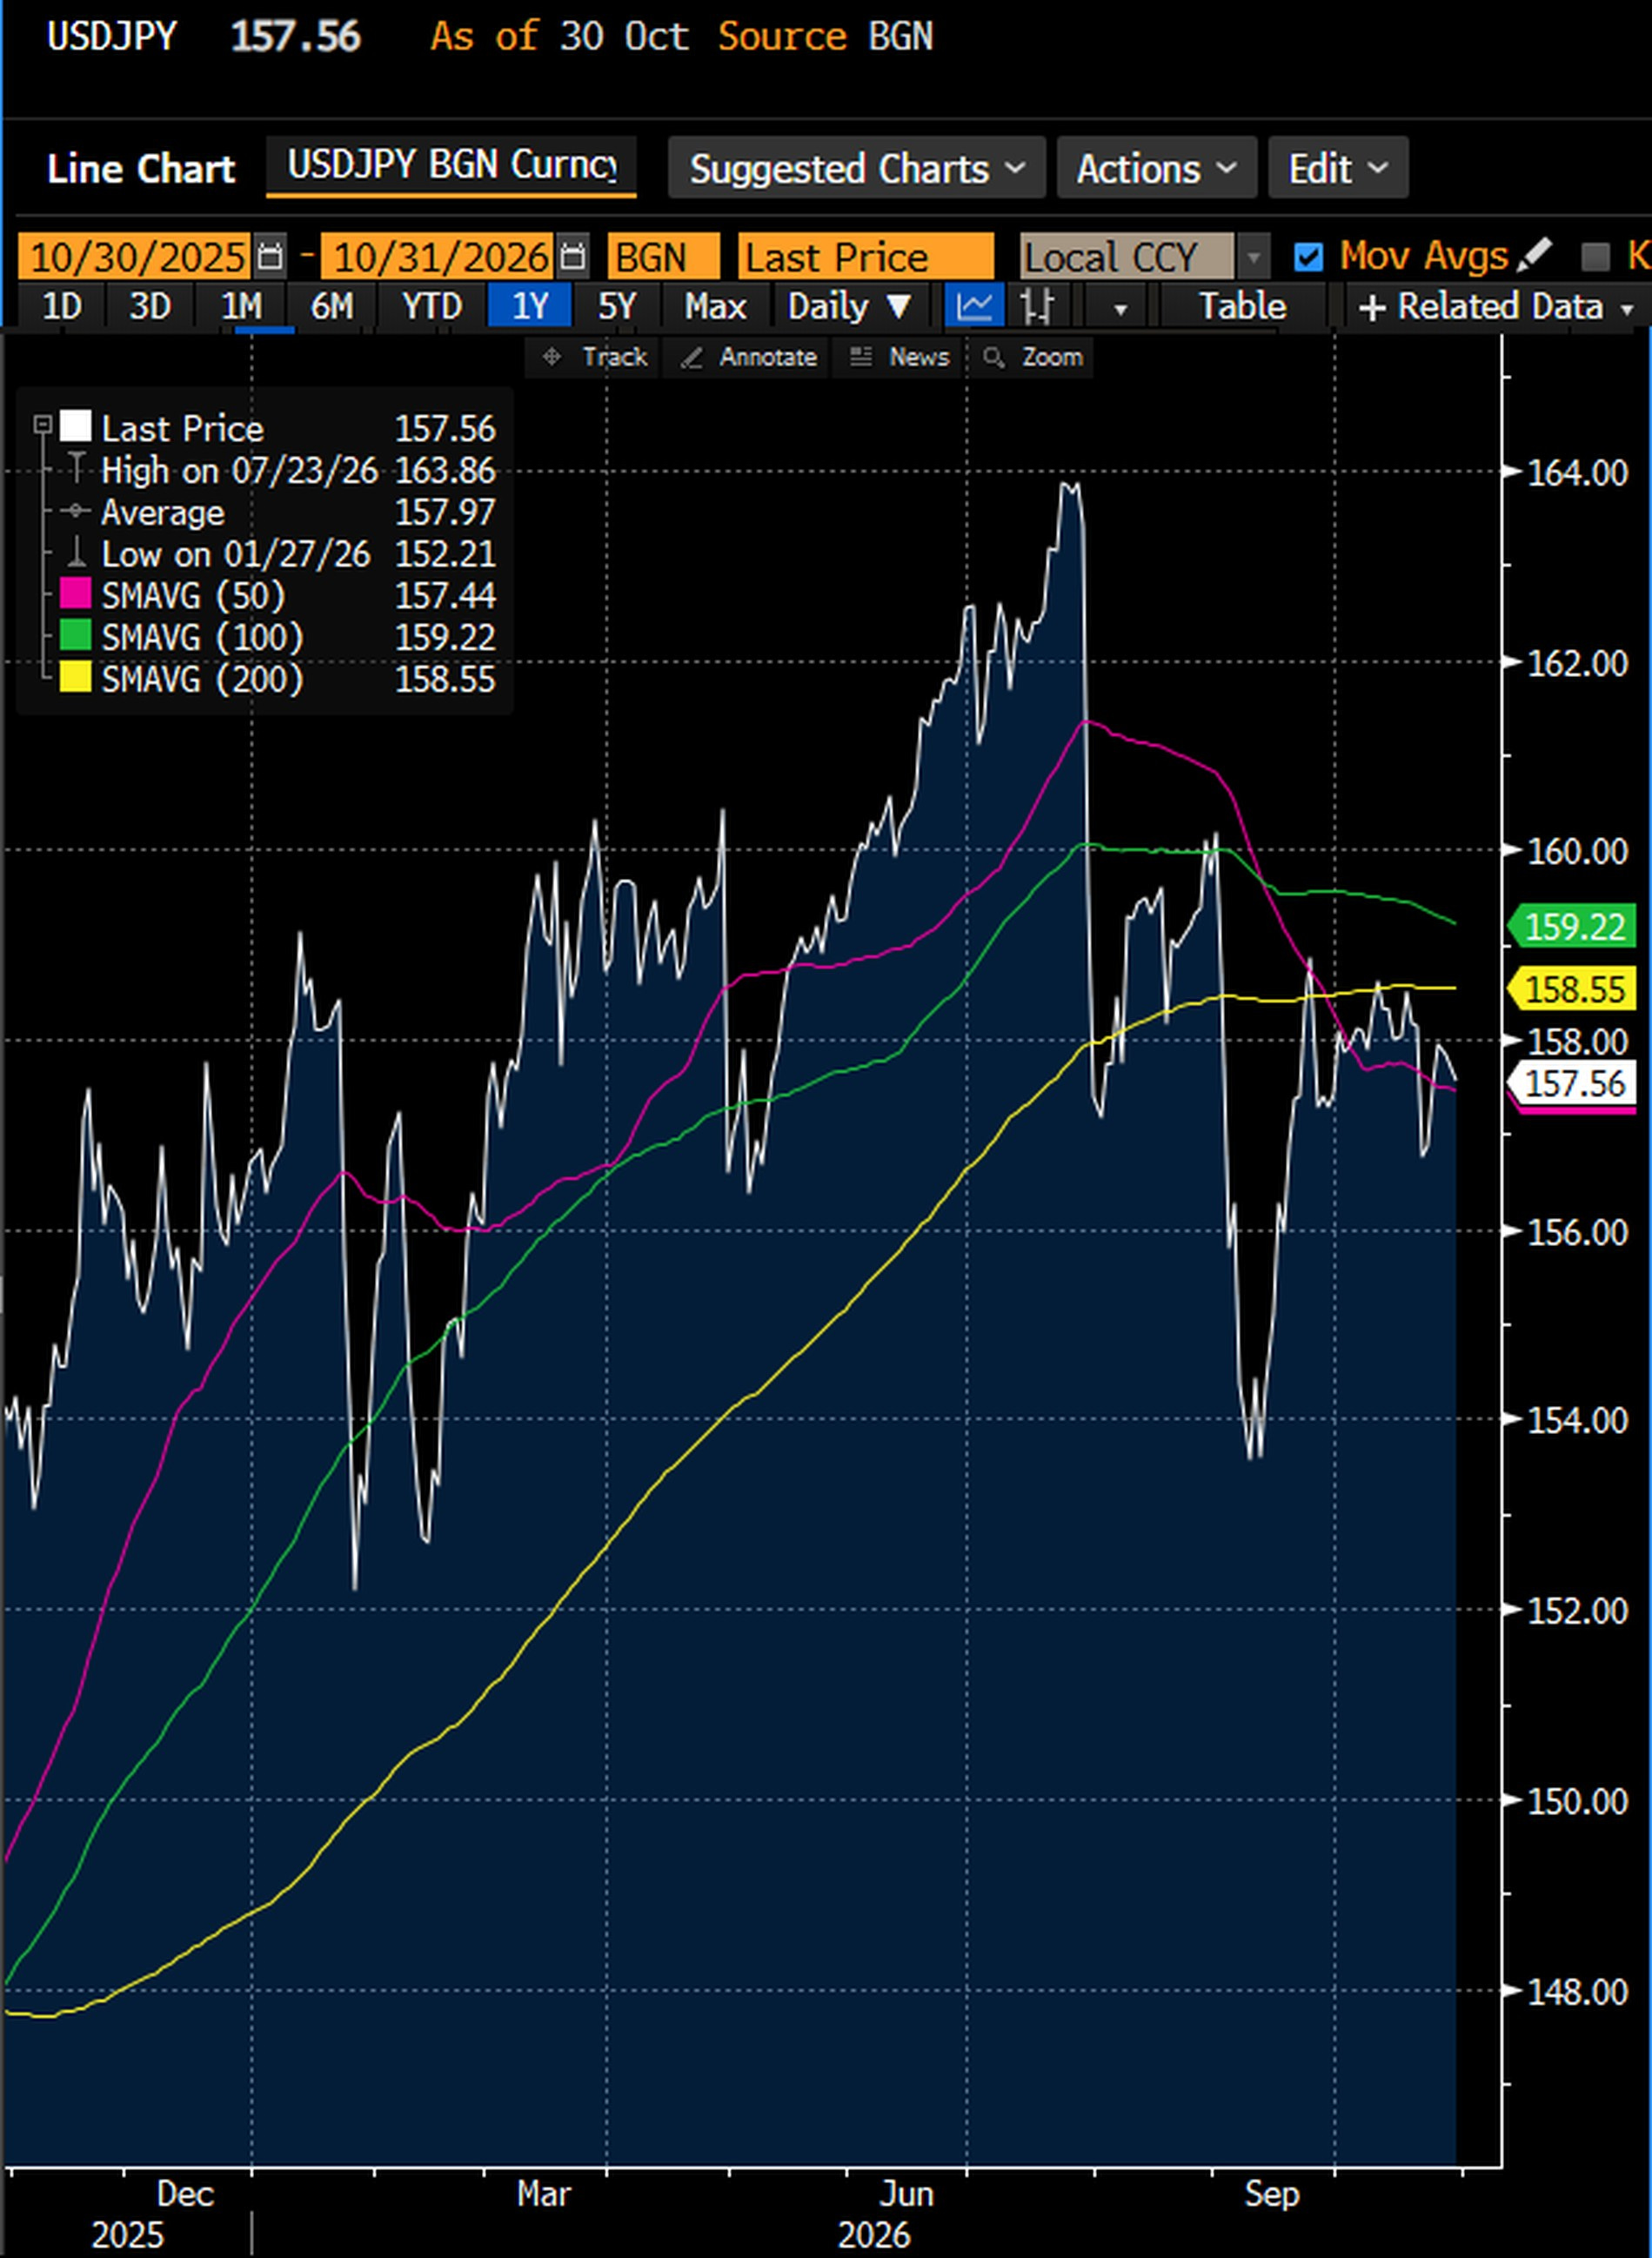
The weekly flows that cover the Bank of Japan meeting come out next week. They will tell whether Friday's decision moved Japanese money.
The midterms, and who gets the blame
On Tuesday Americans elect the whole House and about a third of the Senate. Bloomberg carries the Kalshi prediction markets. On Friday morning they gave the Democrats a 92% chance of winning the House and 69% for the Senate, up 6 points in five days, and 93% and 71% by Friday evening. A Democratic sweep of both chambers was the favourite at 68% on Friday morning, up 6 points in a month, and a Republican sweep stood at 7%. On Polymarket the Senate contract went from 28% on November 3, 2025 to 70.5% on Friday evening, and the House contract stood at 93.5%. Kalshi already gives the 2028 presidential election to the Democratic party at 61%.
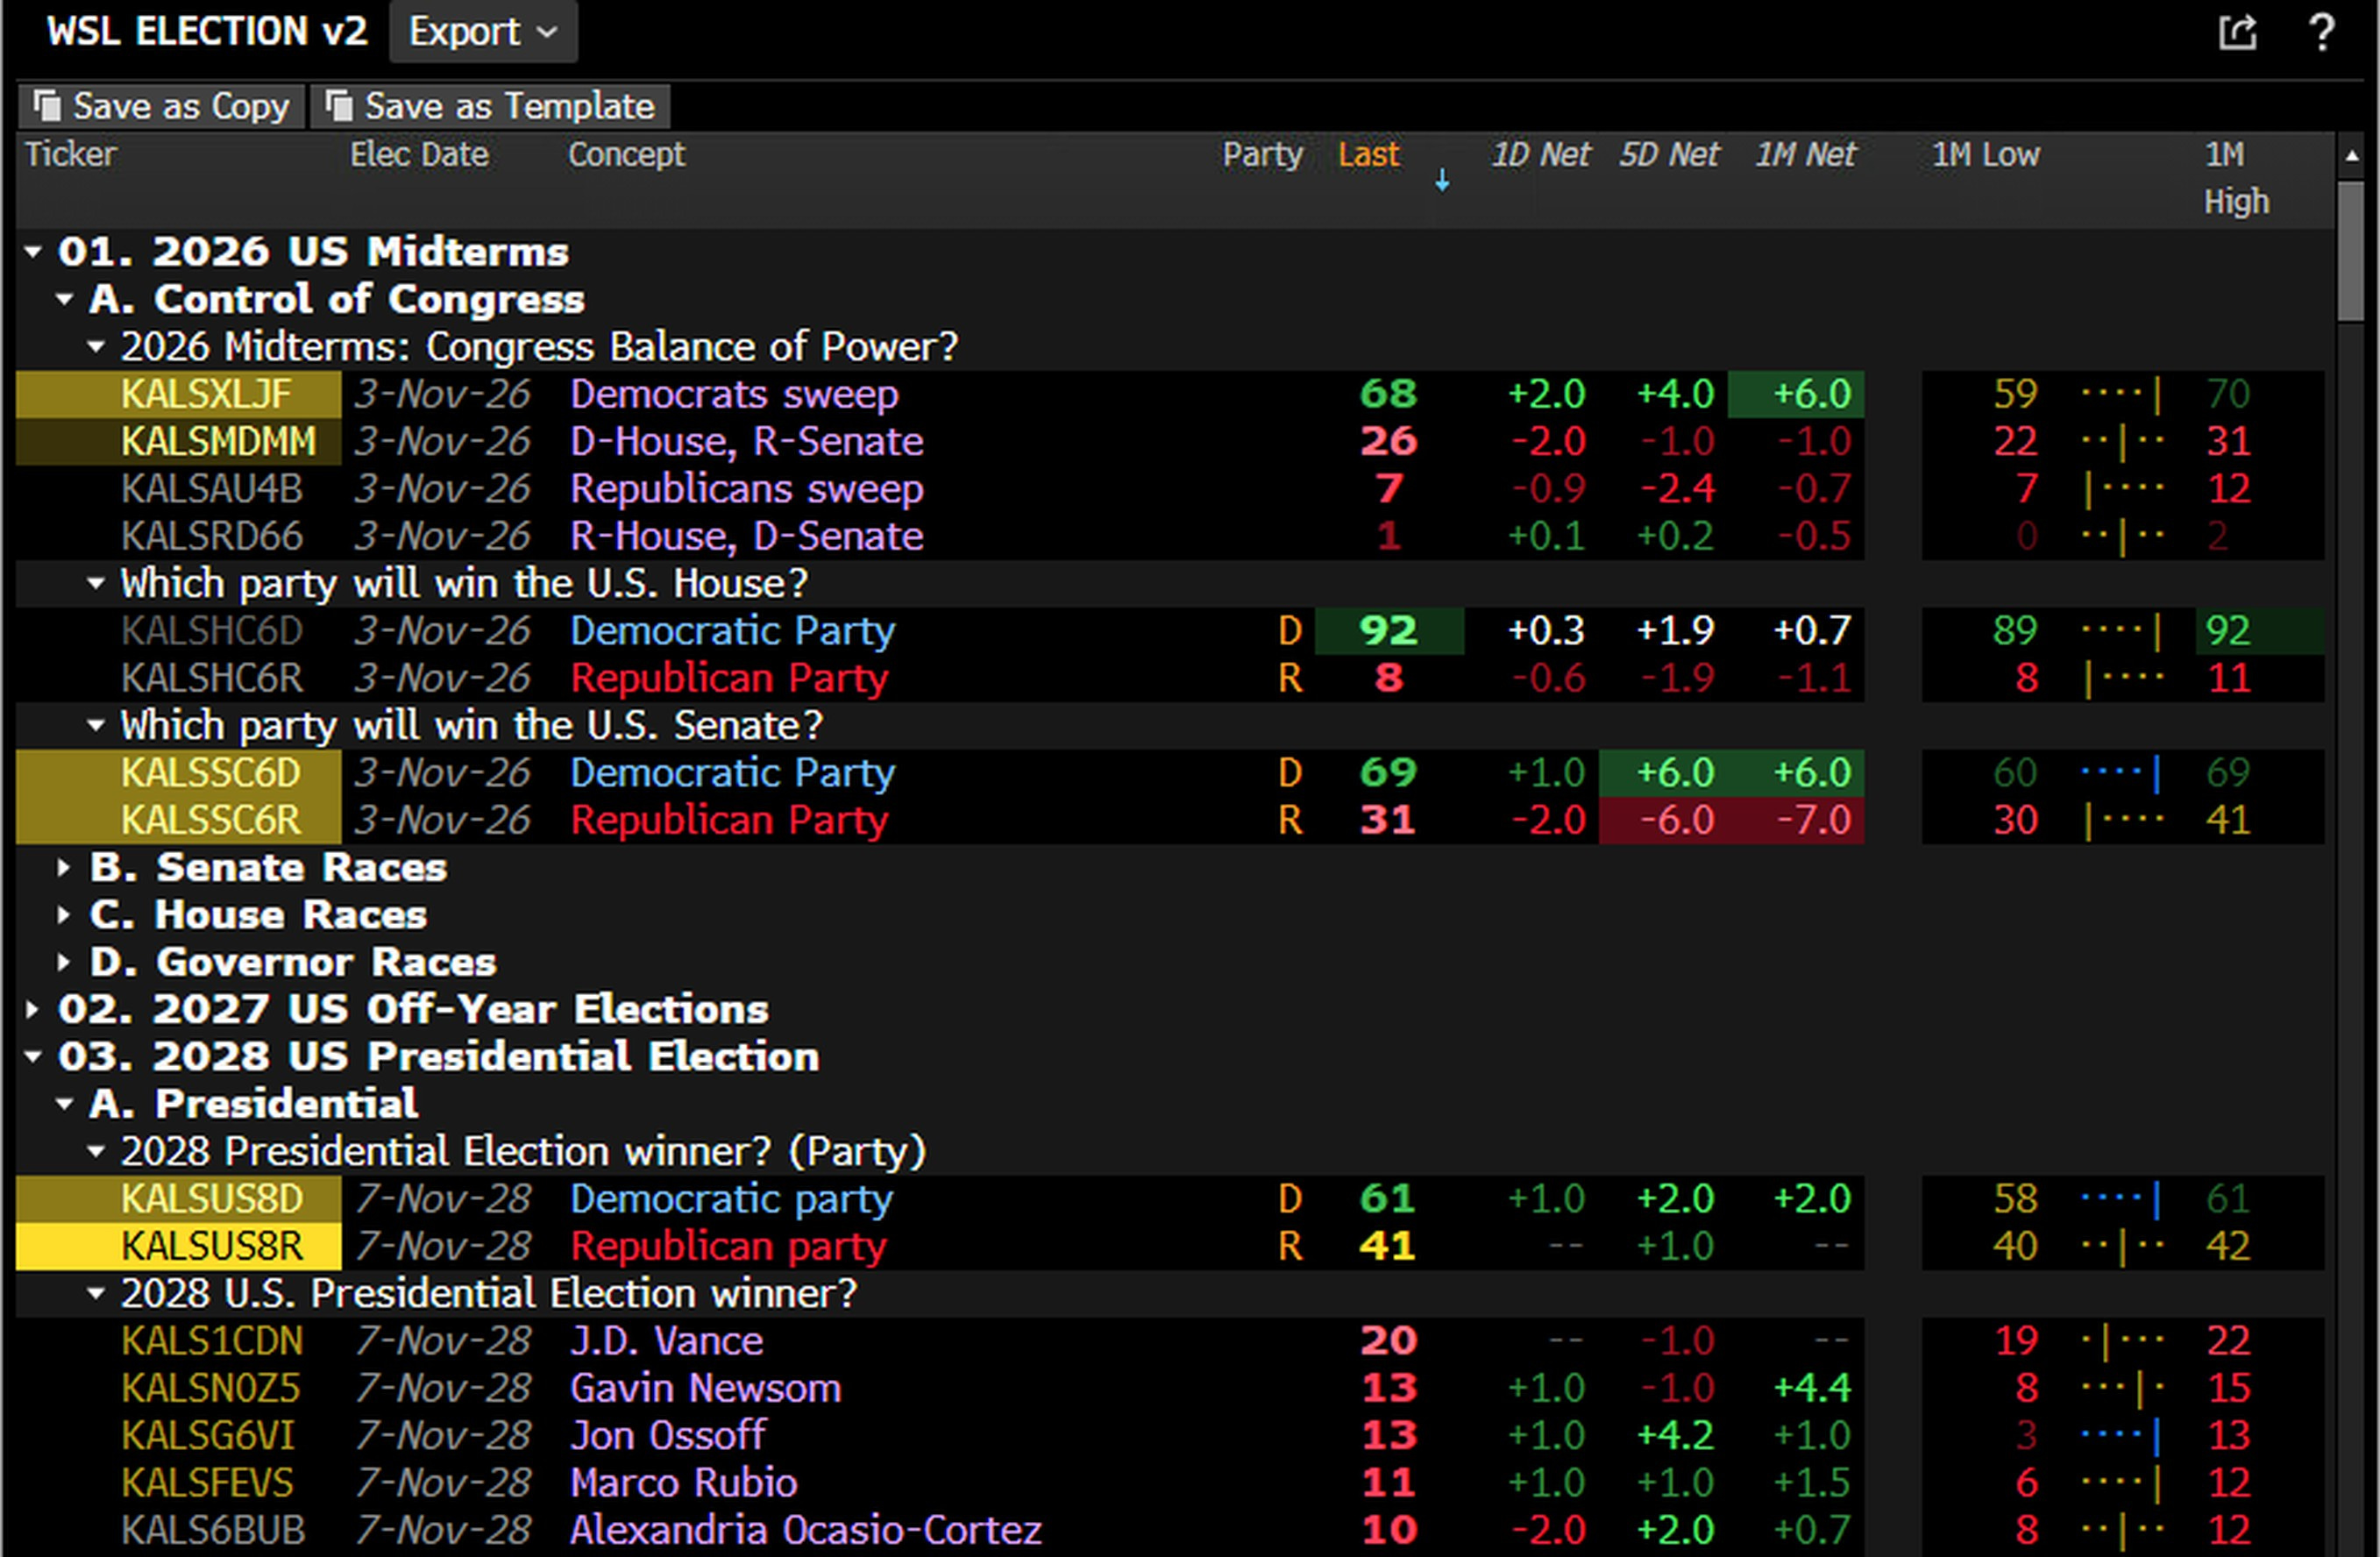
My scenario. If the President loses Congress, which these markets now call likely, I expect him to blame the Democrats for the slowdown. The new Congress takes office on January 3, and from then on every weak number of 2027 will have a political owner. The blame itself is not a market price. Its consequences are, through three channels.
Fiscal. A divided Washington does not pass stimulus easily. If the slowdown arrives in 2027, it may find no fiscal cushion, and the burden falls on the Fed.
The Fed. The President has pushed for lower rates all year, and Chair Warsh is his own pick. The blame has already started there. At Wednesday's press conference a reporter read the Chair a remark the President made on October 7: "Kevin is great, but Kevin's one vote out of a Board with numerous people that were put on by Obama and Biden, and a couple by me. So you have a Board that would like to see the country do badly, in my opinion." Lisa Cook, the governor who voted for a hike that day with Cleveland Fed President Beth Hammack, faces a White House hearing on her future next week. A president who needs growth before 2028, and has someone to blame for its absence, will push harder. If the Fed eases with inflation at 3.6%, the inflation market reprices: that is the breakeven I watch.
Oil. On October 6, in Will Trump Strike Iran After the Midterms?, I wrote: "I do not think Trump resumes large scale strikes on Iran before November 3. I think he does after the vote, whether Republicans hold Congress or lose it." An escalation after the vote would be a second oil shock on top of Brent above $110.
Add the levers that need no Congress, tariffs first, and the three channels add up to the same mix: weaker growth and higher prices. Polymarket gives a recession before the end of 2026 only 6.5%, with two months to go. The vote will not change 2026. It will shape 2027.
2027: the stagflation case
Andy Constan's play ends on "Recession Island": equities sell off, companies fire workers, and the recession finally kills inflation. My worry for 2027 is another ending, the firing without the disinflation.
The growth side. The US economy grew at a 3.4% annual pace in the third quarter, after 2.2% in the second, on investment and household spending, and Chair Warsh put business investment at "about a double-digit pace." Hiring is another story. Payrolls rose only 29,000 in September, against 90,000 expected, July was revised to a loss of 10,000, and the unemployment rate rose to 4.2%. On Friday the Chicago PMI fell to 55.3 in October from 58.8, below the 56.0 expected. The engine that carries growth is investment, much of it in AI, and that is the one under pressure. In the month to October 29, Goldman's AI beneficiaries versus at risk pair lost 17.1%, Morgan Stanley's AI beneficiaries basket 11.3% and Goldman's AI data centers basket 9.8%. The market's question about AI has changed from how much these companies will earn to who pays for what they build. Alphabet answered on October 28 with negative free cash flow and more spending in 2027.
When companies spend more on machines and earn less, they cut people. In the Challenger report on announced job cuts, AI was the first reason given every month from March to July, and it remains the leading reason this year: 120,136 cuts through September, about a fifth of the total. Technology is the industry cutting the most, 165,925 jobs, up 54% from a year earlier. Netflix announced about 1,000 cuts on October 14, about 6% of its staff. Total announced cuts are still low, 43,281 in September, the lowest for a September since 2022, and initial jobless claims were 194,000 in the week to October 24. Hiring is what has stalled: hiring plans were the lowest for a September since 2011. Andy Challenger summed it up: "Companies are in a wait-and-see period right now." He pointed to high energy costs, an uncertain war in Iran and a rate hike that could make hiring more expensive. That is the point. Act 5 has not started. But the companies that drove 2025 and 2026 are now under pressure from their shareholders and their lenders at the same time, and they are among the largest employers in the country.
The inflation side. Oil is priced high into next year. The Fed is priced to raise rates to 4.464% by September 2027. Most large central banks are priced to hike. Prices paid by companies stand near 78 in manufacturing and 74 in services.
The mix. A slowdown that comes from AI and credit, inflation that comes from energy, and central banks that cannot cut because of the second while the first takes hold. That is stagflation. It is the case where stocks and bonds can lose together, because the bond hedge only works when inflation falls with growth. Treasuries hedge today because the market believes the slowdown will kill inflation. If it does not, the hedge fails, as it did from March to July, when Treasuries fell on 11 of the 13 equity sell offs.
What would tell me the stagflation case is taking over:
Breakevens rising while real yields fall, further than since October 5 (breakeven up 11 bp, real yield down 28 bp): the market no longer trusts the Fed.
The curve steepening from the long end while stocks fall.
Treasuries falling again on the days stocks fall.
Jobless claims rising while prices paid stay above 70.
Gold turning up while the Fed is still on hold.
Gold would tell first, in the other direction. The day the market decides the Fed will choose growth over prices, gold stops being a source of cash and becomes a hedge again.
The levels I watch
Gold. Spot closed the week at $3,874.62, below the one year low of $3,932.09 of November 4, 2025: the liquidation is confirmed. A return above $3,932 would mean the break failed. On our trend model, gold needs a sharp rebound before the trend followers' short term signal turns.
Treasuries. The 10 year, 4.93% at Friday's close, against its 50 day average of 5.00%, and the 2s10s curve, 33.7 bp at the close. A further rally in the 10 year note future would turn the trend followers' medium term signal long and add to the haven bid.
Inflation pricing. The 5 year breakeven against about 2.50%, its late October high, and 2.74%, its May high.
The Fed. The December hike probability, 72.9% at Friday's close, and the implied peak, 4.464%.
Credit. Bloomberg high yield against 338 bp, then 350. Oracle's CDS against its 329 bp record, CoreWeave's against 1,163.
Hedge fund books. Our deleveraging gauge against its October peak, and another degrossing day in our monitor next week. Either would tell me the funds are no longer choosing to cut but are being made to.
The basis trade. The next CFTC report, due on November 6, SOFR against the rate on reserves at month end and into year end, the November 4 refunding, and the 30 year swap spread against its six month range of minus 79.9 to minus 59.2 bp.
Japan. USD/JPY at 155, then 150, the path of my first scenario of September 25. The 30 year JGB against 3.85% and its October high of 4.249%. The December 18 meeting, priced at 80.9%. The Ministry of Finance's weekly flows, next week.
Politics. Tuesday's result, the Senate at 71% on Kalshi on Friday evening, any escalation with Iran after the vote, and Brent against $118.35, its highest close of the year on March 31, which the expiring December contract nearly matched on Friday when it settled at $117.64.
Data. ISM manufacturing and prices paid on November 2, job openings (JOLTS) on November 3, ADP payrolls (67,000 expected, after 90,000) and ISM services on November 4, Challenger job cuts and jobless claims on November 5.
Earnings. Apple on November 2 after the close, Nvidia on November 18.
Key terms, in plain English
Stagflation. Growth that stalls while inflation stays high. Central banks cannot fight both, because cutting rates feeds inflation and raising them deepens the slowdown.
Basis point (bp). One hundredth of a percentage point. 100 bp make 1 percentage point.
Real yield and TIPS. The yield of a bond after inflation, read on Treasury Inflation Protected Securities, whose principal rises with consumer prices.
Breakeven inflation. The gap between a regular Treasury yield and a TIPS yield of the same maturity: the average inflation the bond market prices over that period.
Term premium. The extra yield investors ask to hold a long bond instead of rolling short term bills over the same period.
Bull flattener. A bond rally in which long yields fall more than short ones. A bear steepener is the opposite: long yields rising more than short ones in a sell off.
SOFR and IORB. SOFR is the overnight rate on loans backed by Treasuries, the repo market. IORB is the rate the Fed pays banks on their reserves. SOFR above IORB signals that cash is getting scarce in repo.
Basis trade. Buying Treasury bonds with borrowed money and selling the matching futures, to collect the small gap between the two.
DV01. The dollar change in the value of a position for a one basis point move in yields.
Variation margin. The cash a futures holder pays or receives every day as the price moves.
CTA. A commodity trading advisor, in practice a fund that follows price trends with futures.
Managed money. The CFTC's category for speculative funds in commodity futures.
OAS. The option adjusted spread: the average extra yield of a group of corporate bonds over Treasuries, after removing the value of the call options some of them carry.
CDS. A credit default swap, a contract that works like insurance against a company's default, quoted as an annual cost in basis points of the amount insured.
BDC. A business development company, a fund, listed or not, that lends to mid sized private companies.
Carry trade. Borrowing in a low yielding currency, such as the yen, to hold assets in a higher yielding one. It earns the rate gap, and loses when the funding currency rises.
JGB. A Japanese government bond.
Overnight index swap (OIS). A contract on the average overnight policy rate over a period, used to price the odds of a central bank move.
Prediction market. A market, such as Kalshi or Polymarket, where contracts pay out if an event happens, so their price reads as a probability.
Standard deviation (σ). The usual size of a move. A move of 2 σ or more, up or down, happens about once in twenty periods if moves are normally distributed.
Defensives and bond proxies. Stocks whose earnings hold up in a slowdown, such as utilities, consumer staples and health care. Bond proxies are those whose steady dividends make them trade like bonds.
Gross and net exposure. Gross is the size of a fund's book, its longs plus its shorts. Net is the longs minus the shorts, its bet on the direction of the market. Both are often given against the fund's capital, as gross and net leverage.
Degrossing. Funds cutting their long and short positions at the same time, to reduce risk.
Questions readers ask
Is the US in recession? No. GDP grew at a 3.4% annual pace in the third quarter, the Fed's statement says activity is expanding "at a strong pace," and jobless claims are low. Hiring is weak, though, with 29,000 payrolls in September. Markets price a slowdown ahead of the data, not a recession: Polymarket gives a recession before the end of 2026 only 6.5%, with two months left to run.
Why is gold falling if a slowdown is coming? Because the first phase of a slowdown is a hunt for cash, and gold was the great winner of 2025. Real yields fell and gold fell anyway. In 2008 and in March 2020 gold fell first and turned around the time the Fed went all in. This time the Fed is priced to hike.
Inflation is 3.6%. Why are bond yields falling? Because the bond market believes the slowdown will bring inflation down, and because bonds have become a haven again on the days stocks fall. That belief is the bet I question.
Why are hedge funds cutting their gross exposure? Because volatility sets the size of their books. They came into October with gross leverage near the top of its five year range and small net bets, so a jump in volatility makes the same book riskier, and risk managers shrink it. The selling hits the stocks they own most first, the AI leaders, and some of the same funds run the Treasury basis trade.
Why should anyone outside hedge funds care about the basis trade? Because it is part of the plumbing that finances the Treasury market. When it unwinds, Treasury yields can jump at the very moment they should fall, as they did in March 2020.
What does the Bank of Japan have to do with US markets? Japan is among the largest foreign holders of Treasuries, and the yen funds carry trades worldwide. A Bank of Japan that tightens while the US slows narrows the rate gap from both sides. In August 2024 that mix took the dollar from about 153 yen to 141.7 in four sessions.
What changes if the Democrats win Congress? A divided government, little room for fiscal support in a slowdown, more pressure on the Fed to cut, and a political fight over who owns the 2027 economy. Together they push toward weaker growth, and the pressure on the Fed and the oil risk also push toward higher prices.
What would prove you wrong? Three things. Core inflation turning down while energy eases, which would make the slowdown disinflationary and the Fed free to cut. AI earnings and investment holding up while credit spreads return to their January lows. And gold back at new highs with breakevens falling, which would mean its fall was positioning, not the last piece.
A note to readers. From next week, CrossVol Research becomes a paid publication, at $15 a month. I will give the details in a short note next week, including what stays free and what is for paid subscribers. Thank you to everyone who has read and shared these pieces, and to those who have already pledged to support them.
This article is for educational purposes only. It is not investment advice, a solicitation, or an offer to buy or sell any security or derivative. Levels are as of the dates and times stated and can change quickly. Bonds, credit, equities, currencies, options and futures carry a high risk of loss. The five act framework belongs to Andy Constan (The Damped Spring Report, "The Script," July 10, 2023). The reading of 2026 is the author's own and does not represent his views. Prediction market prices are probabilities set by traders, not forecasts of the author.
$GLD $TLT $SPY $HYG $ORCL $CRWV $FXY
Data: Bloomberg, CFTC, FRED, ICE, EIA, US Treasury, Federal Reserve, BEA, BLS, Bank of Japan, Japan Ministry of Finance, Challenger Gray & Christmas, Milliman, Kalshi, Polymarket.