


By Djellal Djouad. November 11, 2026.
This article is for educational purposes only. It is not investment advice and not a recommendation to buy or sell anything. Options and futures carry a high risk of loss, and leveraged products can lose more than the amount invested.
Nebius Group (NBIS) reports its third quarter results on Thursday, November 12, before the market opens, with a conference call at 8:00 a.m. New York time. On Wednesday I sold the earnings move with a short iron fly. This post explains why, step by step, before anyone knows the result. I will publish the review of the trade after the exit, profit or loss. The thesis in one sentence: the options pay for Nebius's average earnings move, but in a violent sector a few jumps make that average and the typical report moves about half as much, so I sell the move for one night and cap the jumps with wings. The context comes first, because it sets the thesis; then each piece of evidence, and what it implies for the trade.
What is the context?
AI neoclouds, the companies that rent out GPU computing power to AI developers, have just lived through a violent two weeks. On October 28, Microsoft's quarterly capital spending came in below expectations, and CoreWeave, Nebius and IREN fell after hours. From the October 28 close to the November 5 close, CoreWeave (CRWV) lost 31.7%, Nebius 34.0%, IREN 37.5% and Applied Digital (APLD), which builds data centers for these companies, 30.5%. Nebius then bounced 17.5% over the next two sessions and fell 5.3% on Tuesday, November 10, on analyst comments about its Microsoft partnership: over the ten sessions to Tuesday, it lost 21.4%, and Nvidia 22.5%.
Credit is the other half of the story. CoreWeave borrows heavily to buy chips. Some of its bonds yielded more than 16% before its results, and the cost of insuring its debt for five years reached 1,289 basis points a year on November 5, up from 452 in June, as I wrote in AI Capex Cut. I covered the other weak point of that debt, chips that lose value faster than the loans that finance them, in The AI Depreciation Bomb.
Then CoreWeave reported, on Tuesday evening. Third quarter revenue rose 168% to $3.66 billion, the revenue backlog reached $132.5 billion, and the company raised its 2026 revenue guidance to $13.0 to $13.3 billion, with capital spending of $37 to $39 billion. It also lost $709 million in the quarter, after $846 million of interest expense. Its finance chief said: "At current yields, we do not intend to issue additional parent-level unsecured debt through 2027", and new debt backed by customer contracts is to come in the next few weeks. Its most recent bond deal I could find dates back to September 18: $3.7 billion of convertible notes at 2.875%, due 2033.
On Wednesday the sector rebounded violently. At Wednesday's close, CoreWeave was up 24.7%, Applied Digital 7.4% and IREN 5.6%. Nebius closed up 15.4%; when I entered the trade at 12:56 p.m., it stood at 158.97, up 18.6% on Tuesday's close of 134.00. The only cause I found in the press is a sympathy rally after CoreWeave's results. I found no news specific to Nebius.
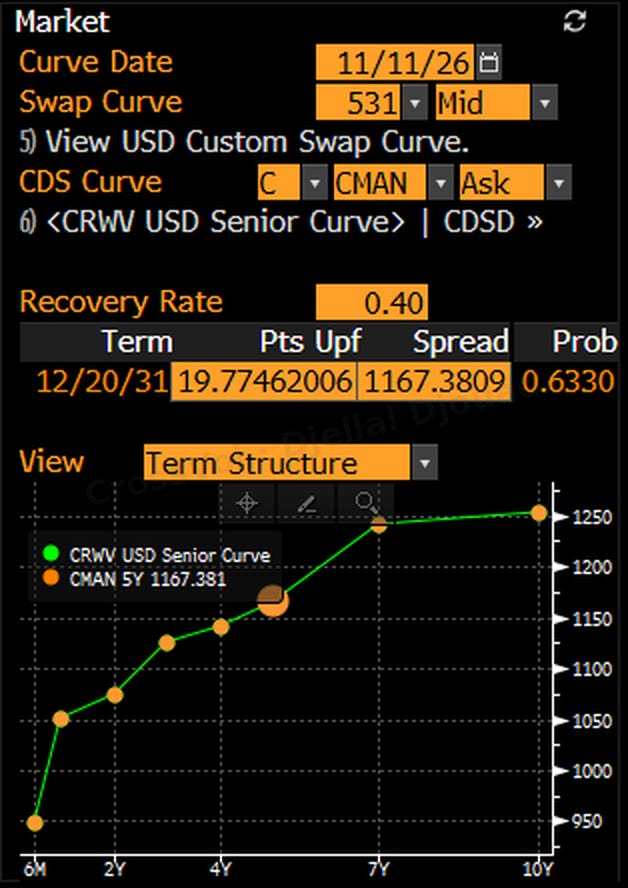
CoreWeave's credit relaxed but remains priced for a lot of risk. Its five-year credit default swap stood at 1,167 basis points on Wednesday, down from 1,289 on November 5. With the standard 40% recovery assumption, that spread implies a default intensity of about 19.5% a year (the spread divided by one minus the recovery rate), or a 63% probability of default by December 2031: a risk-neutral figure, which includes a risk premium and overstates the real-world odds, but shows how expensive the credit is. The curve still slopes upward, from about 950 basis points at six months, so the market prices costly credit, not an imminent default. A credit headline can move CoreWeave, and so Nebius, overnight: one more reason to own the wings.
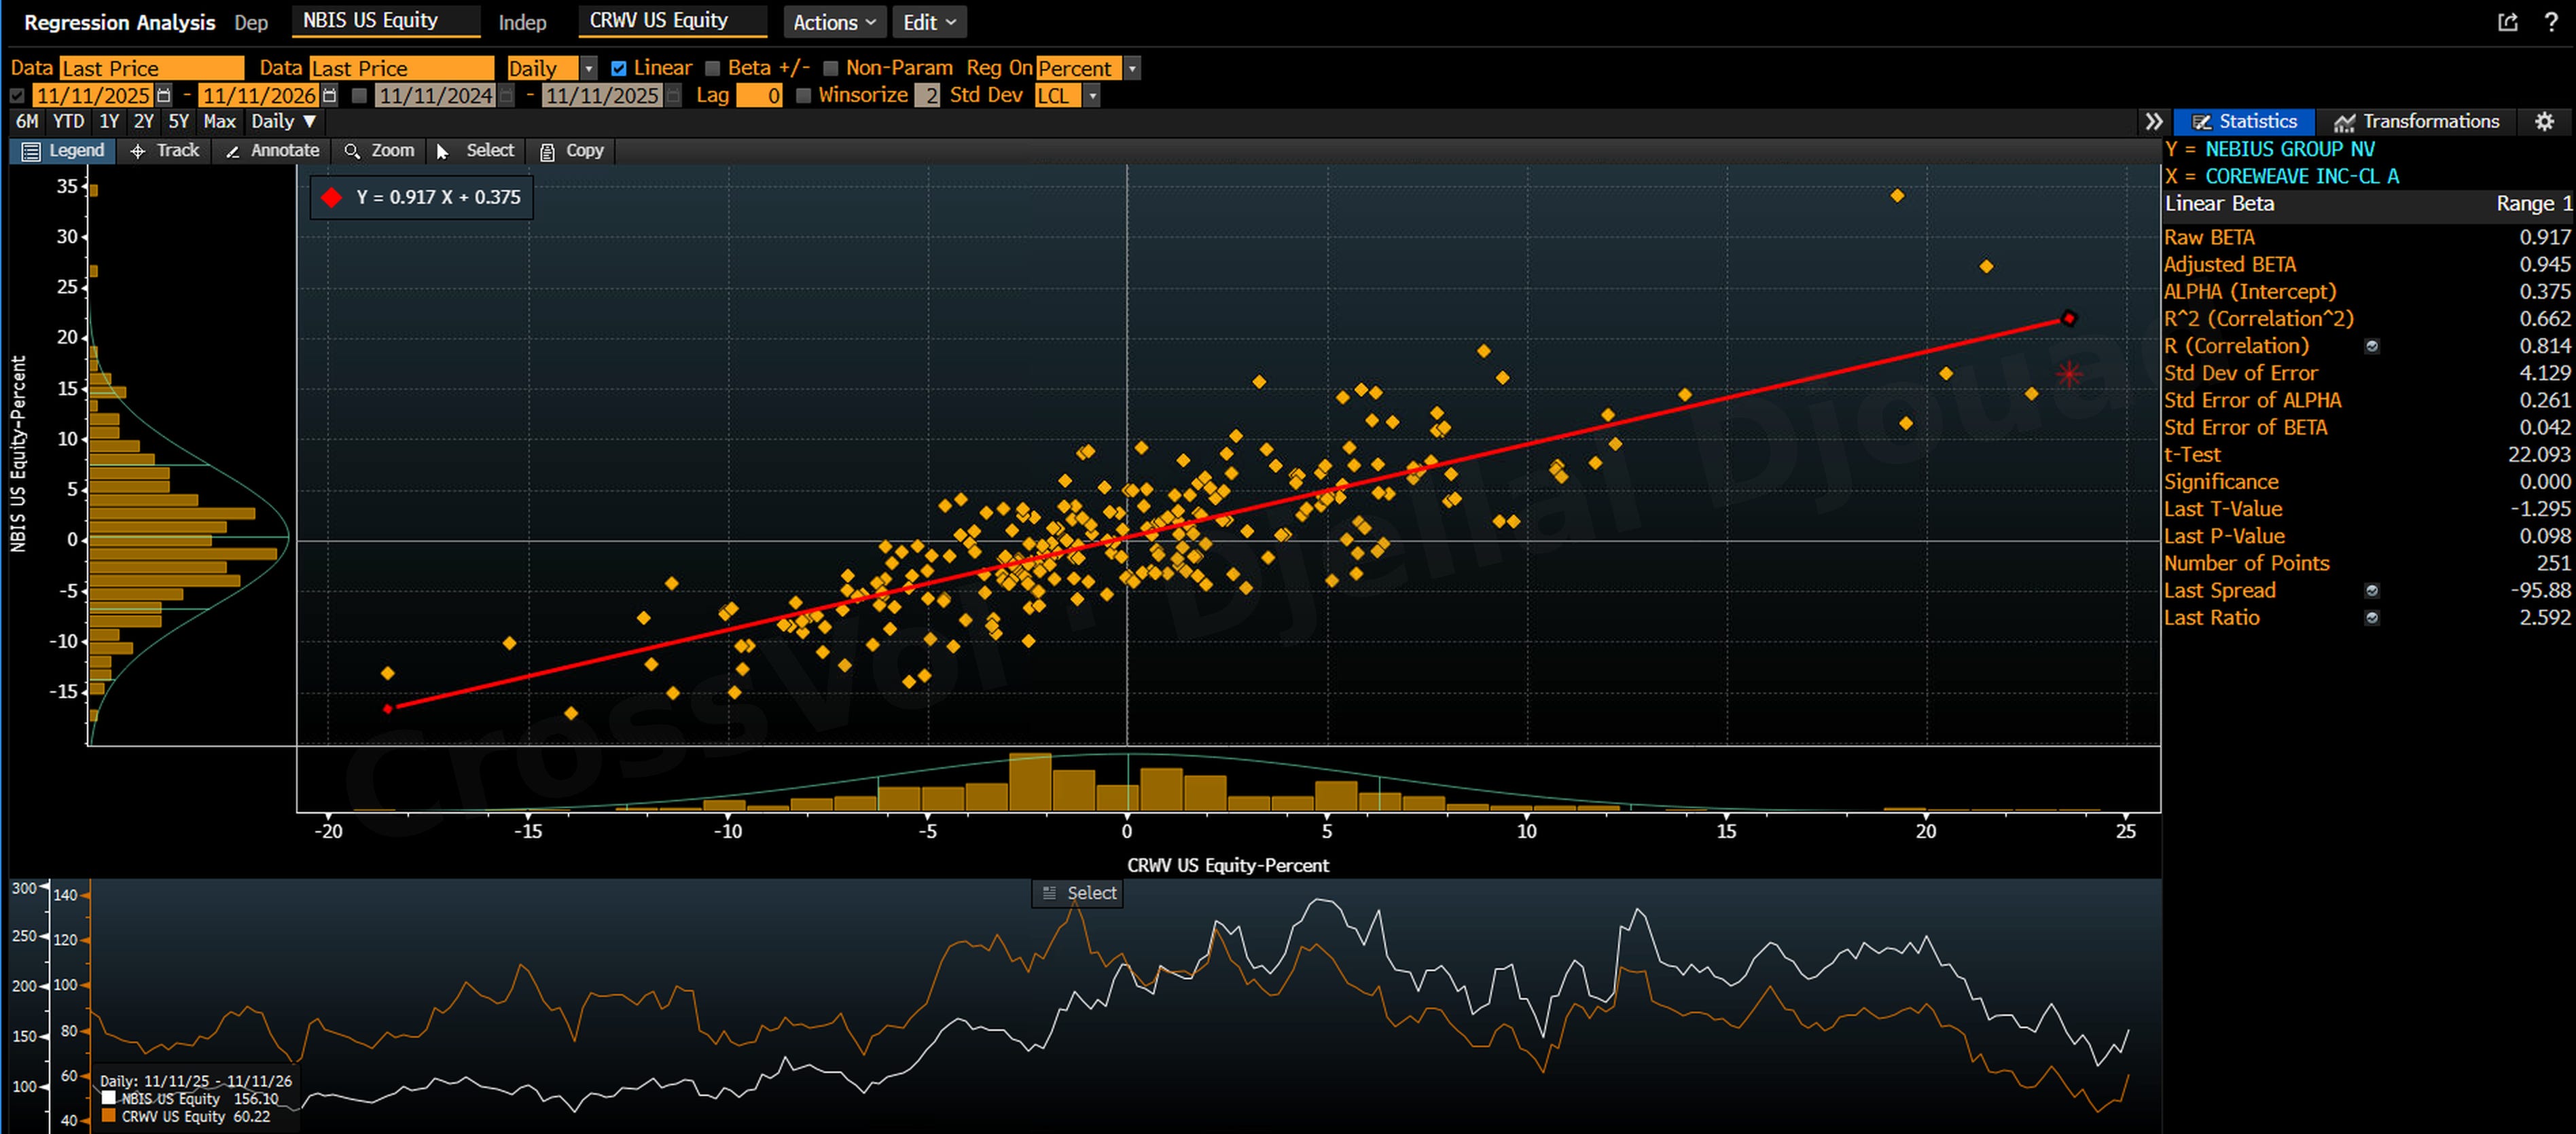
Why does CoreWeave matter for a Nebius trade? Because Nebius moves with it. Over the past year, a regression of Nebius's daily returns on CoreWeave's gives a beta of 0.92 and an R² of 0.66 on 251 days: two thirds of the variance of Nebius's daily moves goes with CoreWeave's. Against the Nasdaq 100, over the same year, the R² is only 0.32. A credit scare or a sector shock can therefore produce a large Nebius move on any day, with or without a report.
So the context says two things: the sector moves violently in both directions, and much of what moves Nebius comes from outside the company, from CoreWeave, credit or Microsoft. Hence the thesis stated at the top: the options pay for Nebius's average earnings move, but in a violent sector a few jumps make that average and the typical report moves about half as much, so I sell the move for one night and cap the jumps with wings. The five steps below test each part of that sentence.
Step 1: What move were the options pricing?
The cleanest gauge is the straddle: buying the call and the put at the same strike, a bet that pays if the stock moves far in either direction. Its price is the market's estimate of the move. At 12:56 p.m., the 160 straddle expiring Friday, November 13, cost 21 per share, or 13.2% of the stock price.
That 13.2% covers the rest of the week, not just the report. Implied volatility, the annualized volatility built into option prices, shows how much of it belongs to Thursday. It stood at 221% for Friday's expiry, 136% for November 20 and 113% for November 27. The gap between the weeks is the earnings day. The straddle's price implies a standard deviation of 16.5% to Friday's close. Take out the ordinary sessions left, at Nebius's usual standard deviation of 6.6% a day outside reports over the past year, and the options priced an average earnings-day move of about 11.5%, up or down. Pricing those ordinary sessions at the volatility the later expiries imply once the earnings day is stripped out of them gives 12 to 13% instead: either way, at least the historical average.
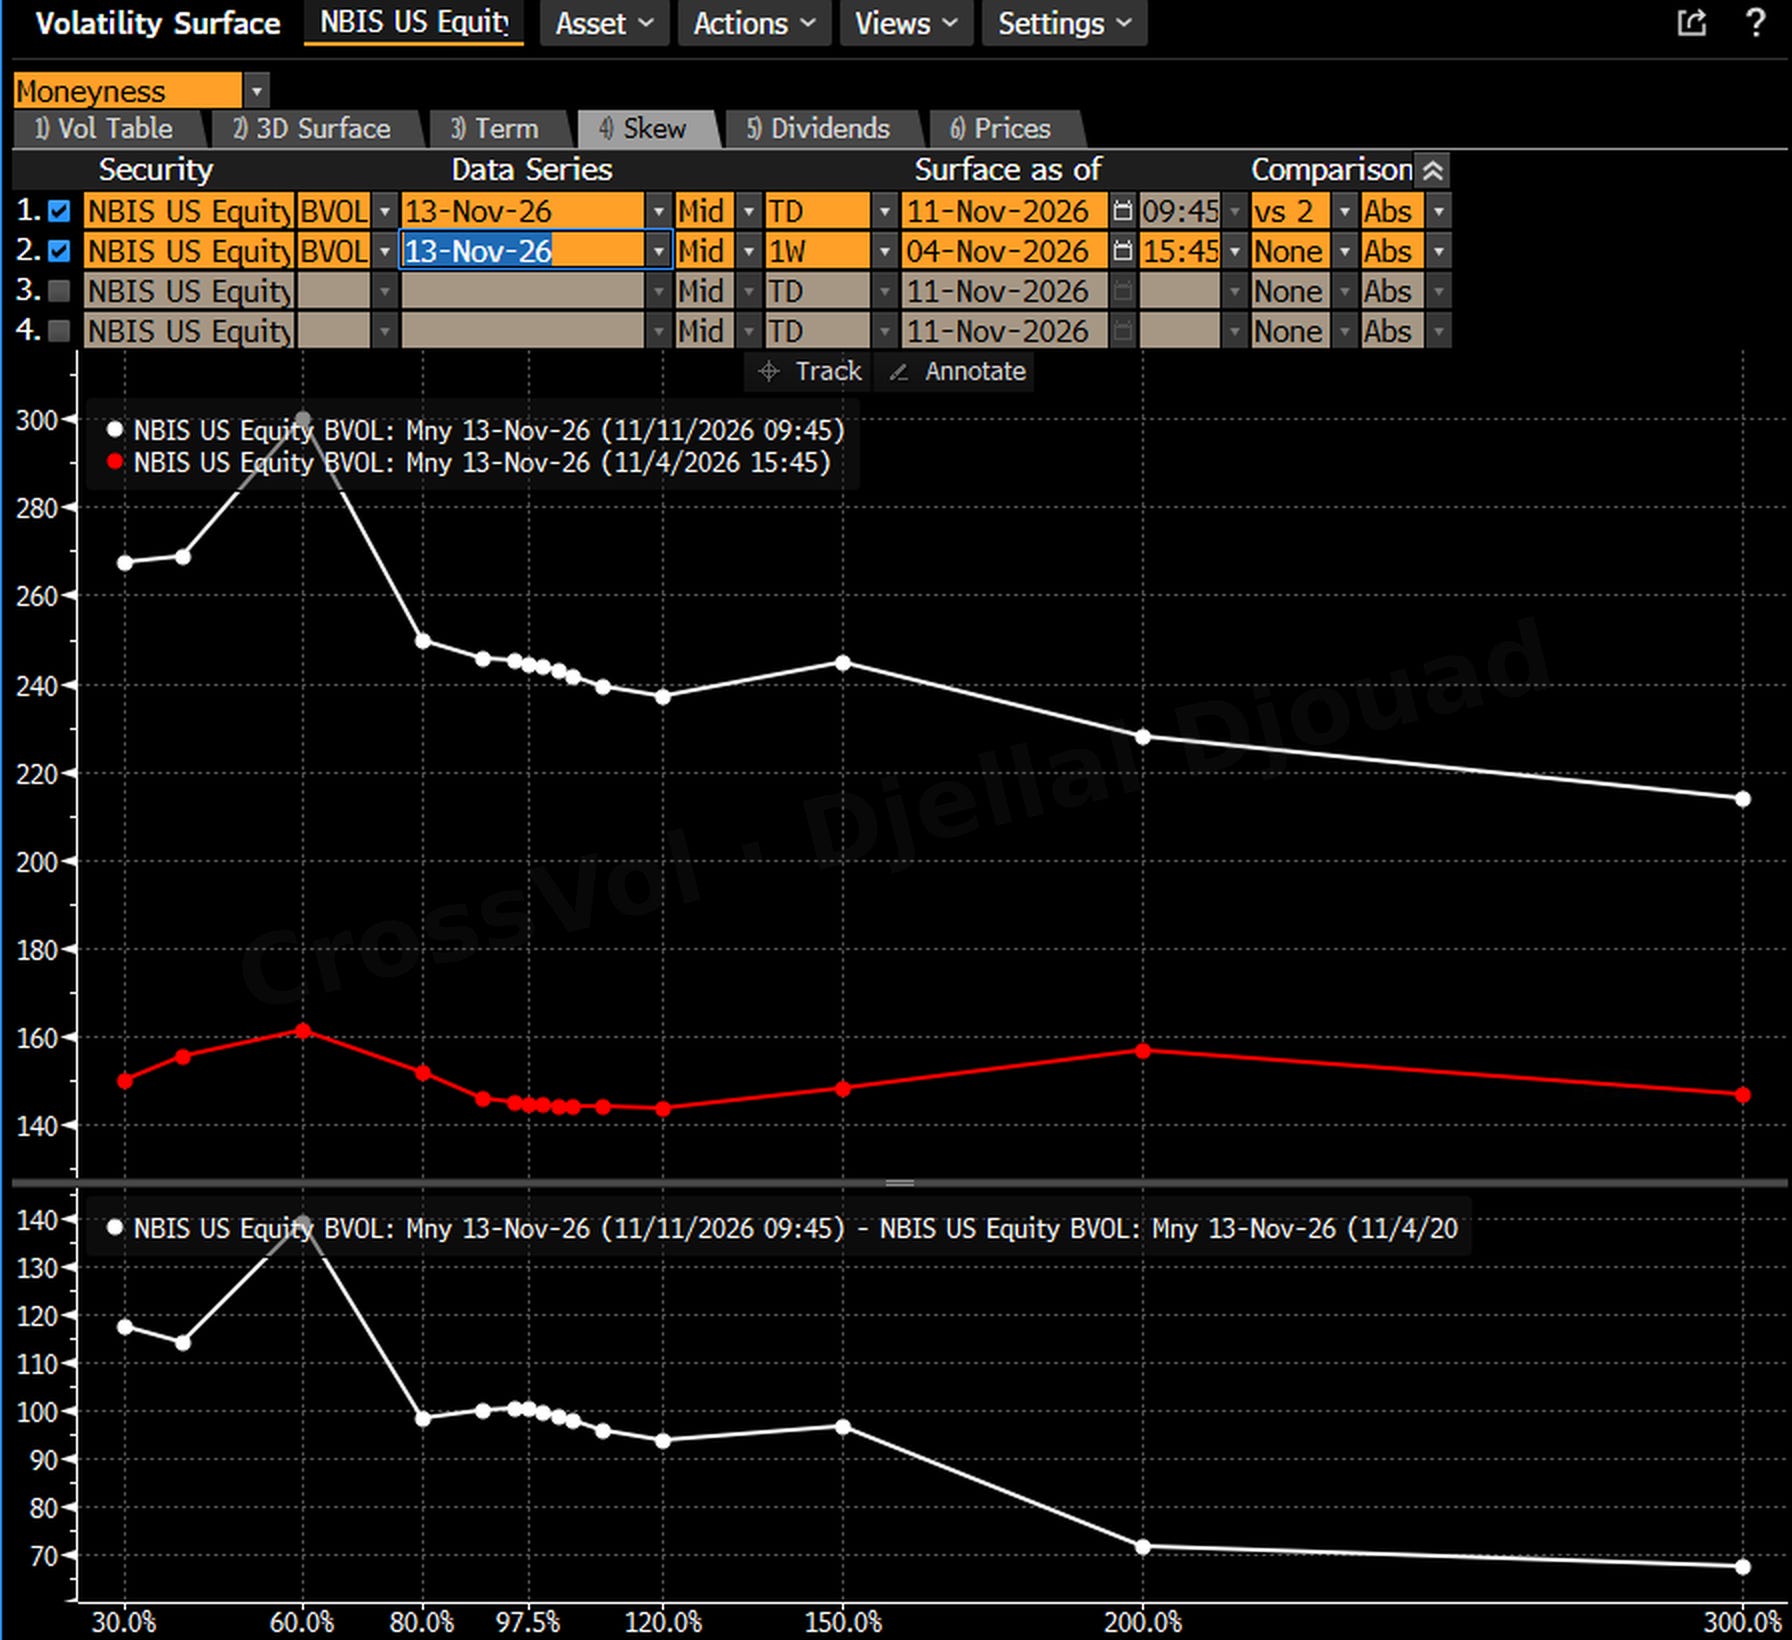
The volatility surface shows how that event premium was built. Friday's at-the-money implied volatility rose by about 100 volatility points between November 4 and Wednesday morning, almost evenly across the strikes near the money: the same report, priced over fewer remaining days, weighs more and more in an annualized volatility.
So the trade targets this event premium: it uses Friday's expiry, and the exit is planned for Thursday, once the report is out and the event premium has drained, or not.
Step 2: How big is a typical Nebius earnings move, and how thick are the tails?
Next, compare that price with what the stock has actually done. I measured each of the last eight reports from the close before the release to the close of the first session after it: -3.1% (October 31, 2024), +3.2% (February 20, 2025), +4.2% (May 20, 2025), +18.6% (August 7, 2025), -7.0% (November 11, 2025), +1.3% (February 12, 2026), +15.7% (May 13, 2026) and +34.1% (August 12, 2026).
The average absolute move is 10.9%. The median is 5.6%. The options paid for about the average move, 11.5% against 10.9%, while the typical report moves half as much. Three of the eight reports moved more than 11.5%, all three upward, and five stayed inside. On its own, that proves little: even a fairly priced move is exceeded about four times in ten. The telling number is the median: if moves followed a normal curve, a price of 11.5% would imply a median move of about 9.7%; the actual median is 5.6%.
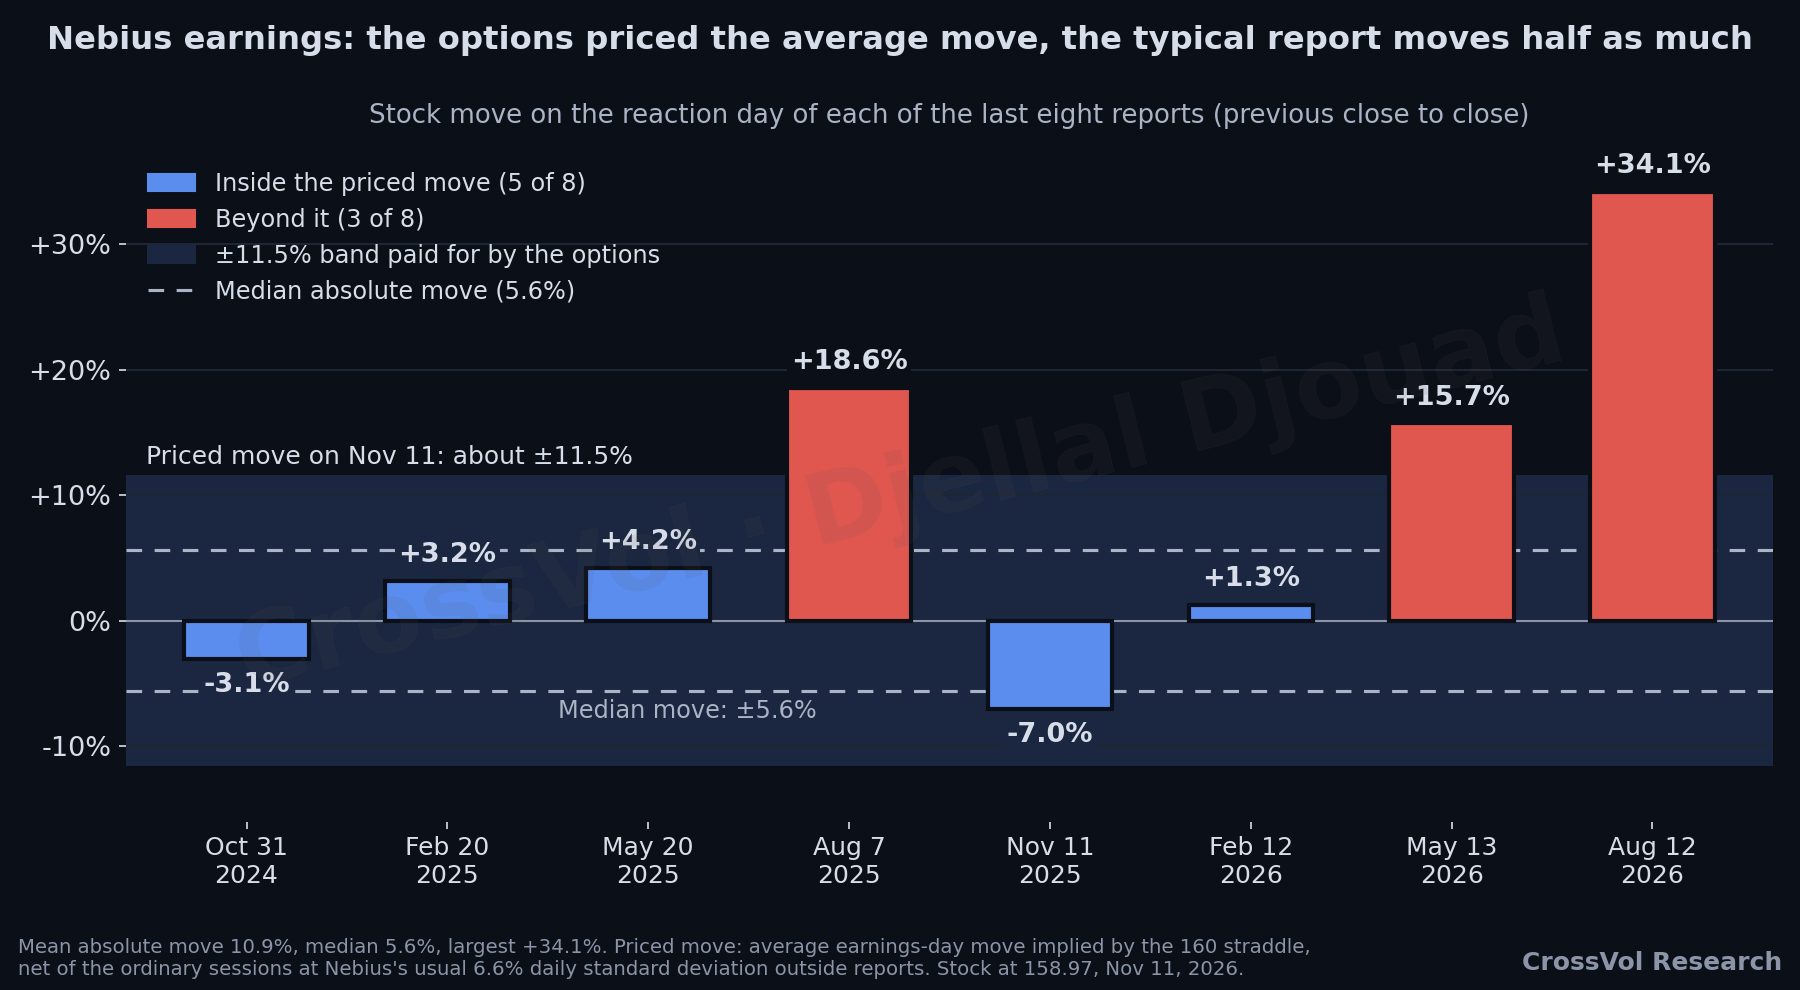
A gap that wide between the average and the median is the signature of thick tails. If earnings moves followed a normal distribution, the average absolute move would sit only 18% above the median. Here it is almost twice the median. Kurtosis measures the same thing on daily returns: excess kurtosis is zero for a normal distribution and rises when rare, large moves dominate.
Over the past year, the excess kurtosis of Nebius's daily returns, measured on log returns, is 1.3, and it falls to 0.5 once the four report days are removed. Those four days are 1.6% of the sessions but 9.5% of the year's variance, six times their weight. Over the longer history since October 2024, excess kurtosis reaches 5.8, and removing the eight report days does not lower it (6.0): the two largest daily moves of the period, -37.4% on January 27, 2025 and +49.4% on September 9, 2025, came on days without a report. Over the past year, the two isolated bars on the right of the histogram below are August 12, 2026 (+34.1%, a report) and July 30, 2026 (+27.1%, no report).
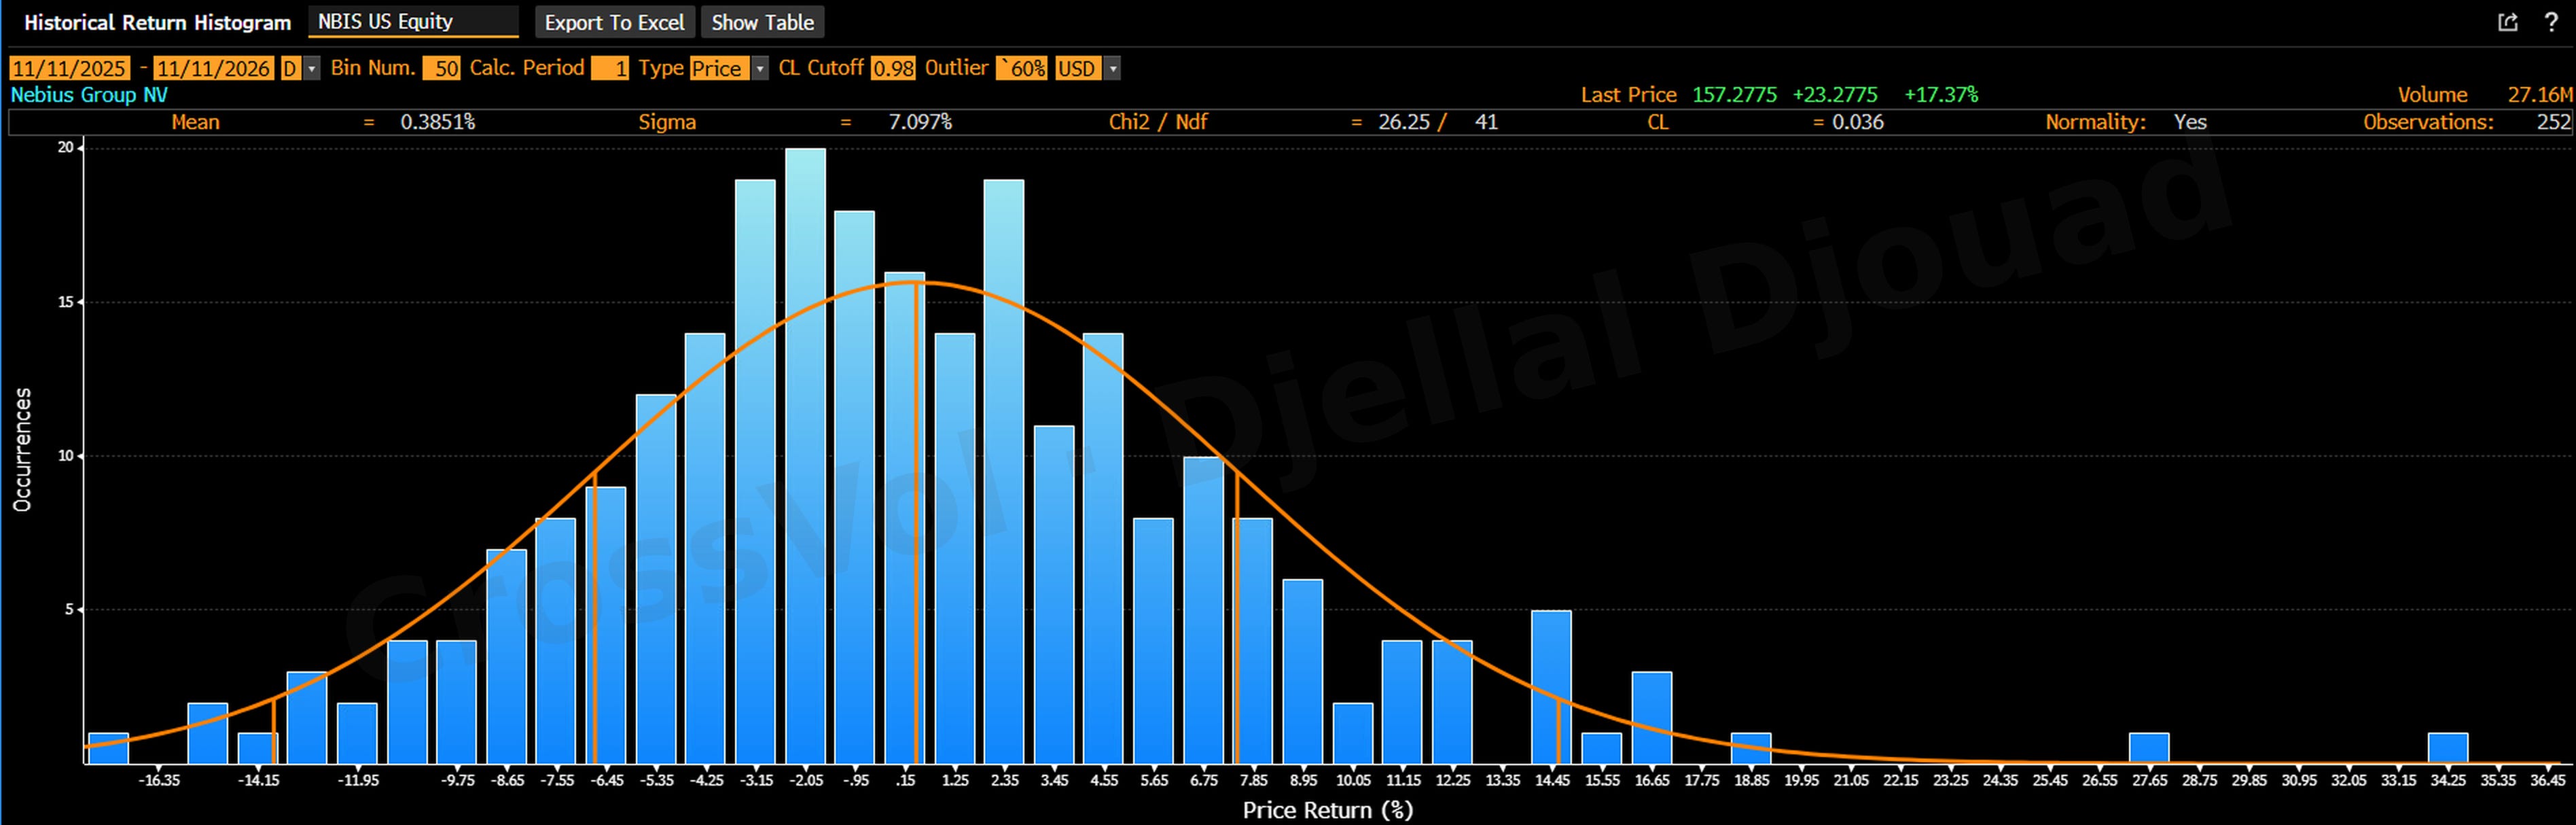
The screen's normality test passes over the year: it weighs the many ordinary days, and has little power in the tails, where each bar holds a single day. So the median supports selling the report move, but the tail is real, it has hit both sides, and it can come from news as well as from a report: the sale has to be capped on both sides.
The cap bounds the worst case. On the August 2026 move, the replay in Step 4 loses 12.22 per share with the wings and 32.24 without them, and the capped sale still made +2.35 per share on average over the eight reports, against +1.77 without wings.
Step 3: Is volatility expensive, and which side?
Thirty-day implied volatility stood at 109.5% on Wednesday. Over the past year it ranged from 71.5% in early October to 167.7% in July. Two gauges place today's level in that history. The rank, the position between the year's low and high, is 39%. The percentile, the share of the year's sessions with a lower implied volatility, is 79%; I measured it on the one-year chart below, sampled at 252 points, so it is accurate to about one point. The two disagree because of July's spike, which stretches the range and makes the rank look low. On most days of the year, implied volatility was lower than today: its median was about 95%.
Against what the stock actually does, the picture flips. Realized volatility, measured on daily closes up to Wednesday's and annualized, was 161% over the last 10 sessions, 119% over 30, 96% over 60 (close to the orange line on the chart) and 125% over 90. Options usually cost more than the moves that follow, a gap known as the volatility risk premium. On Nebius, one-month implied volatility at 109.5% sat below three of these four measures: it was not rich against what the stock had just done.
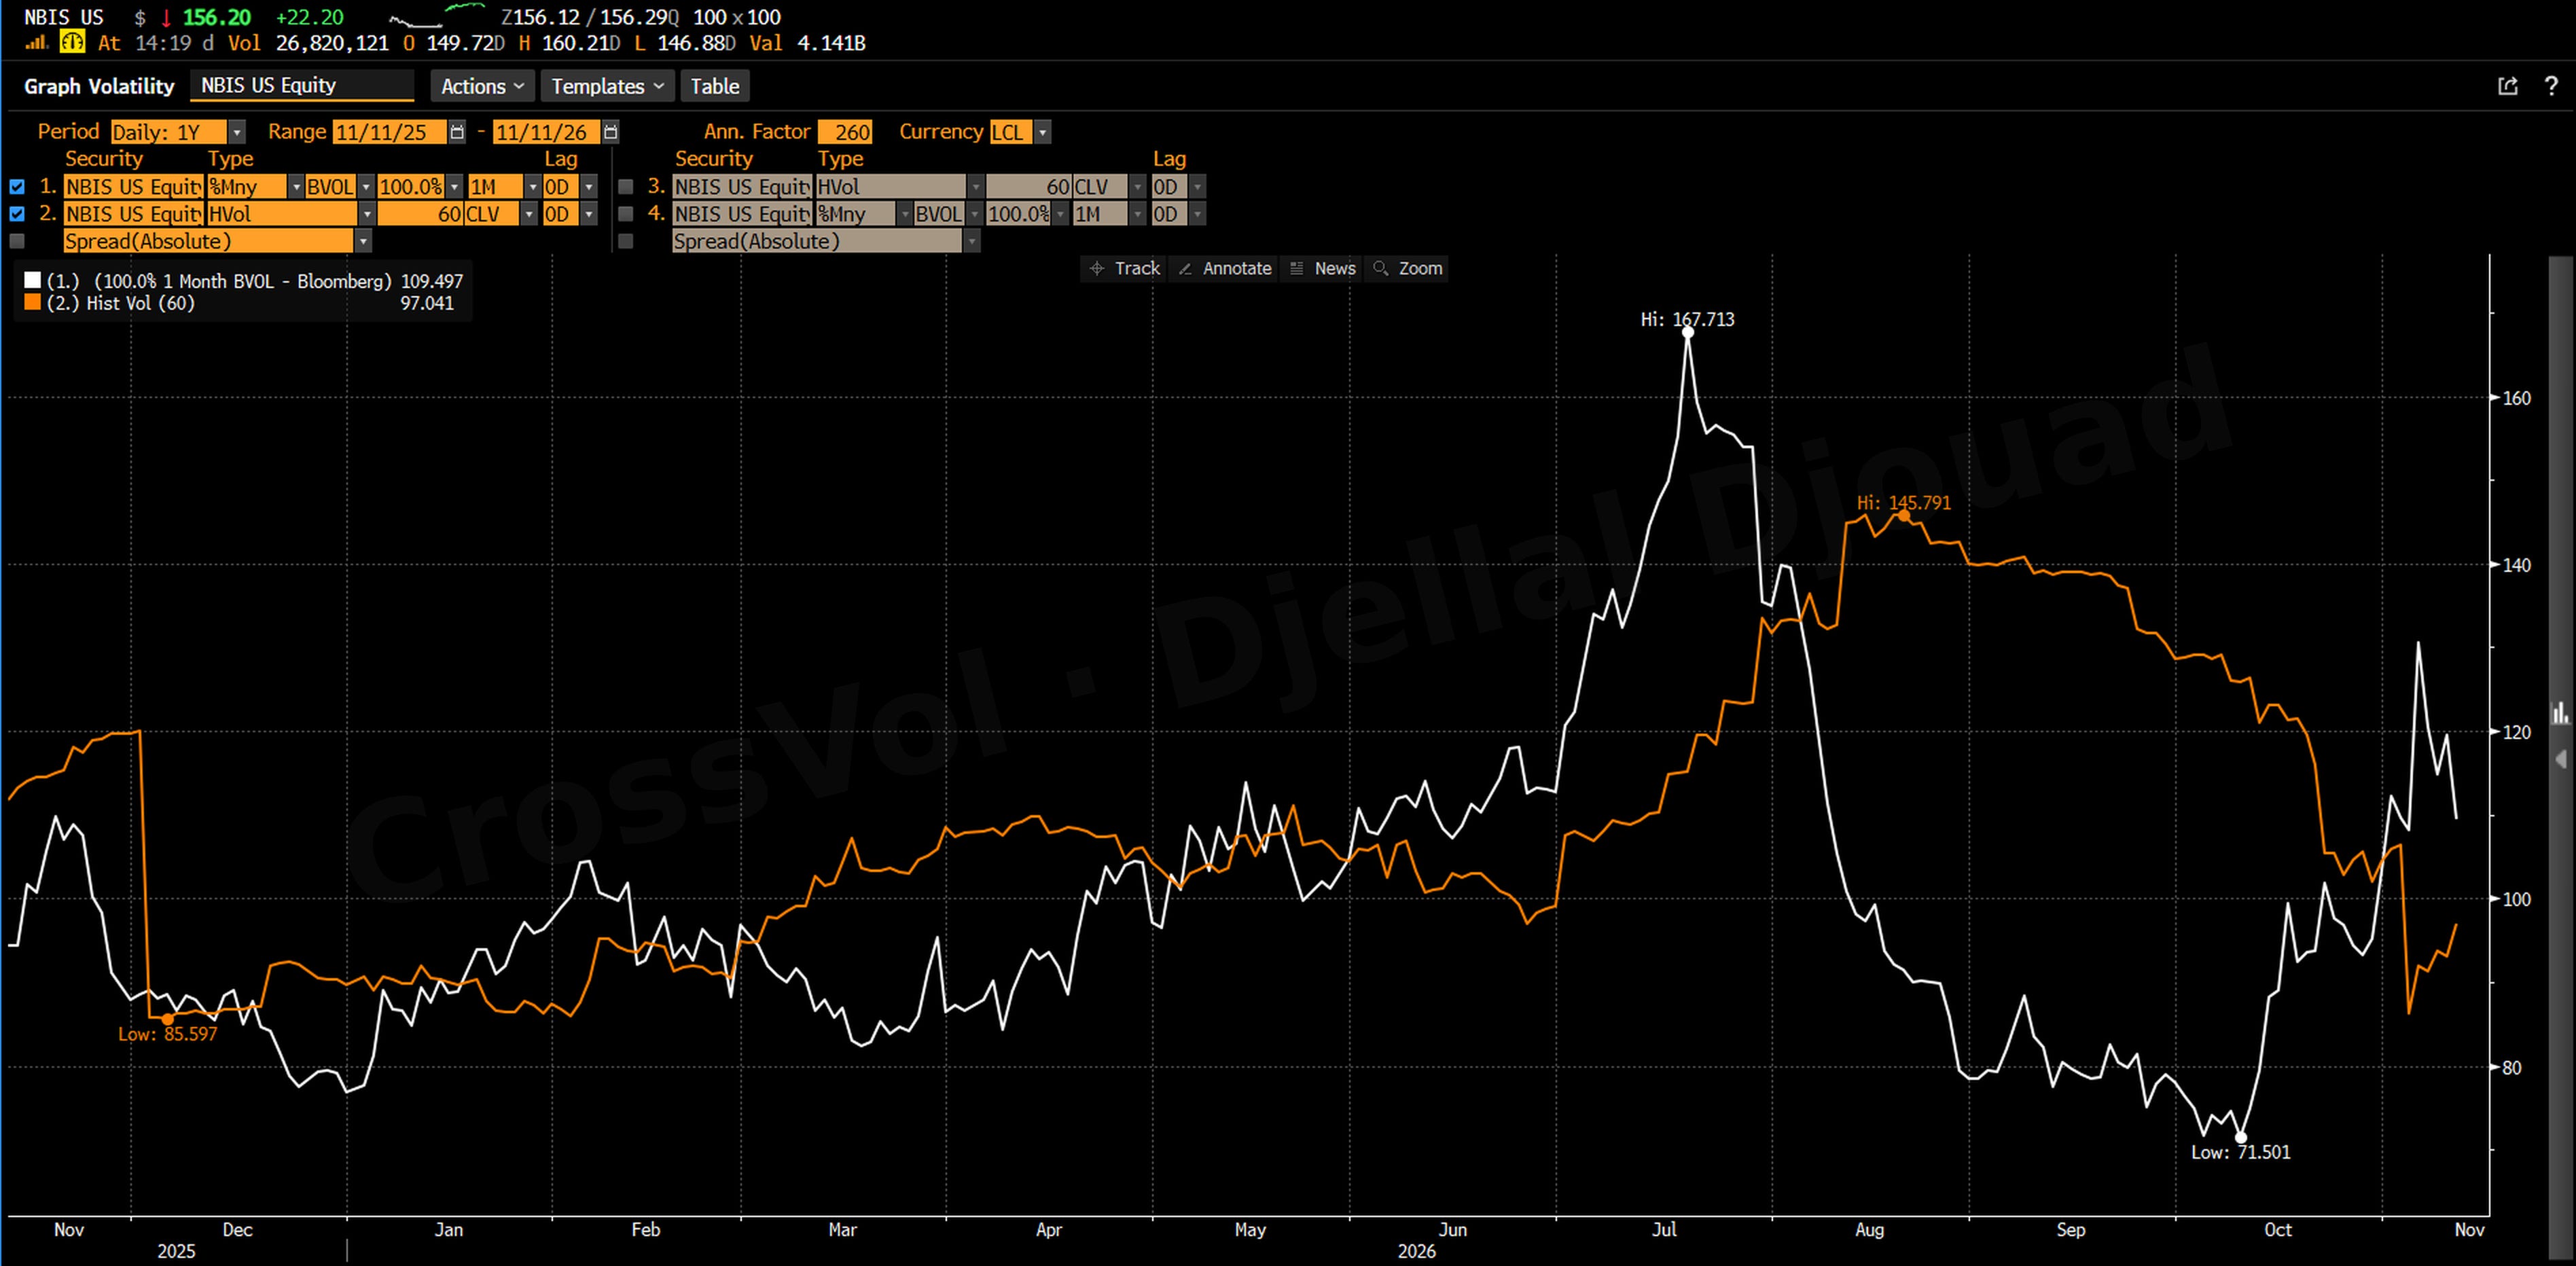
So implied volatility is high for Nebius's own year, but not high for what the stock is doing now. This is not a bet against volatility in general: with one-month implied volatility no higher than the stock's recent moves, a one-month volatility sale would have no clear edge here. The edge, if there is one, sits only in the event premium and in the shape of past moves: most reports are small, a few are huge, and the wings cap the huge ones.
Skew measures how much more puts cost than calls at the same distance from the stock. A steep put skew says the market fears a fall; a call skew says it fears a squeeze. Here it was nearly flat. Near the money, at 12:56 p.m., puts stood 0 to 3 volatility points above calls. Further out, on the surface above, Friday's implied volatility is only about 13 points higher at 80% of the stock price than at 120%, about 5% of its level; the pricer in Step 5, on the ask side for both, shows 12 points between the 130 put and the 190 call at 2:06 p.m., and by 3:14 p.m. the screen in Step 4 had the two wings within about 2 points of each other. Neither side was rich, so there was no reason to tilt the trade: a symmetric structure centered at the money, the 160 strike, was the natural shape. I explained how to read this gauge in Risk Reversal Skew Explained.
Step 4: Where do the options sit, and which structure?
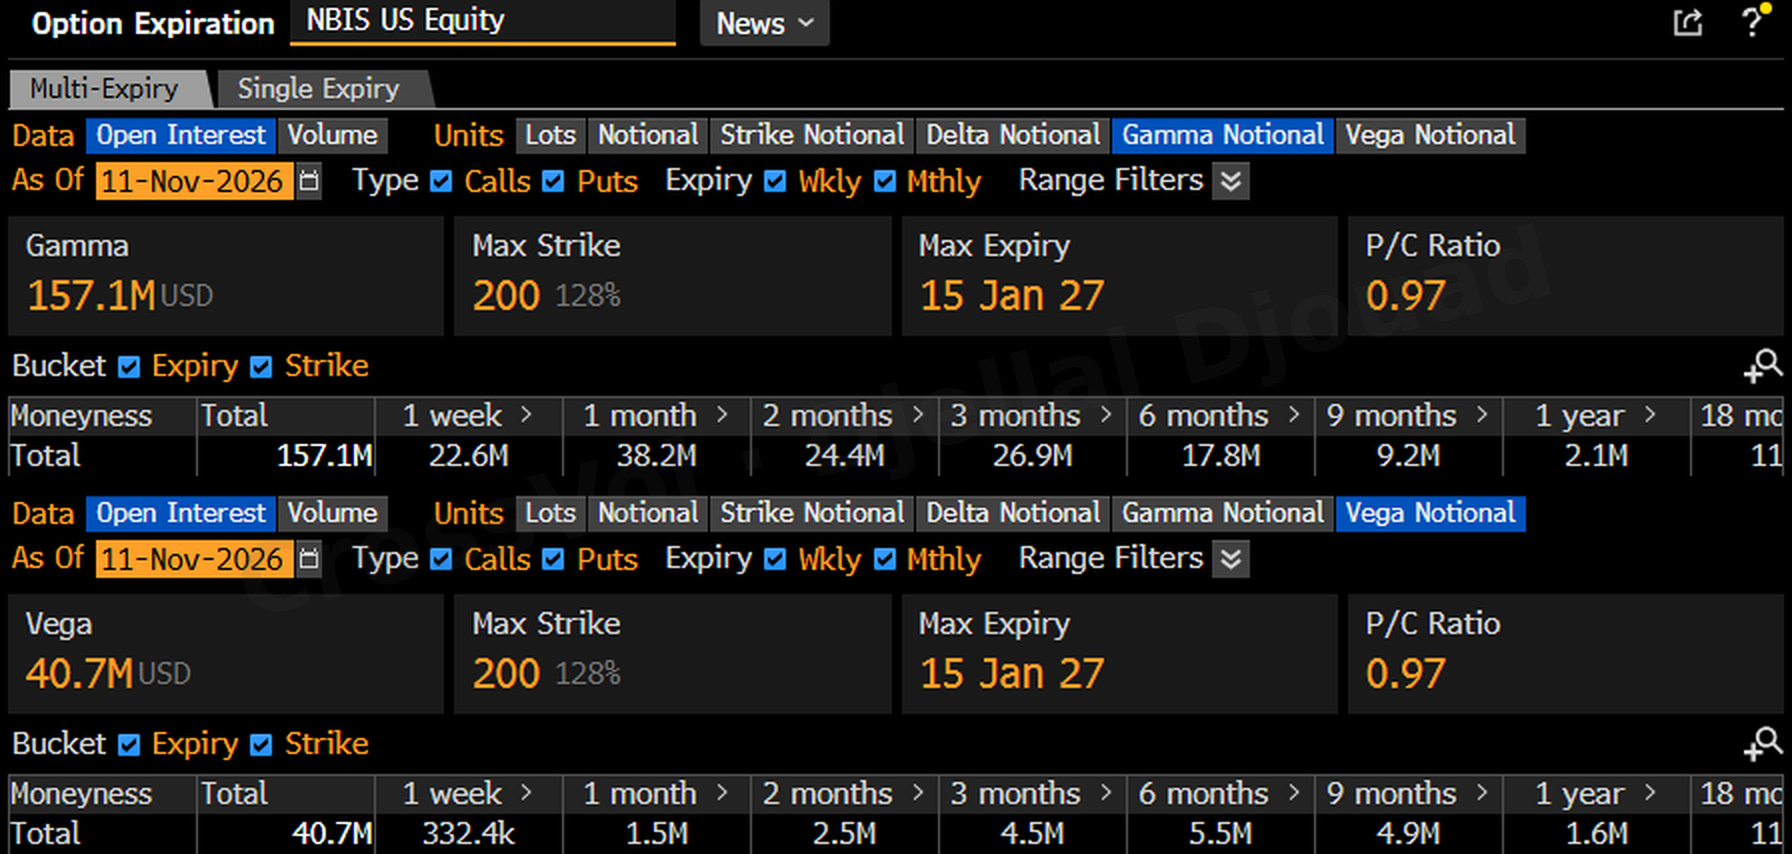
The open options show where the hedging flows sit, and that matters for where the strikes go. Gamma is how fast an option's delta, its exposure to the stock, changes when the stock moves. The dealers on the other side of these options hedge by trading the stock, so the strikes with the most gamma are where that hedging is heaviest. I mapped it from open interest at Tuesday's close for the expiry of the trade, Friday, November 13, and for the monthly expiry a week later.
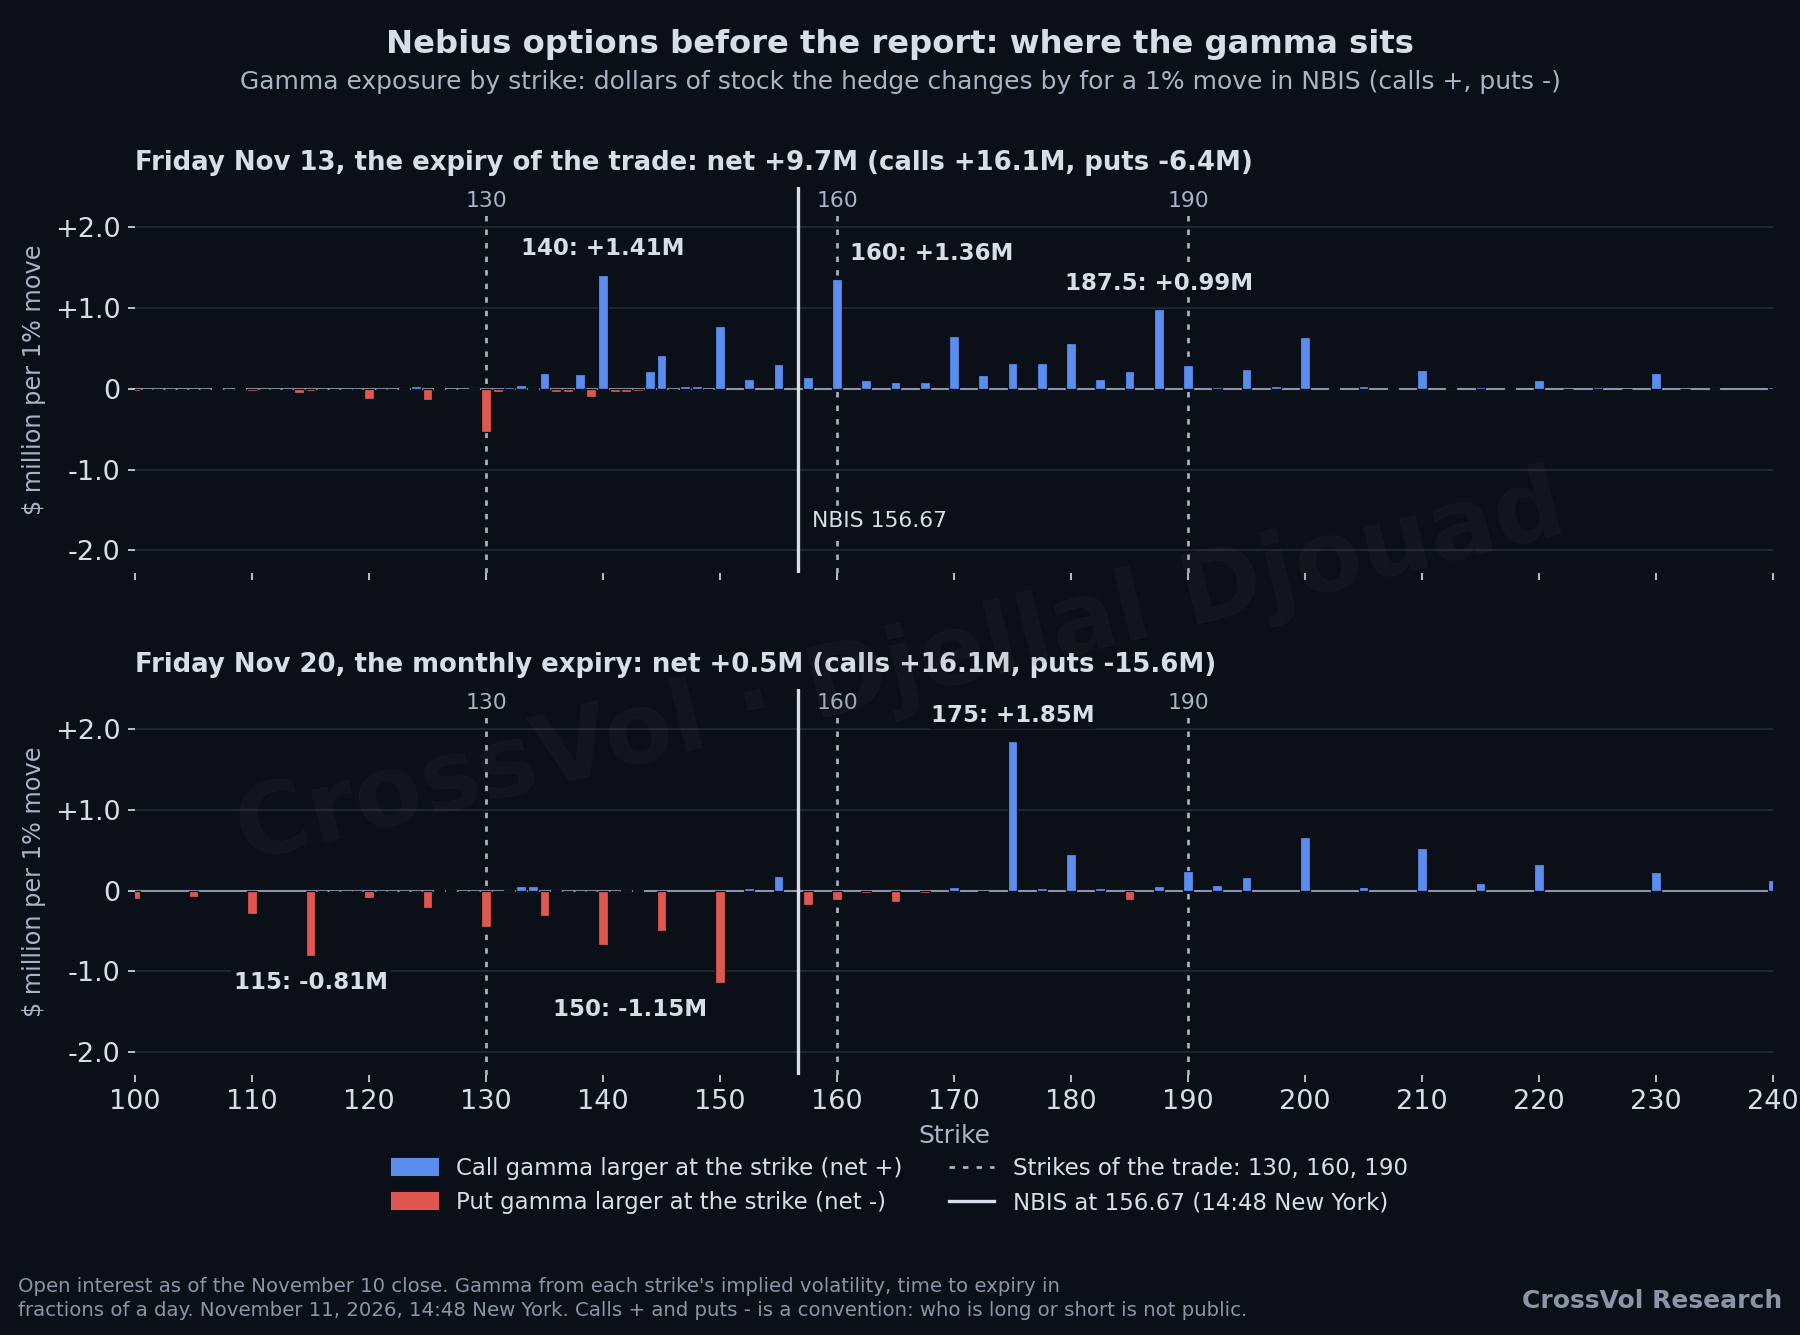
On Friday's expiry, about four fifths of the gamma sits between 130 and 190, and the two largest levels, on my measure and on the screen below, are 140 and 160. The 160 and 180 calls were the two most traded options of that expiry in my 2:48 p.m. count, with more than 10,000 contracts each by 3:14 p.m., and calls outnumbered puts more than two to one. On the monthly expiry, the 175 call strike holds the largest level, close to my upper break-even of 177.66, with the 150 put strike next.
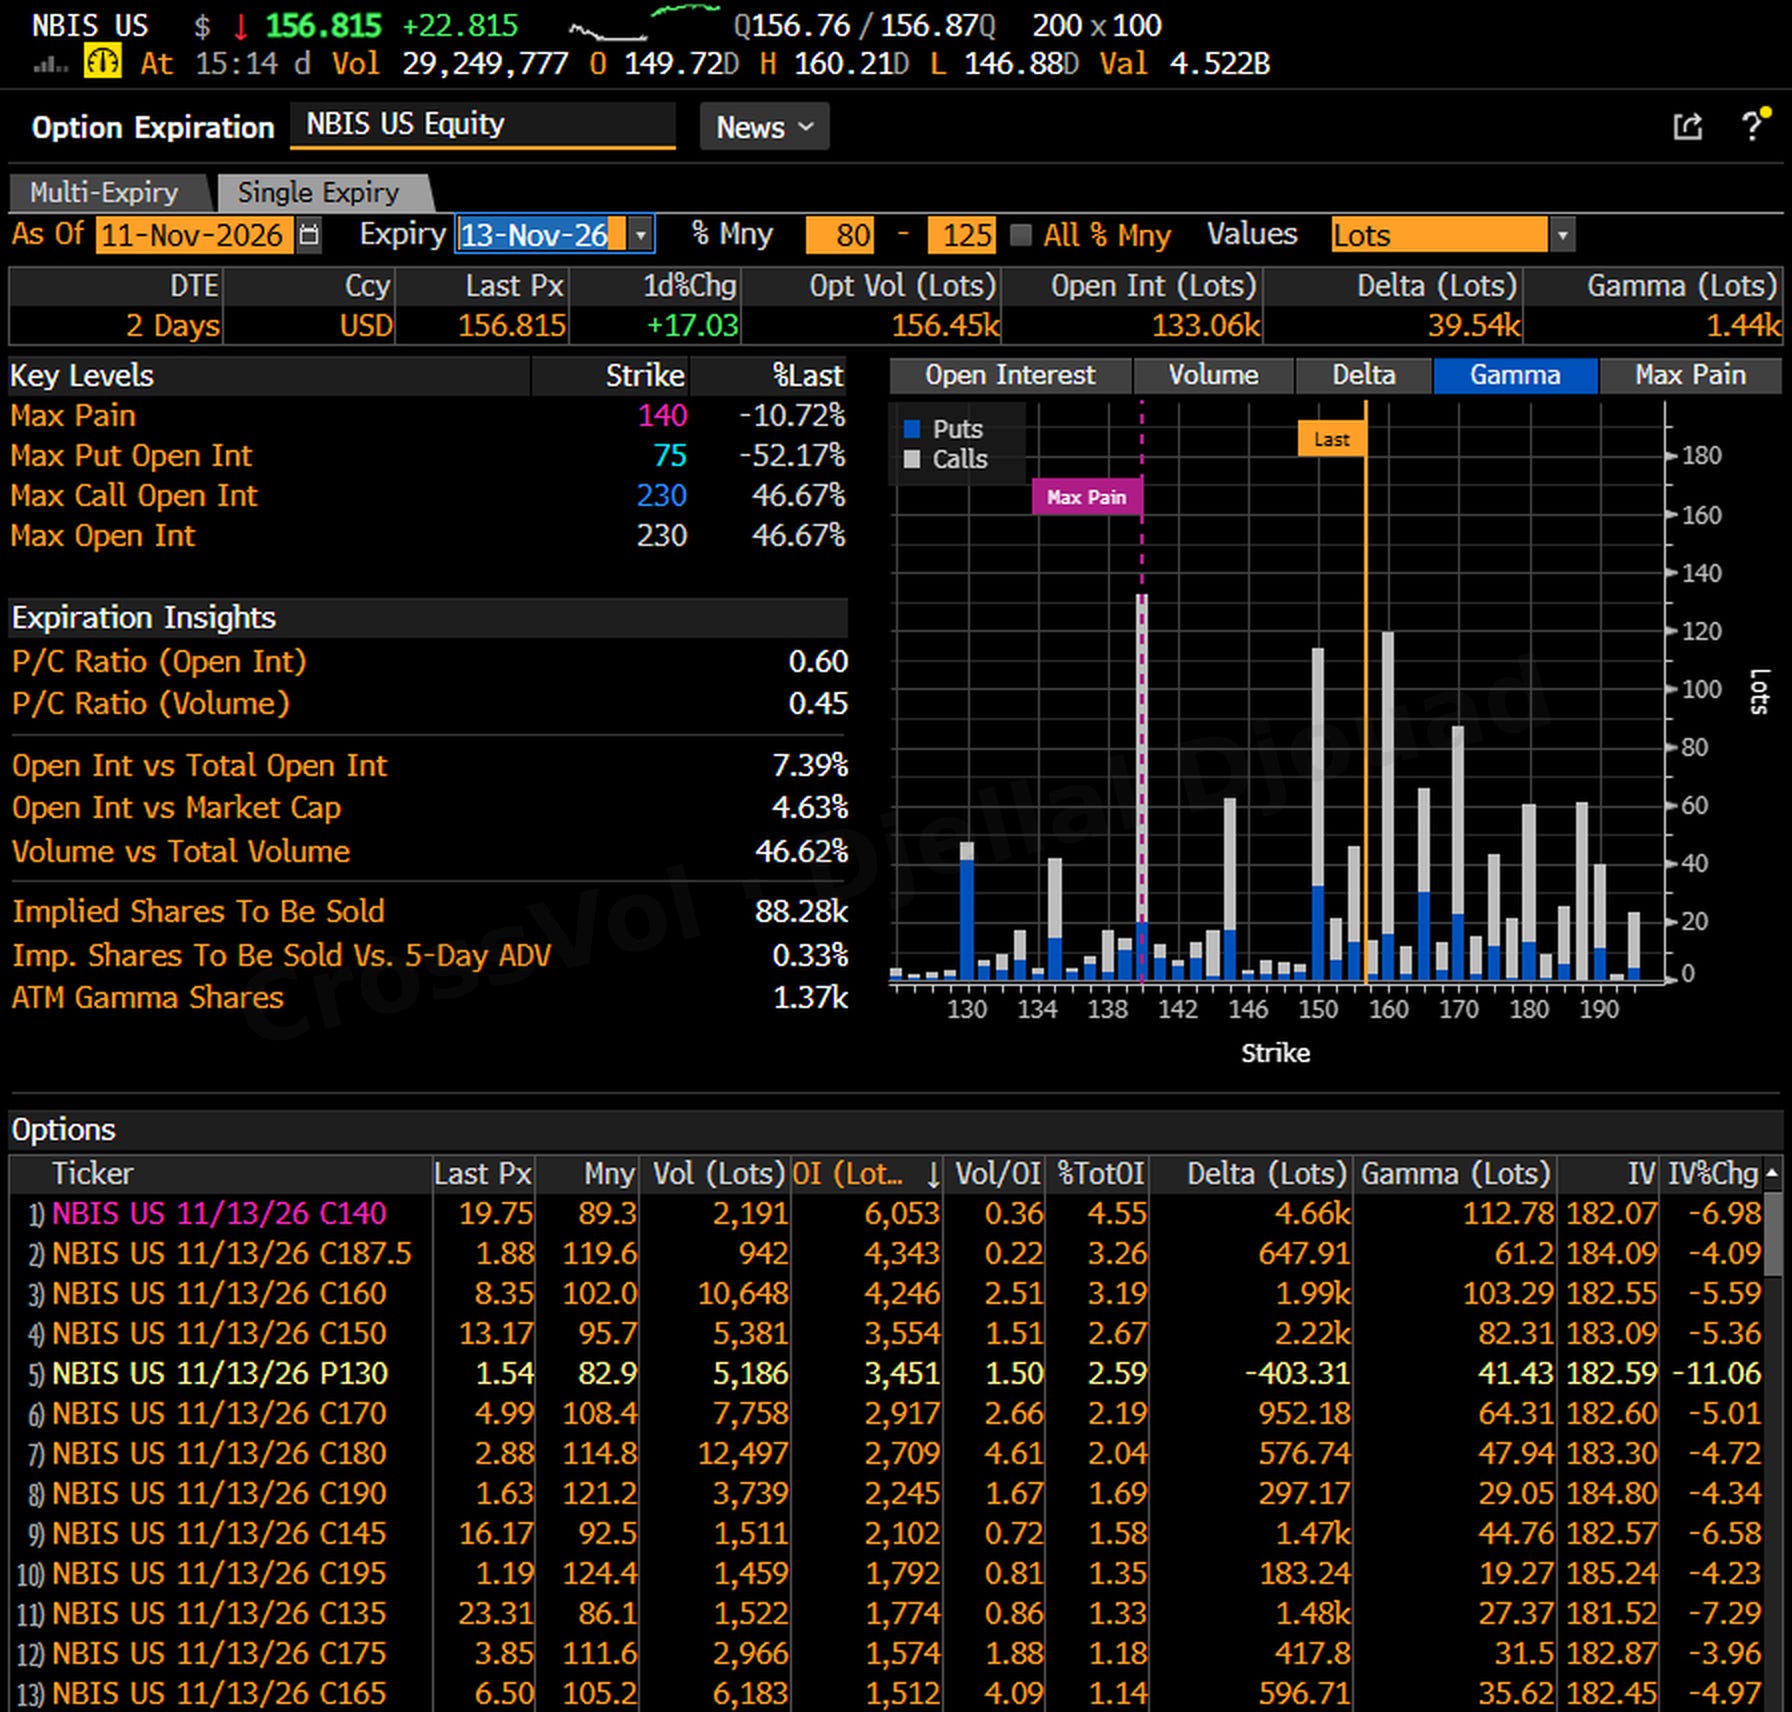
Is a large level a magnet or an accelerator? A magnet when dealers own the options: they sell rallies and buy dips around the strike, and the price sticks to it. An accelerator when they are short them: their hedging buys strength and sells weakness, and the move runs. My chart uses the usual convention, dealers long the calls and short the puts, but with buyers chasing calls on Wednesday, the opposite is at least as likely, so I count on neither a pin nor a push. The map still shapes the trade in three ways. The short strike sits at 160, at the money, where the gamma and the trading are concentrated and where the options will be easiest to buy back. The wings sit at 130 and 190, at the edges of the zone that holds most of this week's gamma: the move history sets them (Step 2), and the map adds that beyond them little gamma is left, at today's price, to slow or feed a move. And the gamma of the 160 options grows fast into the expiry: with implied volatility at 95% after the report, my pricing puts it at nearly three times Wednesday's level with one session left, and about five times two hours before Friday's close. Being short the 160 strike on Friday, when that gamma peaks, is the gamma and pin risk I avoid by closing on Thursday.
The same screen confirms that the trade sells the event, not volatility in general: the options expiring this week hold 14% of the gamma of all Nebius options, but only 0.8% of their vega, the sensitivity to a change in implied volatility.
With the strikes set, I replayed five structures on the eight past reports. Each historical move was applied to 158.97, every position was valued at Thursday's close with implied volatility at 95% after the report, and entry prices were Wednesday's mid prices. Results per share:
Short iron fly 160, wings 130 and 190: +2.35 on average, 5 winners out of 8, worst -12.22.
Short straddle 160: +1.77 on average, 5 out of 8, worst -32.24 (August 2026), with no limit beyond.
Calendar 160, sell November 13 and buy November 20: +1.04 on average, 5 out of 8, worst -6.40.
Short iron condor 140/180, wings further out than the fly's: +0.69 on average, 5 out of 8, worst -10.56.
Long straddle 160: -1.77 on average, 3 out of 8, worst -13.19.
In plain words: a short straddle sells the 160 call and the 160 put and keeps the premium if the stock stays near 160, with no limit on the loss. The iron fly is the same sale plus a 130 put and a 190 call bought as insurance, which caps the loss. An iron condor sells further away, here the 140 put and the 180 call, so it wins over a wider range but collects less. A calendar sells this week's option and buys the same strike for the following week, and earns as the earnings premium drains out of the front week.
The iron fly had the best average and a maximum loss known at entry. The short straddle earned less, because the iron fly's insurance costs little and pays heavily in a move like August 2026's +34.1%, and the straddle's loss has no floor: Step 2 rules it out. The calendar lost less in its worst case, but earned less than half as much on average, and its result depends on where next week's volatility settles after the report, a second unknown. The condor's short strikes at 140 and 180 still sat inside the range of the big moves.
Why wings at 130 and 190? They sit about 18% below and 20% above the entry price, well beyond the priced move of about 11.5%: far enough to keep most of the premium, close enough to cap a jump like August 2026's, a CoreWeave shock or another day like Wednesday. Together they cost about 3.3 per share, the gap between the straddle's 21 and the iron fly's 17.66 credit.
Eight reports are a small sample. The replay ranks structures; it does not prove an edge.
Step 5: Where do I get out, and what can I lose?
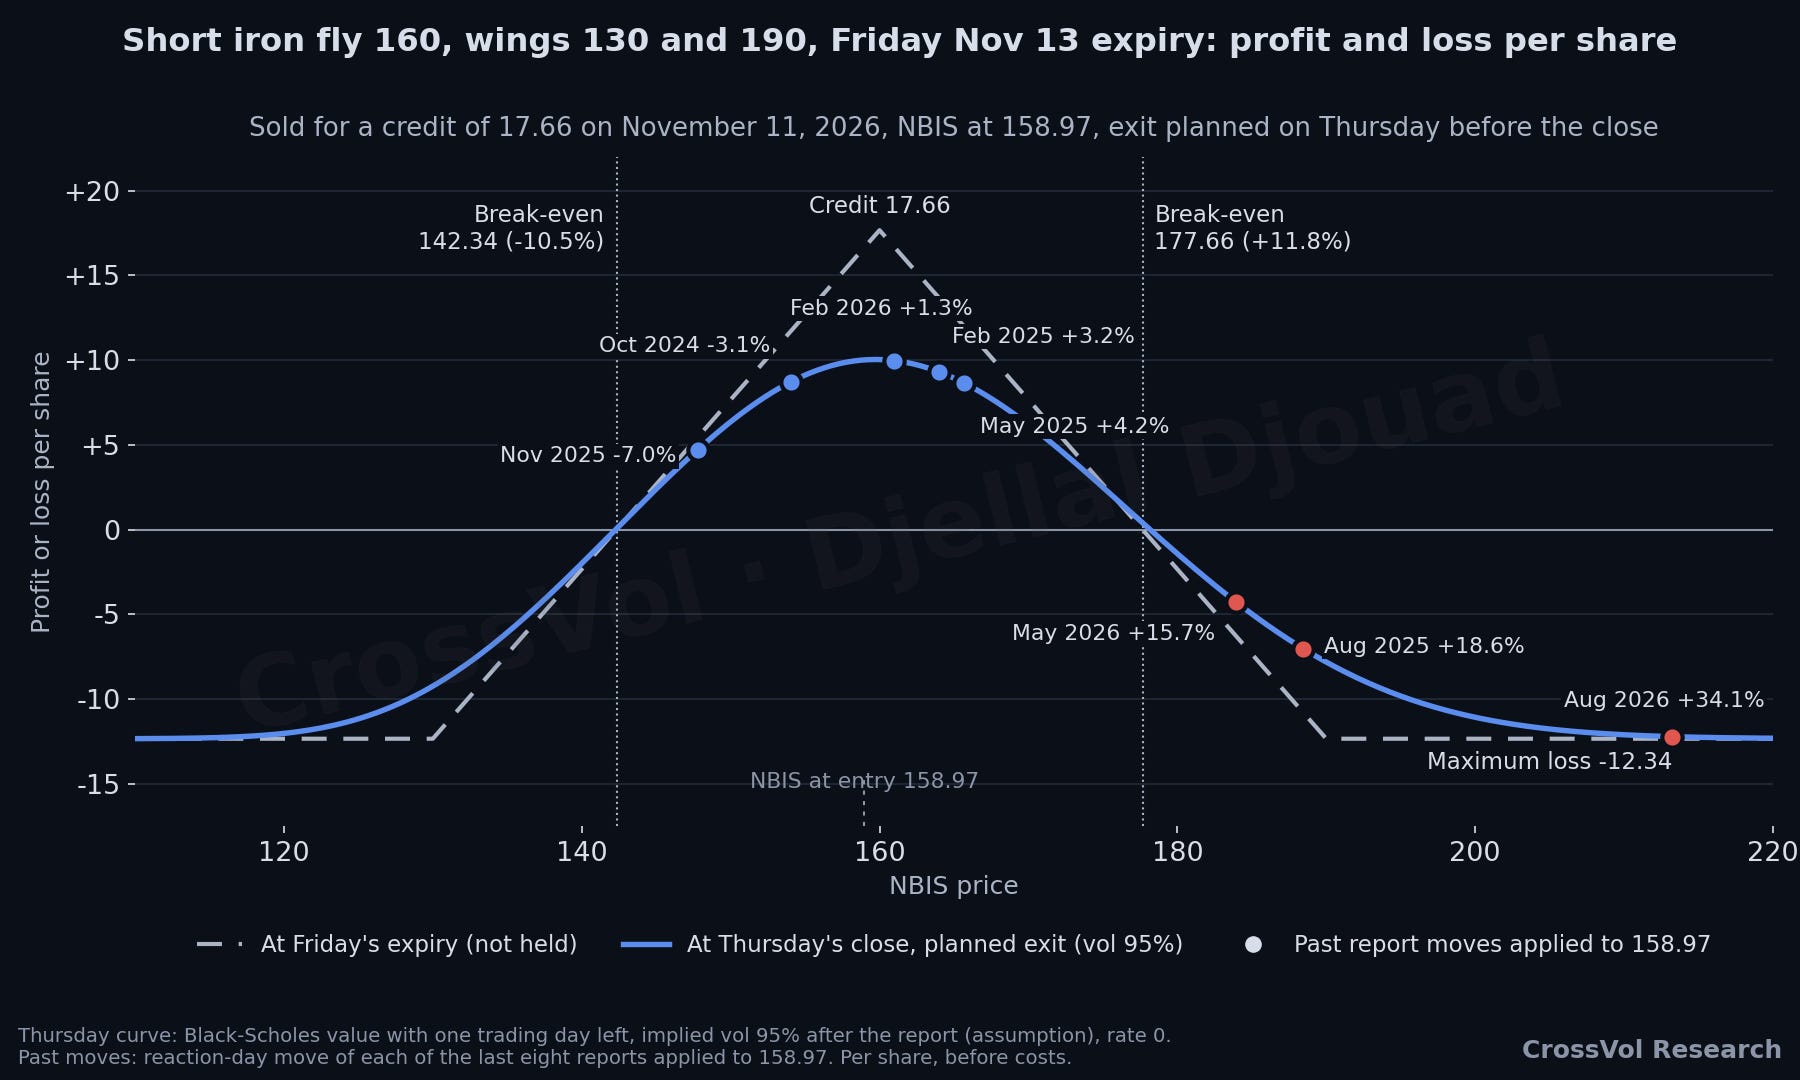
I sold the 160 iron fly expiring Friday, November 13: I sold the 160 call and the 160 put and bought the 130 put and the 190 call, for a credit of 17.66 per share, my fill (the replay above used mid prices). That is about 59% of the 30-point distance between the short strike and each wing. The maximum loss is 30 minus 17.66, or 12.34 per share, reached at expiry below 130 or above 190. The break-even points at expiry are 142.34 and 177.66, about 10.5% below and 11.8% above the entry price: almost exactly the priced move.
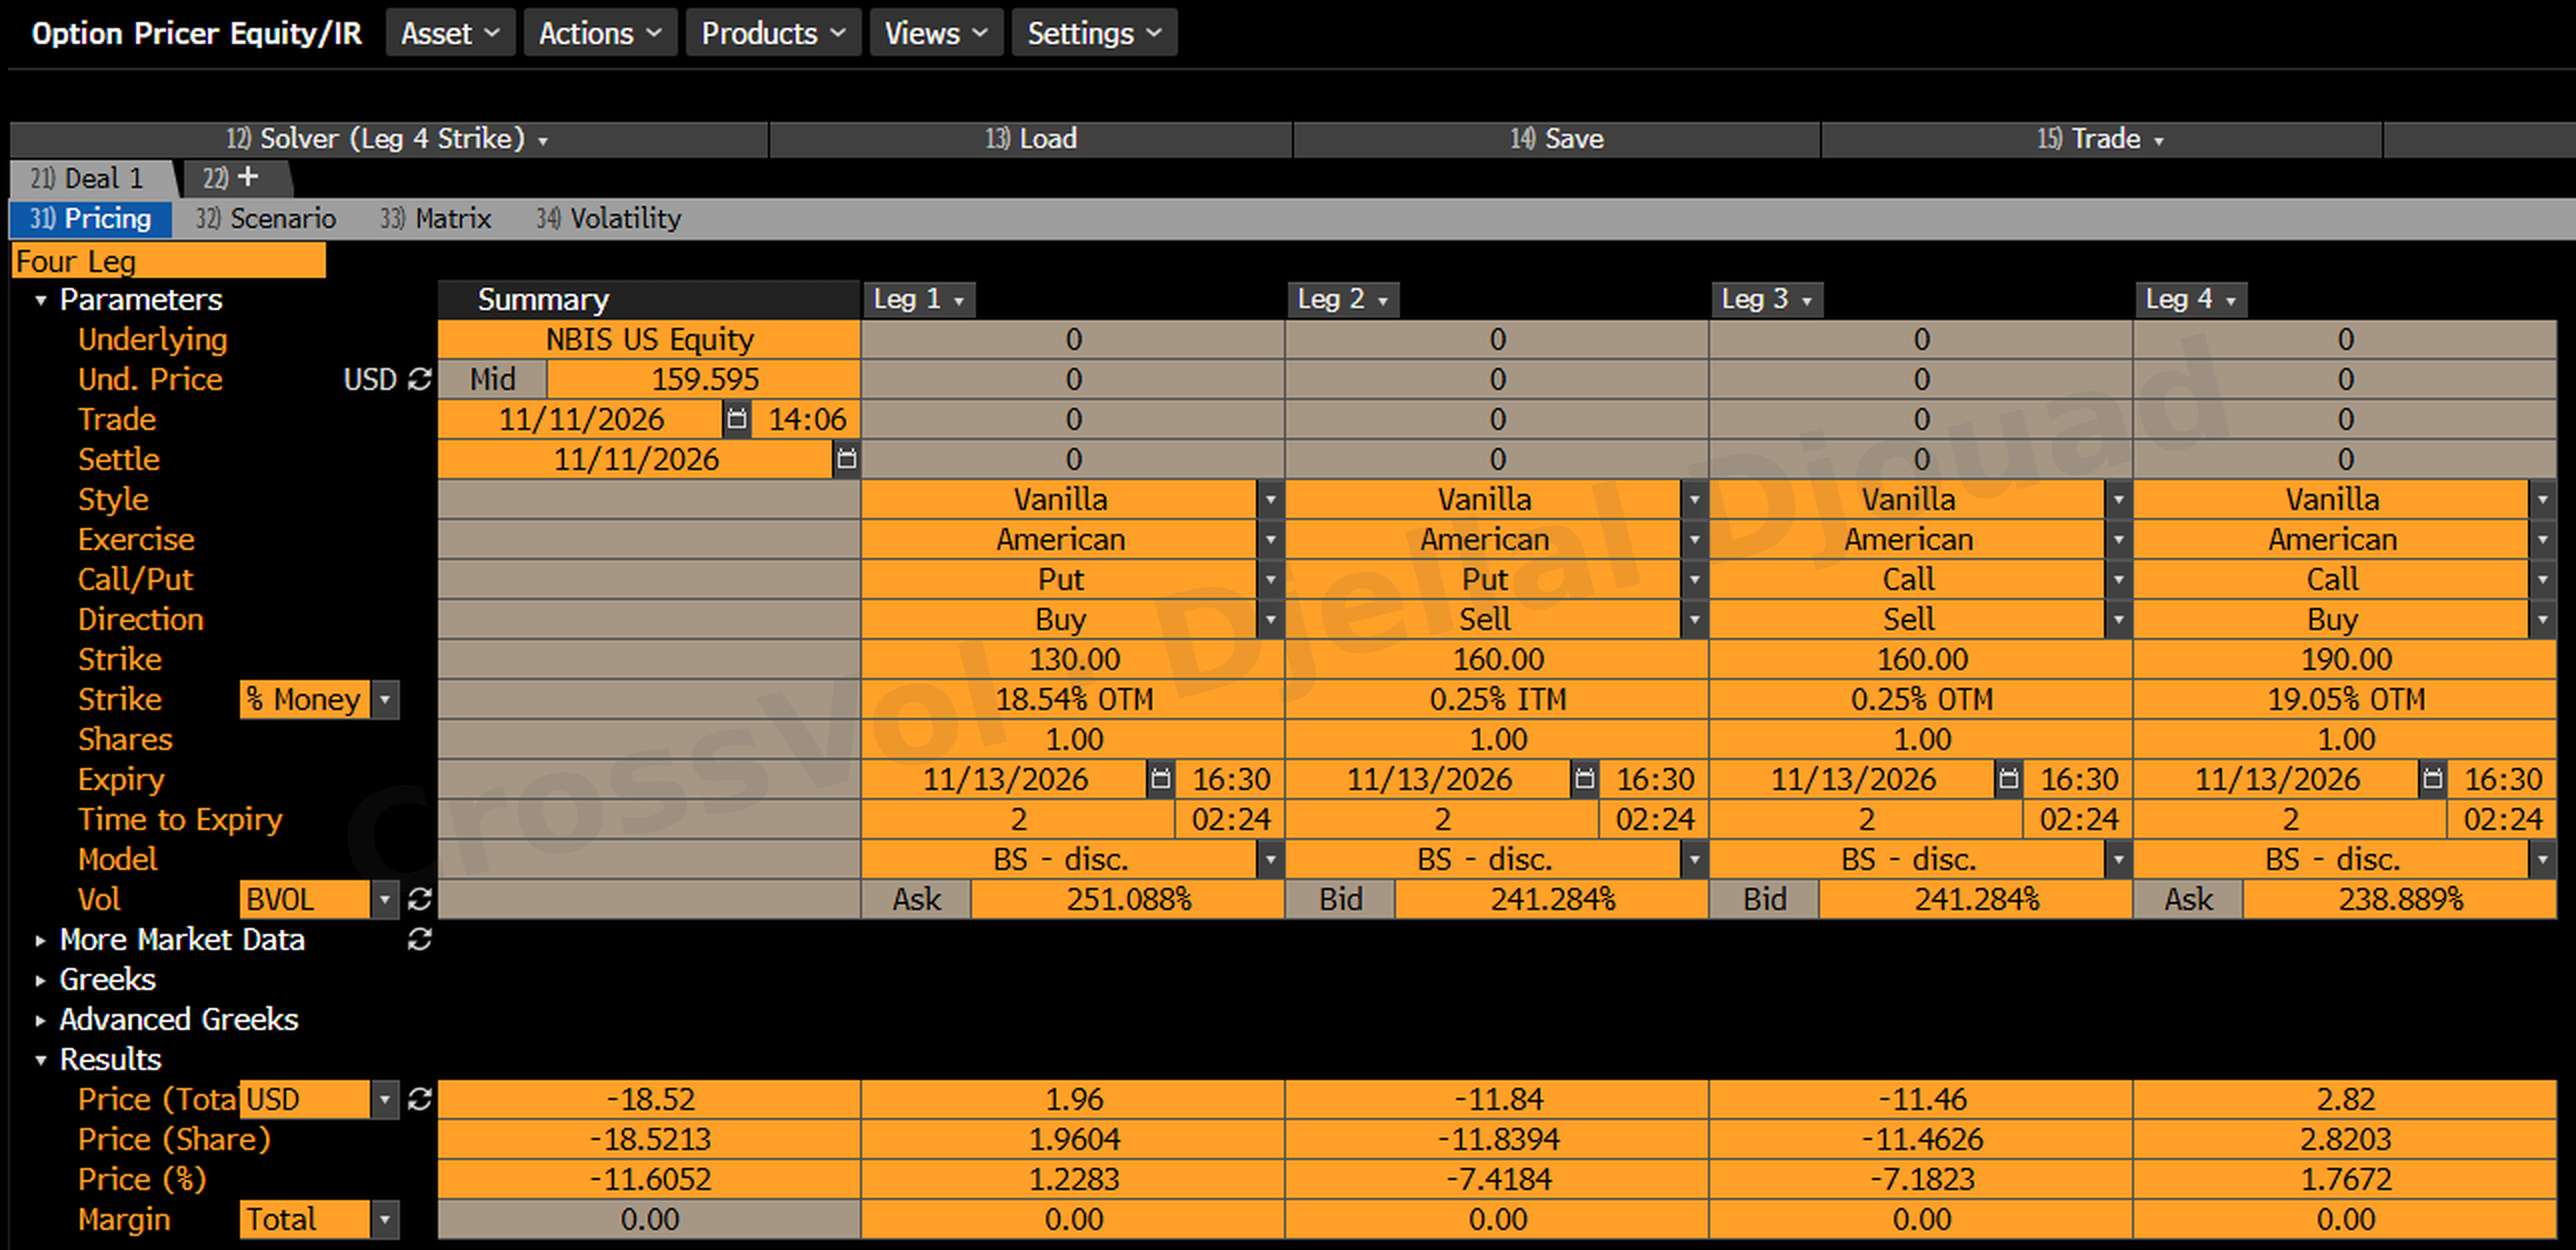
To check the price independently, here is the same structure in an option pricer at 2:06 p.m. New York time, with NBIS at 159.60, using the screen's volatilities: bid for the two options sold (about 241% on the 160 strikes), ask for the two bought. The credit read 18.52 per share, a little more than my 17.66 at 12:56 p.m., when I measured 221% at the money. An hour later the market paid slightly more for the same structure: my fill was one the market could give.
The exit was fixed before the entry. Nebius reports before the New York open on Thursday, with its call at 8:00 a.m. I keep the position through the release, because the premium I sold is the event premium, and it only collapses once the numbers are known. I buy the structure back on Thursday at about 3:25 p.m. New York, half an hour before the close, starting at the mid price and moving toward the market price until 3:57 p.m. at the latest. I will not hold it to Friday's expiry.
Why not at the open? The first hour after a report is the worst time to buy options back: spreads are at their widest, implied volatility is still being repriced and the stock is still looking for its level. The rest of Thursday also works for the seller, since a structure one day from expiry loses much of its remaining time value during the session if the stock stays in range. And Thursday's close is the exit I tested on the eight past reports. Why not on Friday? On expiry day the gamma of the 160 strike peaks, and a stock that ends near a short strike leaves you unsure which options will be exercised (pin risk). A second session is also a second chance for a big move: 16.1% on average over two days, against 10.9% on the first, on a stock that moved 10% or more on 33 days without a report over the past year. The risk I accept by staying until the afternoon is a move that keeps going during the session, since the structure loses when the stock moves; the 130 and 190 wings cap that loss.
If NBIS ends Thursday close to 158.97 and implied volatility falls to 95%, my pricing puts the gain at about 10 per share, not the full 17.66. The difference is Friday's time value, which I give up to avoid the expiry. The 95% is my assumption for implied volatility once the report is out, on a one-trading-day count; if it stayed at 130% instead, the gain would be about 7.3.
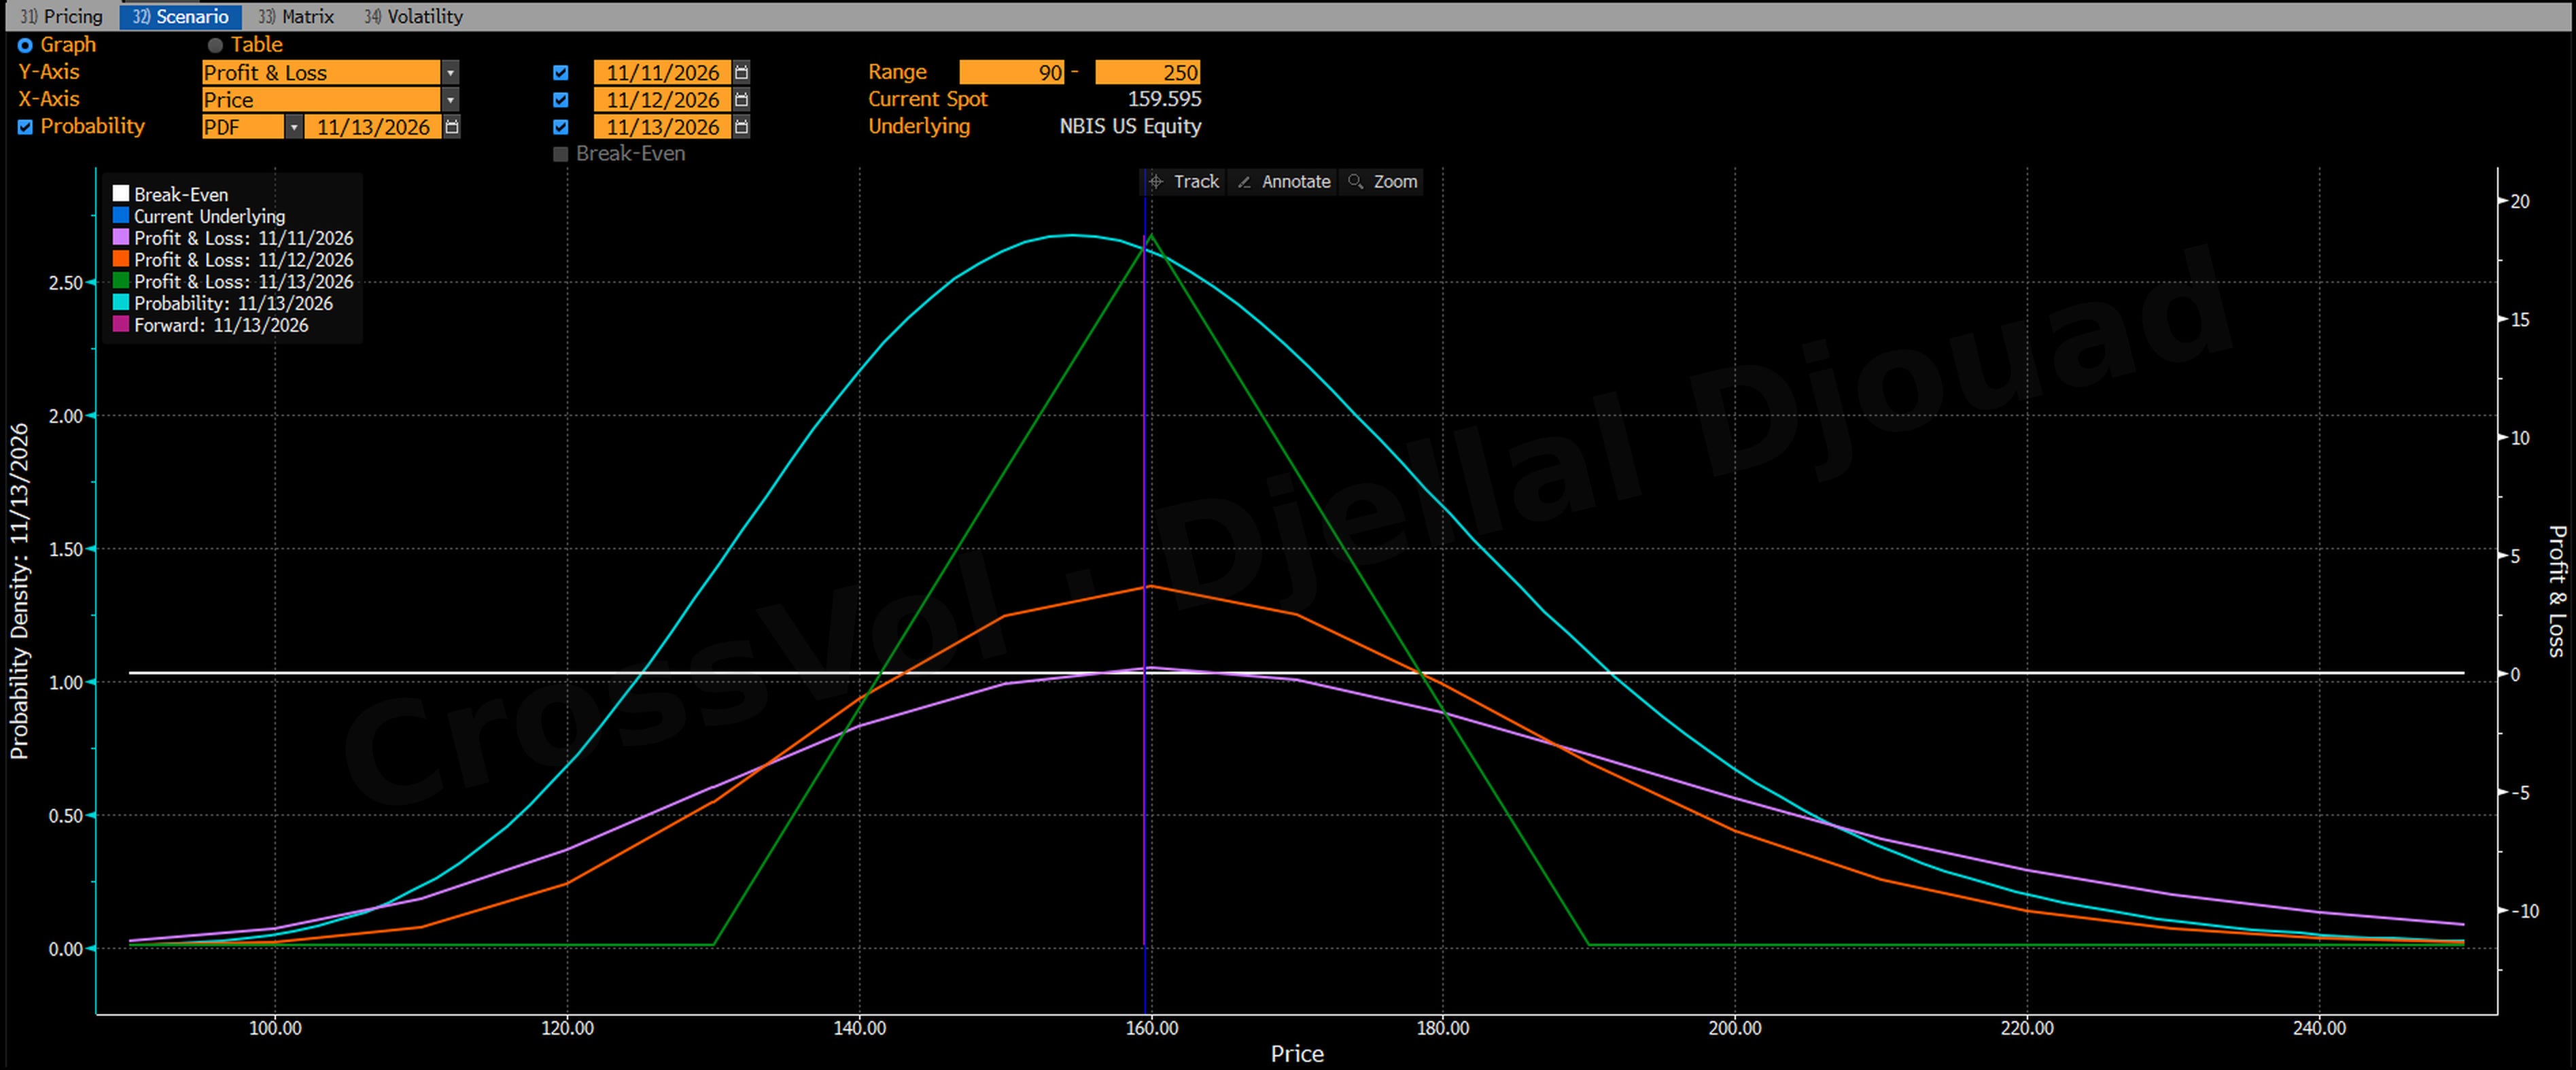
The pricer's scenario view draws the same structure's profit or loss for Wednesday, Thursday and Friday's expiry, along with the probability of each Friday price implied by option prices. Its Thursday curve keeps implied volatility at its current level, as if the report changed nothing, and starts from its own 18.52 credit: at 160 it shows a gain of only about 3.7 per share. My chart above assumes implied volatility falls to 95% after the report and starts from my 17.66 credit, which gives about 10. Apart from the 0.86 difference in credit, the gap between the two curves is the volatility drop the trade is selling.
What would prove me wrong?
A move beyond about 11.5%, like the +34.1% of August 2026. On this history, three reports out of eight would have lost money, the August 2026 move close to the maximum. The last two reports, both strong gains, could set the pattern again, and a stock that was up 18.6% on the day when I sold may be pricing good news, or not enough of it. A shock on CoreWeave's side, in its credit or its shares, would reach Nebius too, report or not. If implied volatility stays high after the report instead of falling to 95%, the gain at Thursday's close will be smaller. And if a median of 5.6% understates what Nebius now moves on a report, the thesis is wrong at its root.
Earnings trades are a repeated game. One result proves little either way. What matters is whether the price of the move keeps exceeding what the reports actually cost once the tail is capped. For another options case study built the same way, see my Brent options case study ahead of the midterms.
I will publish the full review of this trade after the exit on Thursday, profit or loss: the entry, the exit, what the report did to the stock and to implied volatility, and what the method got right or wrong.
This article is for educational purposes only. It is not investment advice and not a recommendation to buy or sell anything. Options and futures carry a high risk of loss, and leveraged products can lose more than the amount invested. Figures are as of November 11, 2026: 12:56 p.m. New York time for the trade, the close for the day's moves in the sector and for realized volatility, and the time given in each caption, unless stated otherwise.
Further reading
The Volatility Risk Premium Explained: Why Implied Beats Realized
Risk Reversal Skew Explained: Reading Put vs Call Implied Vol
AI Capex Cut: How a 20% Cut Could Tip the US Into Recession in 2027
How to cite: Djellal Djouad, CrossVol Research, "How to Trade Earnings With Options: My Nebius (NBIS) Earnings Trade, Step by Step", 11 November 2026. https://newsletter.crossvolresearch.com/p/how-to-trade-earnings-with-options-nebius-nbis
For a long time, I thought earnings trades were pure gambling, my portfolio has taken quite a few hits from them, and a part of me still feels that way. Also maybe because I really don't like the idea of relying on the accuracy of a CFO's forecast ;)
Thanks again for your crystal-clear explanation and transparency about your process and trades, it's very rare in this industry. I'm looking forward to seeing how this trade plays out!
A data-driven approach, just the way I like it. Thx