


By Djellal Djouad. November 14, 2026, data as of the November 13 close.
This article is for educational purposes only. It is not investment advice and not a recommendation to buy or sell anything. Levels are as of the dates and times given and can change quickly. Currencies, bonds, options and futures carry a high risk of loss, and leveraged products can lose more than the amount invested.
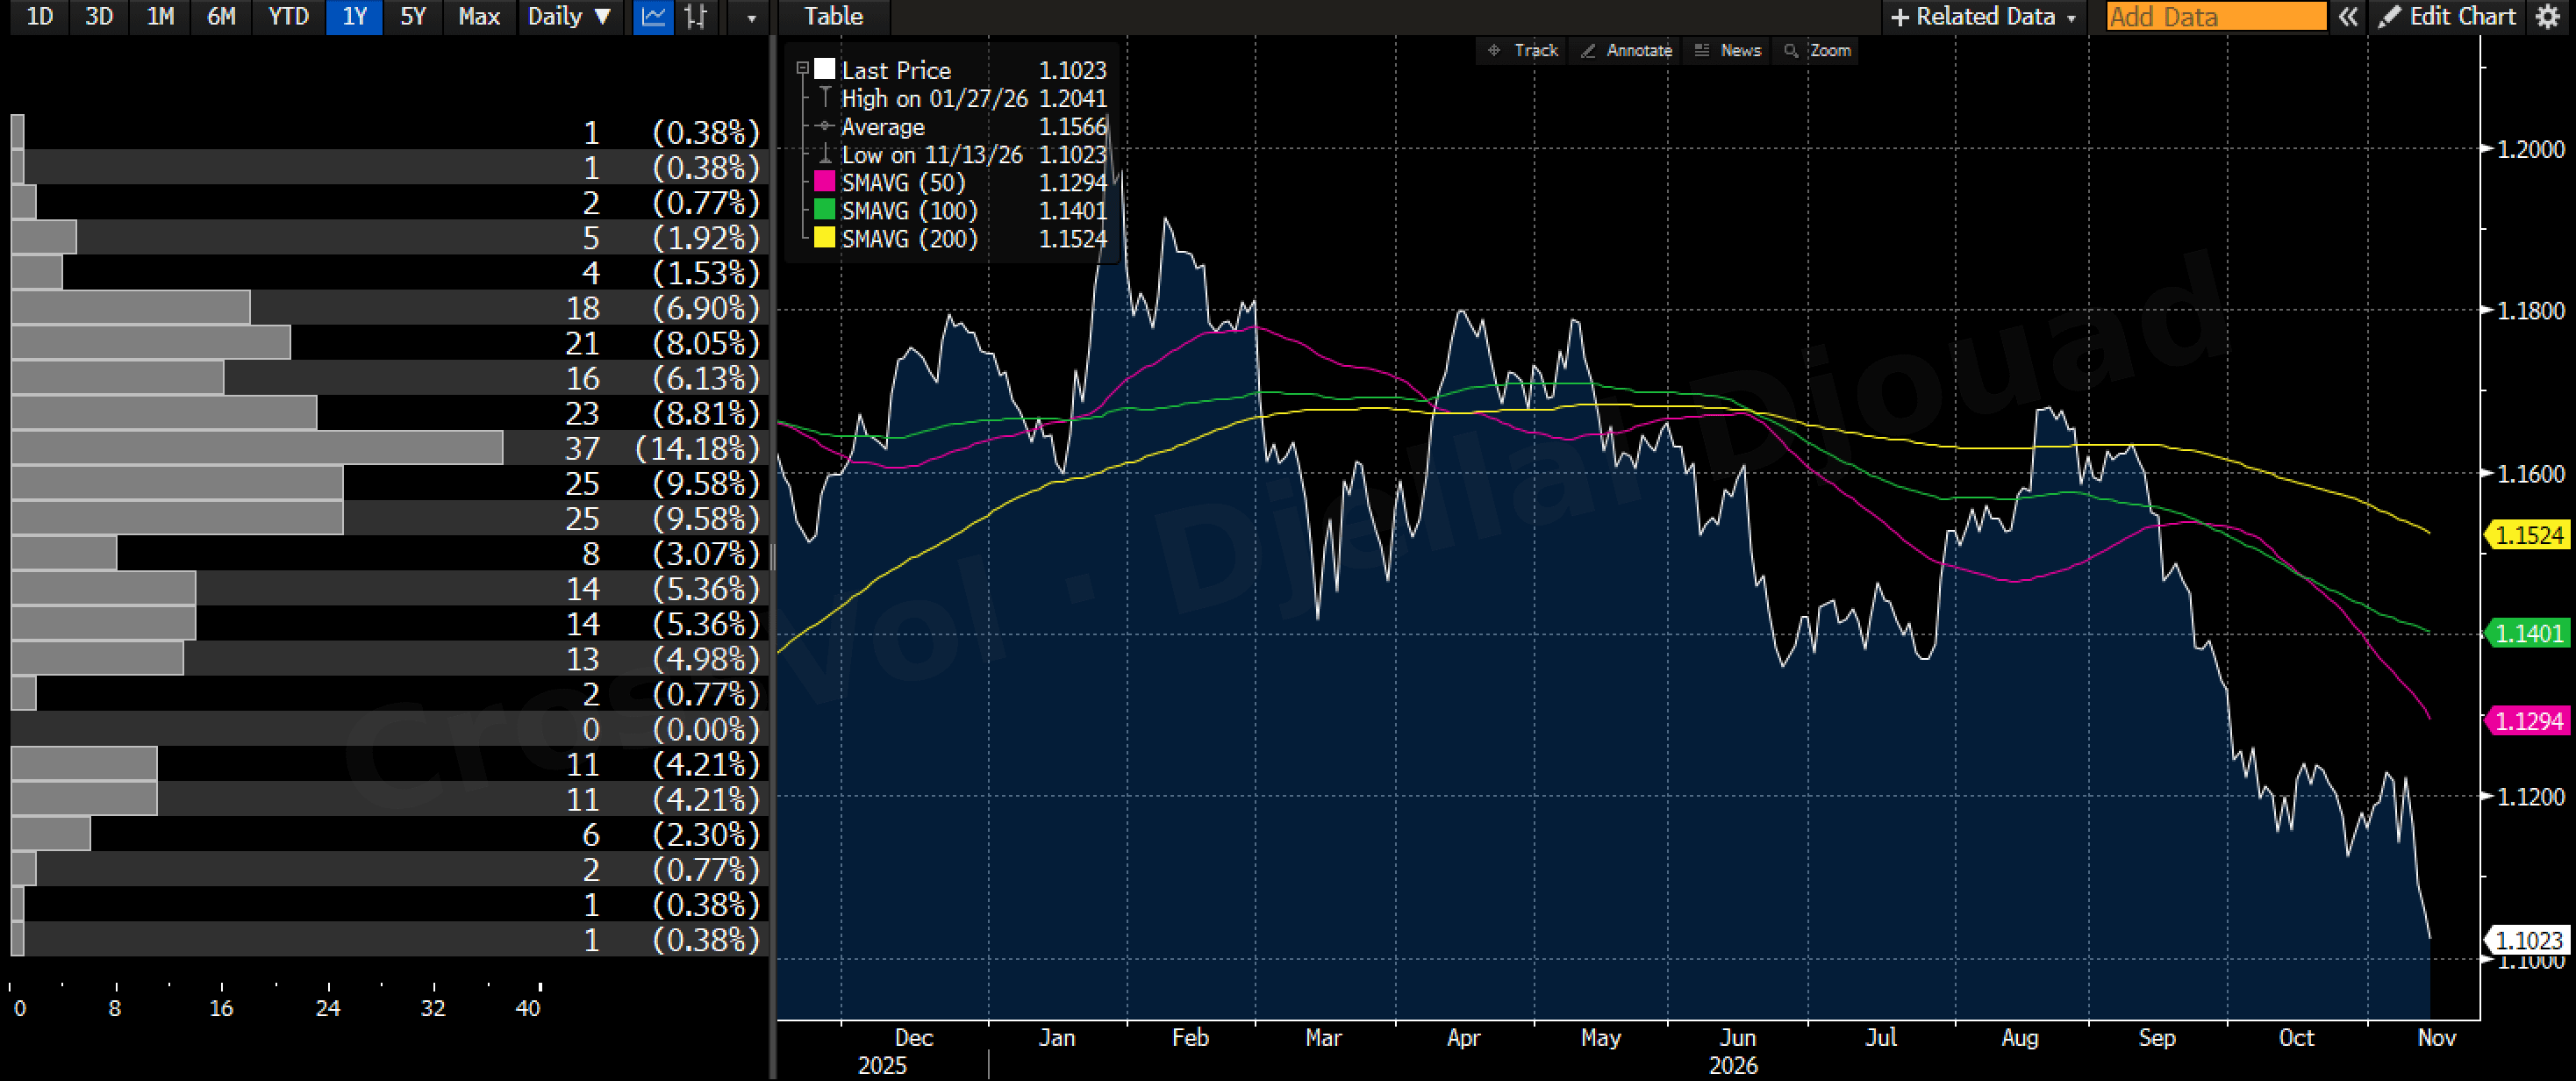
The euro closed Friday at $1.1023, its lowest close of the past year and the lowest since April 2025. It lost 1.08% on the week and 2.71% since September 30. Against the yen it barely moved: EUR/JPY lost 0.31% on the week and closed at 176.10, a little above where it stood when I last wrote about the euro, on October 31. And the options market barely reacted. One-month implied volatility on EUR/USD, the annualized size of the moves that options on the spot exchange rate price over the next month, ended the week at 6.10%, close to its one-year average of 5.80%.
My thesis, in four lines:
The euro keeps falling against the dollar. The Fed is out-hiking the ECB, France still pays more than Italy to borrow, European gas is back above €90 per megawatt hour, and funding stress among European banks, which peaked on November 5, has not normalized.
Against the yen, the fall resumes when Japan stops the yen's slide. The triggers are another intervention near 160, a Bank of Japan hike on December 18 and, above all, funding stress among Tokyo banks, which I expect to rise.
FX volatility has not woken up yet, and if it does, it could hurt the euro and lift the yen. Options are not expensive, even with a Fed, an ECB and a Bank of Japan meeting within nine days.
December decides. A crowded short is not a squeeze. It takes a catalyst: a Fed that seriously tempers expectations of further hikes while the ECB revises its own upward, or peace in Ukraine or an end to the Iran war. The outcome is binary, so I would trade it with option spreads on EUR/USD, EUR/JPY and USD/JPY.
What played out since October 31, and what did not
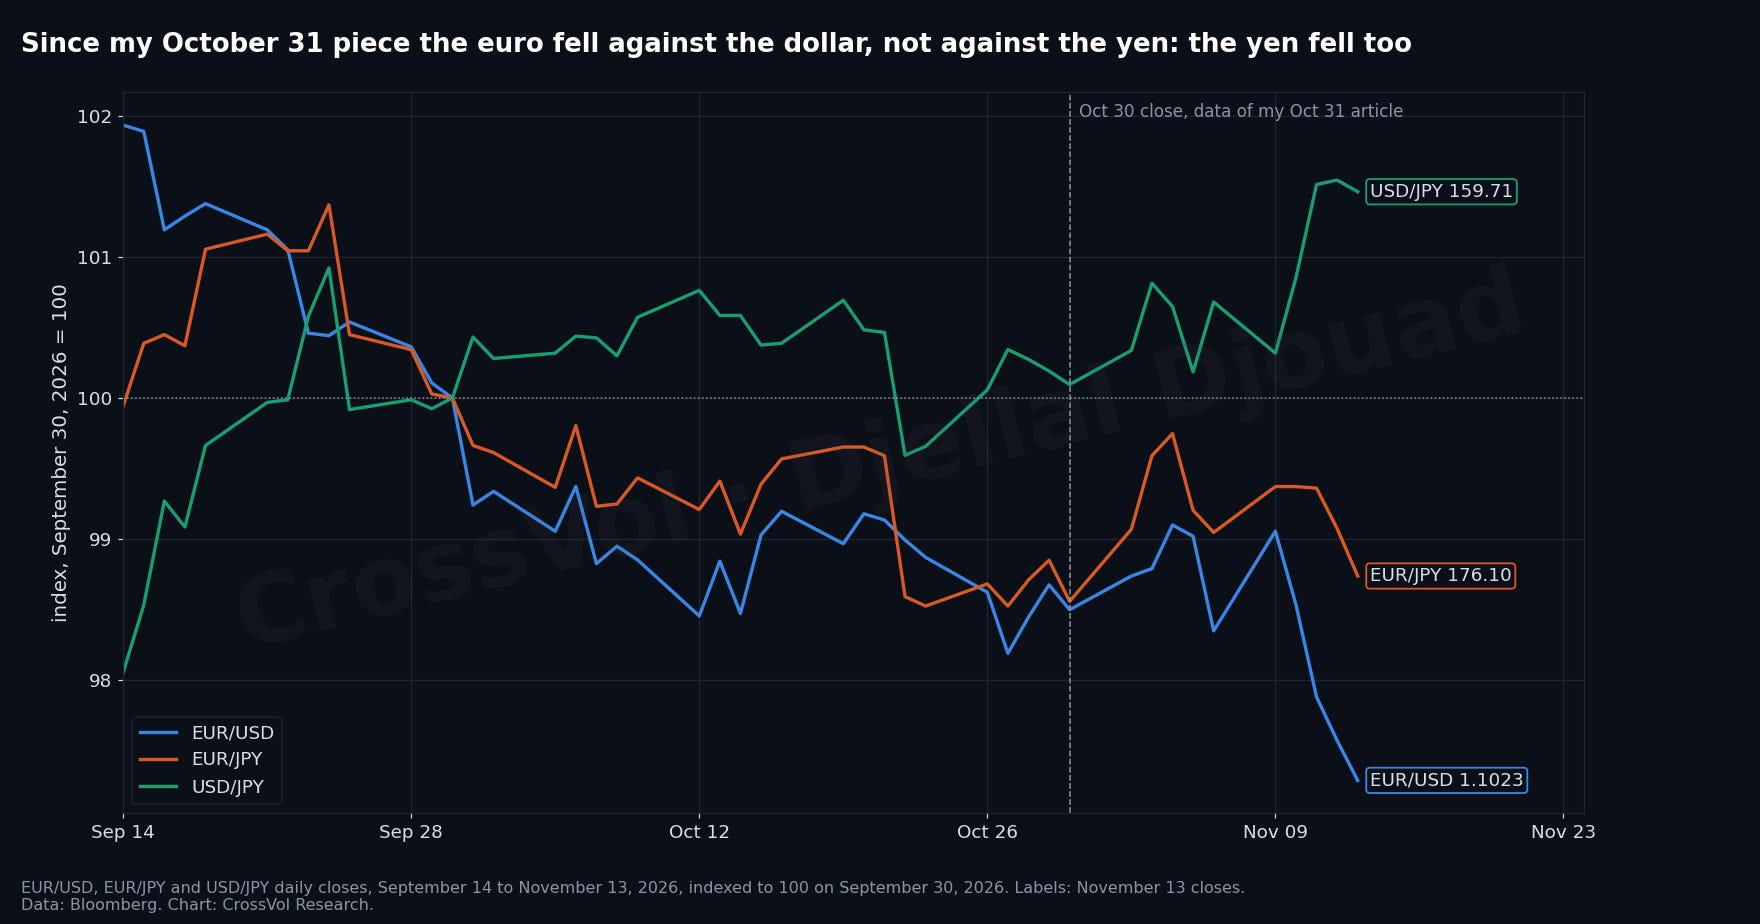
On October 31, in Why the Euro Is Falling Against the Yen: French Stress Has Reached Dollar Funding, I wrote: "The euro will keep falling, and mostly against the yen." The first half played out. The second, "mostly against the yen", did not. Since the October 30 close, EUR/USD is down 1.23%, from 1.1160 to 1.1023. EUR/JPY is up 0.18%, from 175.78 to 176.10.
The reason is the dollar. The same repricing of the Fed that pushed the euro down also pushed the yen down: USD/JPY rose from 157.56 to 159.71. The arithmetic is simple. EUR/JPY is EUR/USD multiplied by USD/JPY. This week the euro lost 1.08% against the dollar while USD/JPY gained 0.78%, so EUR/JPY lost only 0.31%. For EUR/JPY to fall in earnest, USD/JPY has to stop rising.
One of the levels I gave on October 31 was broken, briefly: the OAT-Bund spread closed below 150 bp for three sessions, then came back (details below). The other levels held. EUR/JPY has not closed above its 50-day moving average, 179.30 then and 177.78 now, which would have made me step aside. The one-year low of 175.72, set on October 23, still holds. And my marker for options, a one-month EUR/USD risk reversal (the gap, in volatility points, between options that pay if the euro rises and options that pay if it falls) back below minus 1, has not been reached: it stood at minus 0.52 on Friday.
Why the euro keeps falling against the dollar
The Fed is out-hiking the ECB
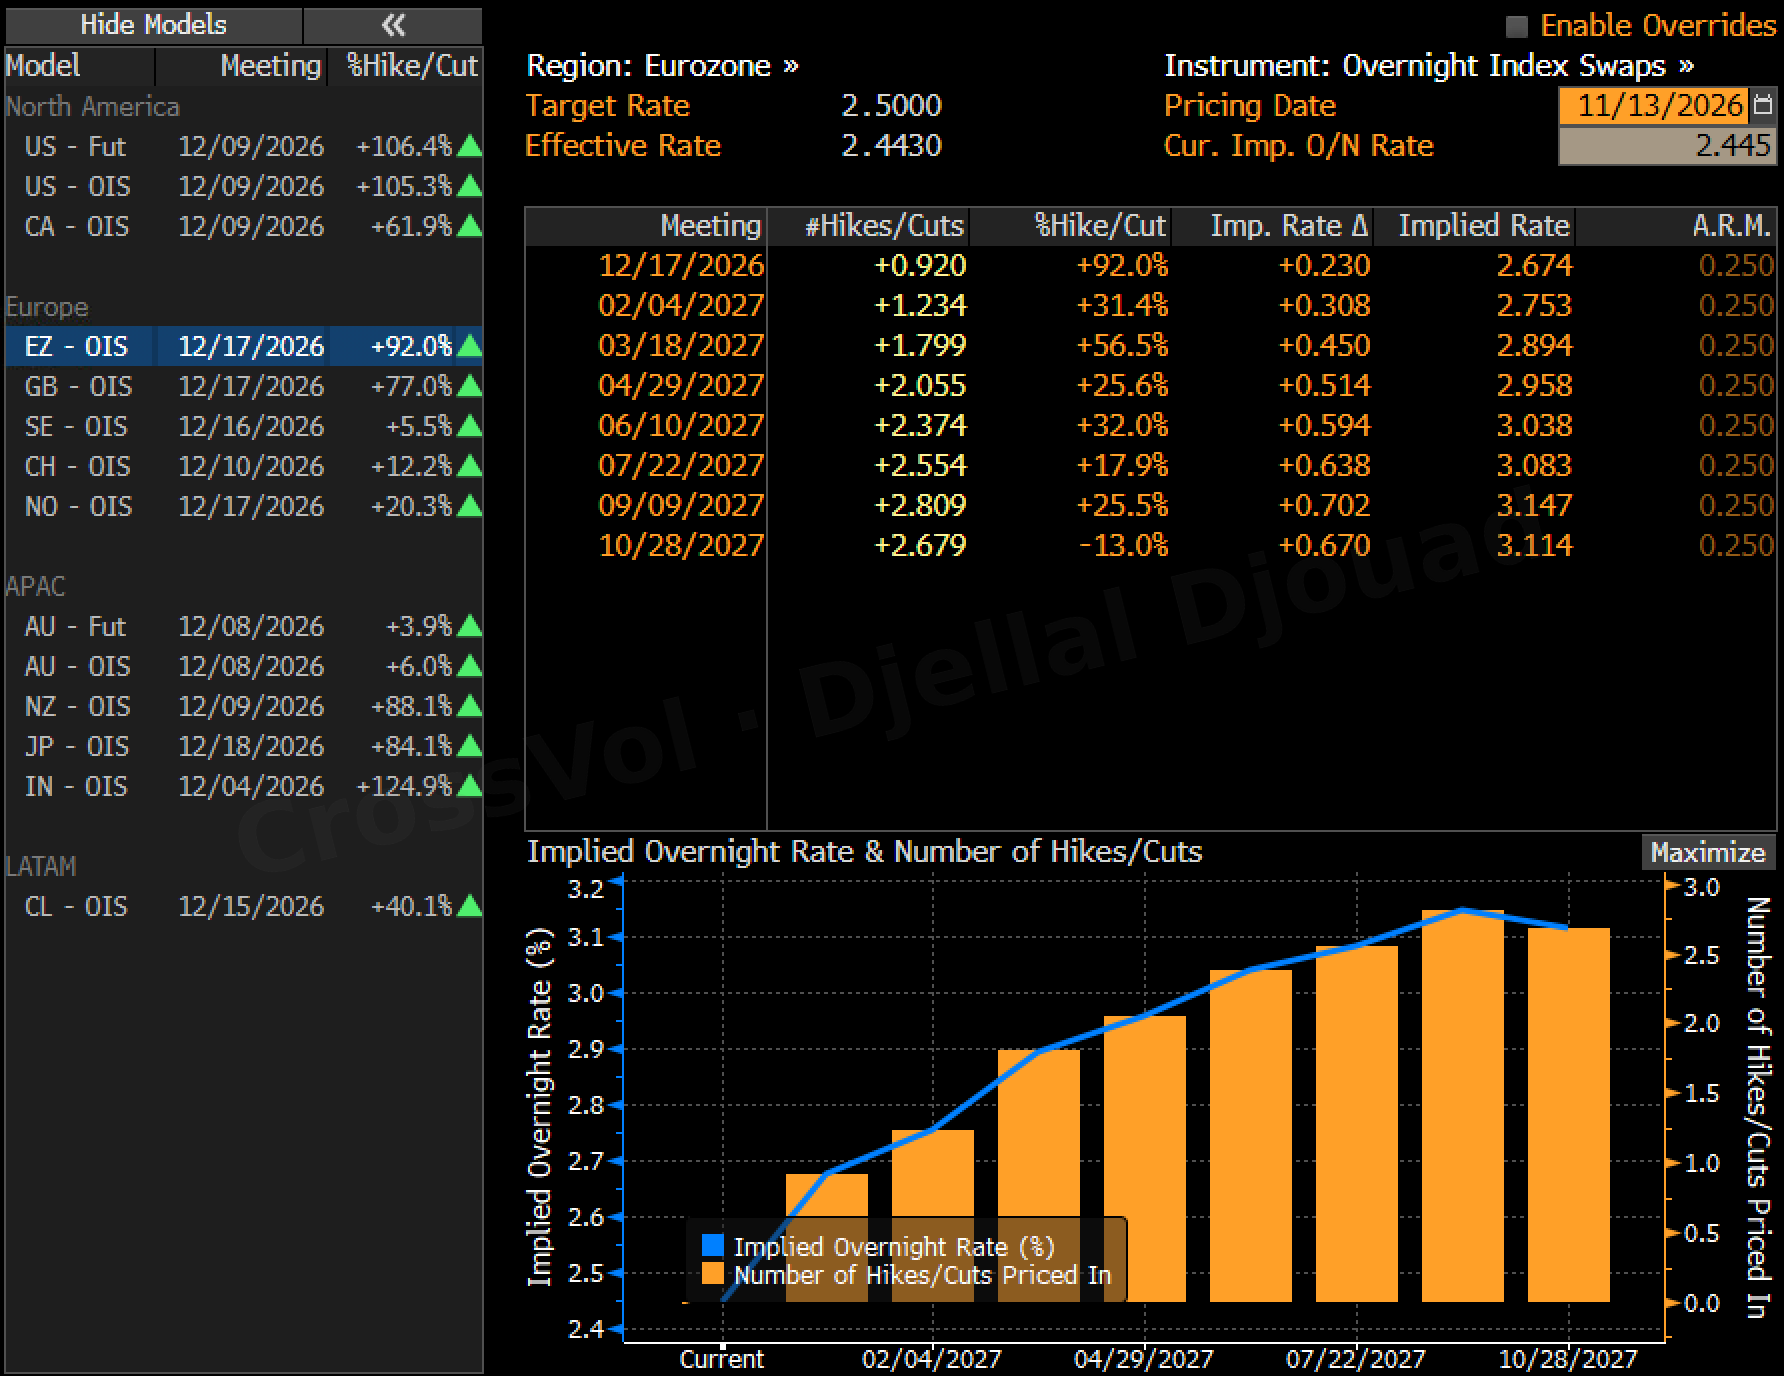
Both central banks are expected to raise rates in December, so the euro can fall even with the ECB turning hawkish: what matters is which one hikes faster. Fed funds futures price a hike on December 9 at 106.4%, more than one full quarter point, as I noted in today's weekly recap, Stock Market Next Week: No Santa Rally Before the Fed. Swaps on the euro overnight rate price an ECB hike on December 17 at 92%, from a deposit rate of 2.50%.
What moves a currency is the gap between the two. This week the US 2-year Treasury yield rose 33 bp (basis points, hundredths of a percentage point), to 4.84%. The German 2-year yield rose 13 bp, to 3.13%. The gap widened 20 bp this week, to 171.6 bp. Fed funds futures price a peak of 4.76%, from an effective fed funds rate of 3.88% today: the dollar keeps the higher yield and the faster path.
The ECB is hiking into an energy shock, not a boom. Euro area inflation reached 4.0% in October, the highest since 2023, with energy prices up 20.8% in a year, while core inflation held at 2.5%. The euro area grew 0.4% in the third quarter, but the French economy shrank 0.1%, according to Eurostat. All 71 economists polled by Reuters expect a hike to 2.75% on December 17, but 46 of them see it as the last one. Euro swaps price about 2.8 hikes by September 2027, to 3.15%. If the economists are right, euro swaps price almost two hikes too many, and the rate gap would widen further in the dollar's favor. One more source of doubt: Christine Lagarde will leave the ECB on February 7, 2027, before the end of her term.
France still pays more than Italy
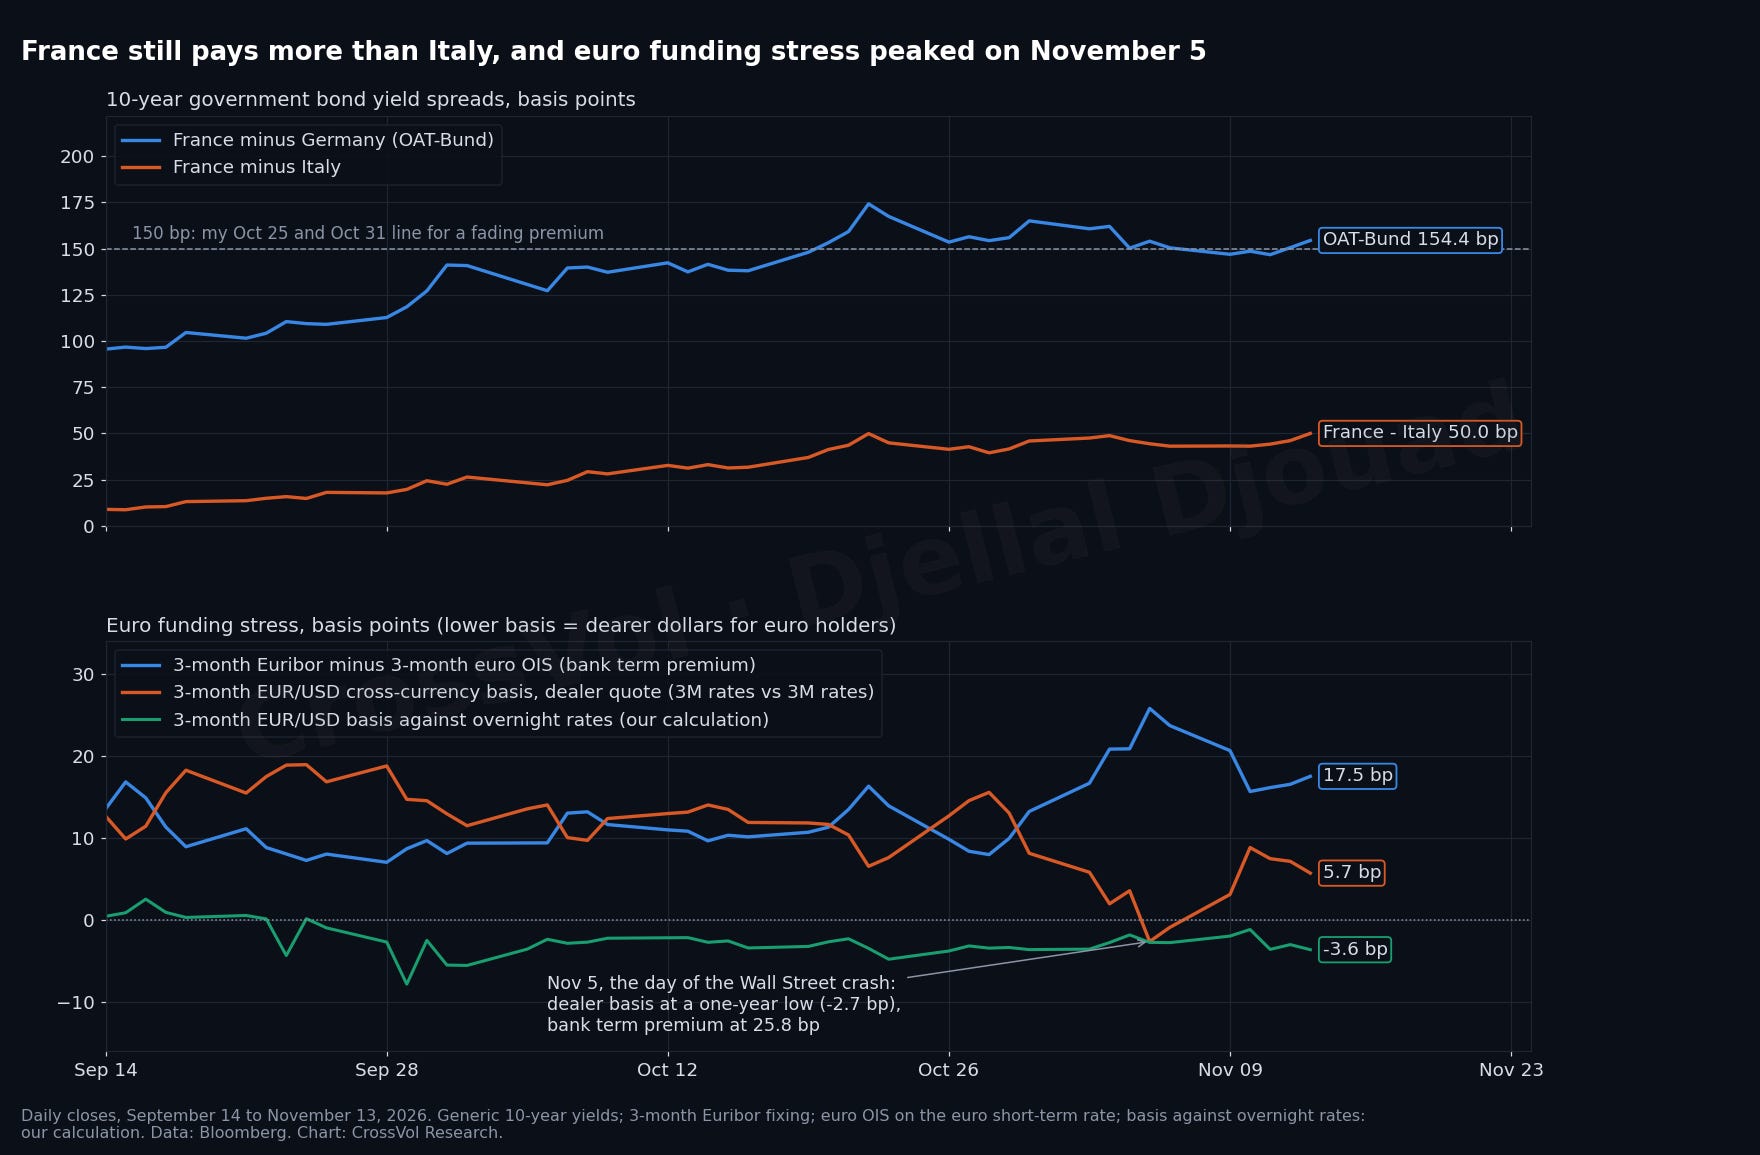
The cleanest measure of French risk is the OAT-Bund spread, the extra yield France pays over Germany on 10-year debt (The OAT-Bund Spread Explained). It closed Friday at 154.4 bp. That is down from 174.2 bp at the close of October 22 (178 bp during that session, the figure in my October 25 piece) and 165.0 bp on October 30. On October 25, in France Bond Crisis: The OAT-Bund Spread Hits 178 bp and France Now Pays More Than Italy and Greece, I wrote that a close back below 150 bp would mean the political premium was leaking out. The spread did close below that line, on November 9, 10 and 11, at 146.7 bp at the lowest. Then it turned back up: 150.5 bp on November 12, and 3.9 bp wider on Friday. The leak was short-lived.
The relative stress has kept growing. France now pays 50.0 bp more than Italy for 10-year money, against 45.9 bp on October 30 and 24.4 bp at the end of September. Insurance against a French default, the 5-year credit default swap, costs 88.5 bp a year, 25.6 bp more than for Italy. It peaked at 103.2 bp on October 23 and was 69.3 bp on September 30.
In Paris, the National Assembly rejected the revenue side of the 2027 budget unanimously on November 4, so the Senate is working from the government's original text, and Prime Minister Sébastien Lecornu is looking for a compromise. Parliament has until December 17, the day of the ECB meeting, after which the budget can be enacted by ordinance. The ECB will not do the job for him: its chief economist, Philip Lane, said on November 10 that French bond trouble must be fixed in Paris. On November 11, Moody's cut its forecast for French growth in 2026 to 0.2%.
Political risk is spreading beyond France
France is not the only capital under pressure.
Spain votes on November 29. Pedro Sánchez called a snap election after parliament rejected his housing decrees on October 2, and polls give the conservative Popular Party and the far-right Vox a path to power.
Germany. Friedrich Merz's coalition is fighting over its 2027 budget with a majority of about a dozen seats, after months of infighting that led the federal president to step in between the partners in early October.
Italy. The 2027 budget is the last before a general election next year. The coalition partners are pulling in different directions, and polls put the two blocs within a point of each other.
Italy still pays less than France to borrow: its 10-year spread over Germany is 104.4 bp. But the list of elections and budget fights in the four largest euro economies is getting longer just as the ECB tightens.
Gas is back above €90
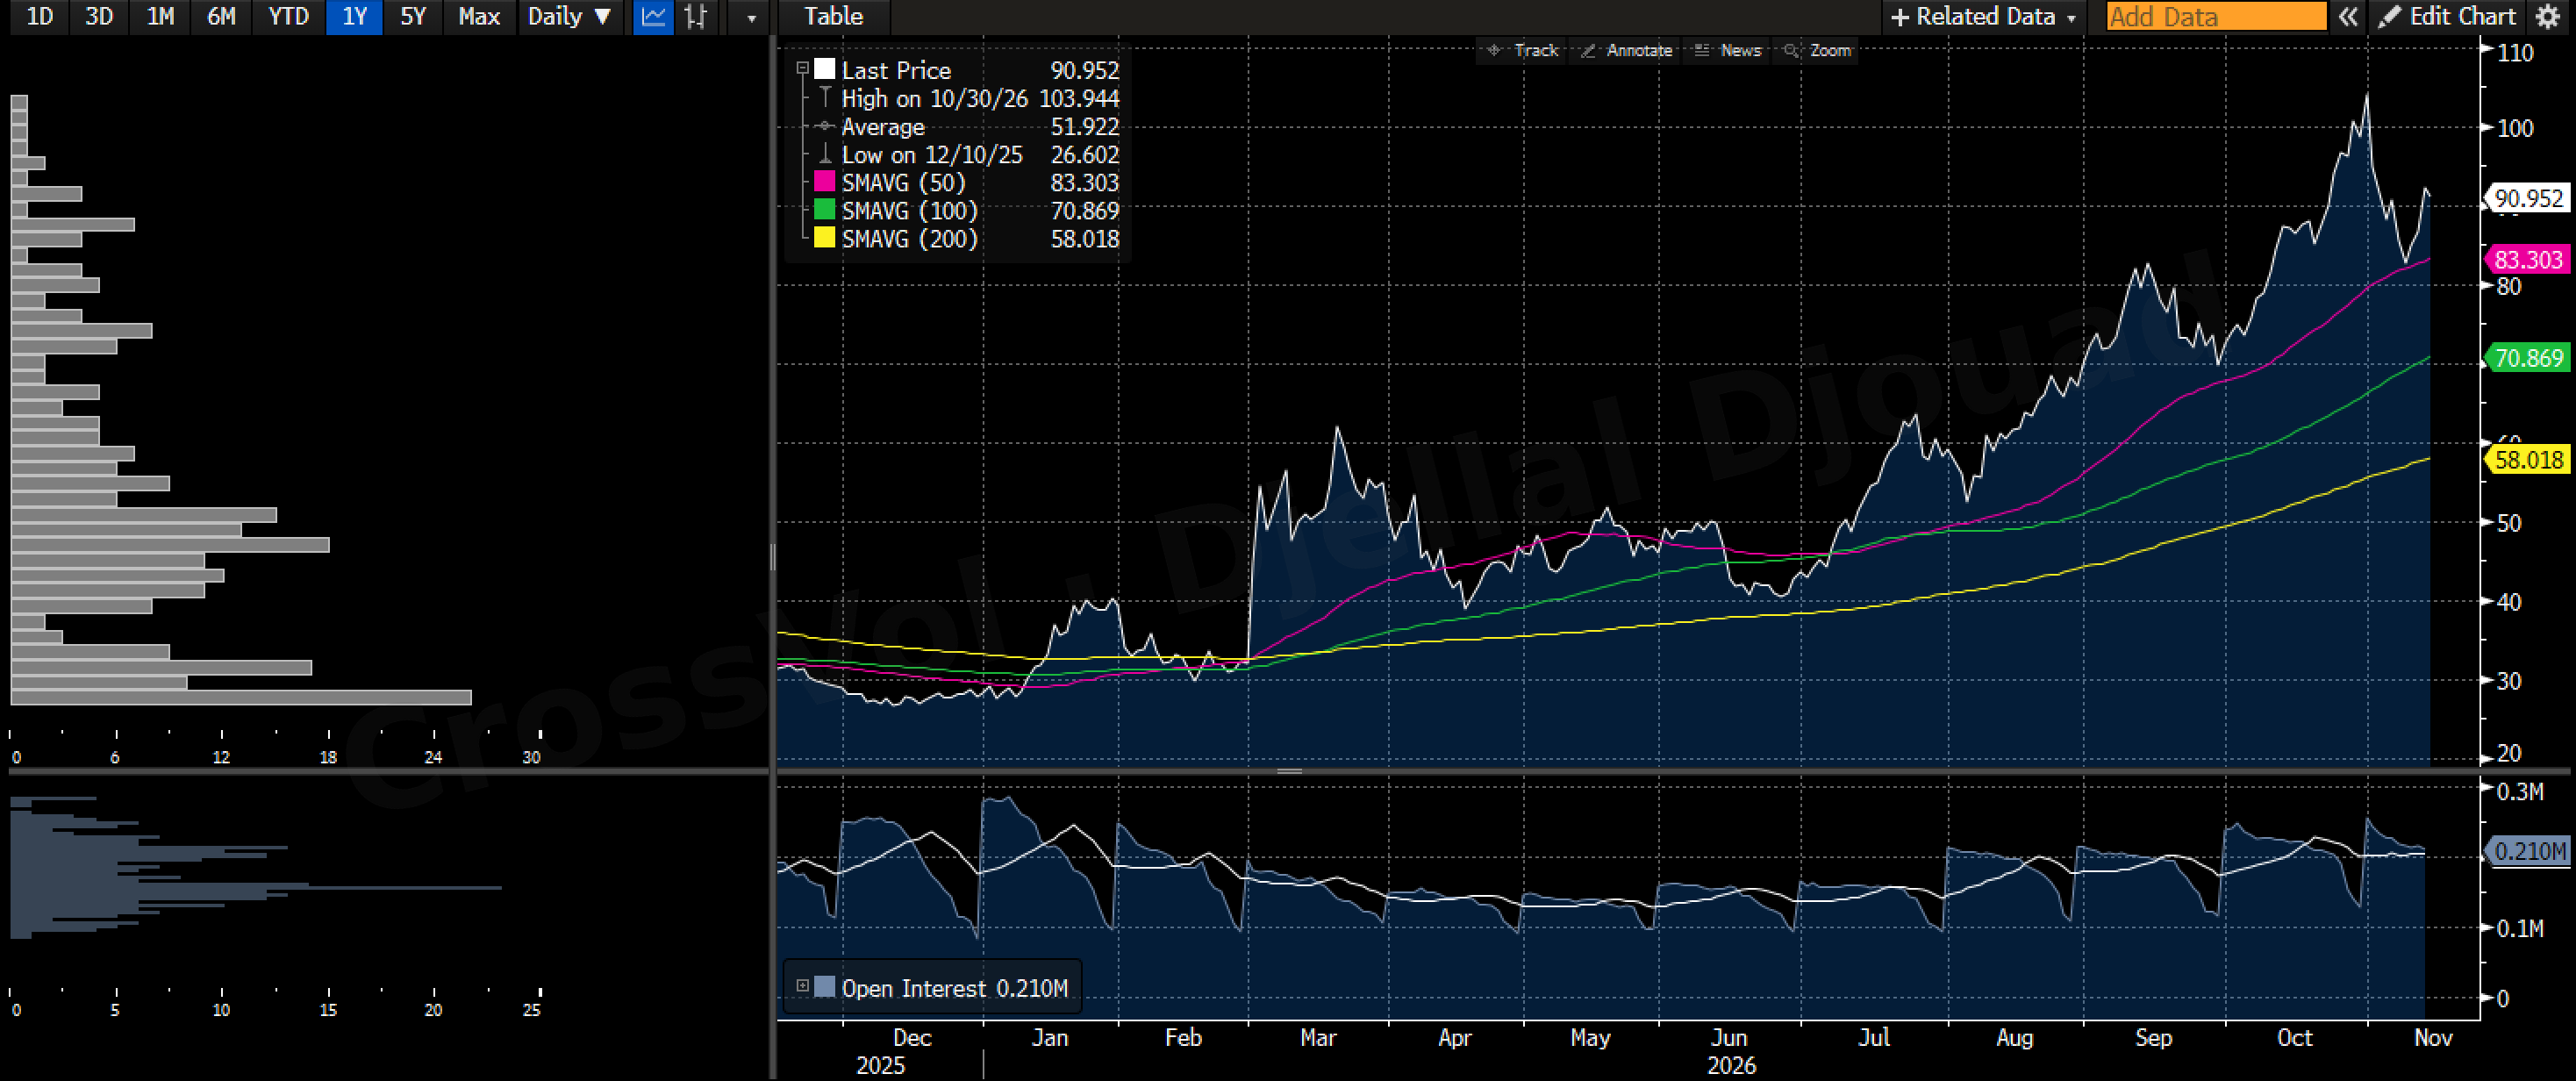
The front-month Dutch TTF contract, Europe's gas benchmark, settled at €90.95 per megawatt hour on Friday, up 6.3% on the week. It was €26.60 on December 10, 2025. The front month peaked at €103.94 on October 30, the first day the December contract became the front month, so partly a roll effect. The forward curve prices this winter at about €89 on average from January to March 2027, against about €68 for next summer, a winter premium of about €21.
Storage is the weak point. EU storage sites were about 72% full in the latest data, some 17 points below the five-year norm for the date, down from 74.6% on November 1 and against 82.9% at the end of October last year. With withdrawals accelerating in the cold, inventories are expected to fall toward a near record low by the end of winter.
Europe imports most of its gas. A gas shock is a transfer of income from European buyers to foreign sellers, and the currency pays for it. Goldman Sachs's publicly reported base case for early 2027 sits below what the curve now prices, but the bank also flagged a path toward €150 in a cold winter with scarce liquefied natural gas.
Algeria: a new energy front for France
The dispute between Paris and Algiers has moved to energy and trade.
Fertilizer. According to a Reuters report of October 23, Algeria told its urea producers to stop selling to France, without any formal announcement, and Algiers denied any restriction. French farm and fertilizer groups say that puts about 30% of France's urea imports at risk, at a time when Gulf supplies are already strained by the Iran war.
Brussels. On November 13, France asked the European Commission to examine whether Algeria is breaching its association agreement with the EU, which allows countermeasures.
Italy and Spain move the other way. Giorgia Meloni went to Algiers in March to secure more gas, and Madrid agreed the same month to deepen its energy partnership with Algeria. Algerian liquefied natural gas shipments to Spain reached a three-year high in October.
Algeria is one of southern Europe's main pipeline suppliers. Europe is split on how to deal with it, and France is the one left out. That is one more weight on the euro, and on French assets first.
Euro funding: the stress peaked on November 5
The cross-currency basis measures how much more, or less, it costs a European to get dollars by swapping euros instead of borrowing them directly. When it falls, dollars get dearer for euro holders; below zero, they carry a premium. I explained it on October 31.
November 5, the day of the Wall Street crash, gave the clearest signal yet, and it came from the euro side. The dealer quote of the 3-month EUR/USD basis, set against 3-month Euribor, fell to minus 2.7 bp, its lowest in a year (14.5 bp at the end of September), before recovering to 5.7 bp by Friday. Most of that drop came from Euribor itself, which jumped that day. The measure I used on October 31, the basis against overnight rates, the closest to a pure dollar premium, made no new low: minus 2.8 bp on November 5 and minus 3.6 bp on Friday, as on October 30, against minus 4.8 bp on October 23.
Euribor, the rate at which European banks lend to each other for three months, is where the stress showed. Its gap over the 3-month euro overnight swap rate reached 25.8 bp on November 5, when Euribor hit its highest level in a year, 2.812%. It was 17.5 bp on Friday, against 13.2 bp on October 30 and 9.6 bp on September 30. The funding stress peaked with the crash, eased, and has not gone back to where it was in September.
Who is short the euro, and why it matters
In the weekly report of the Commodity Futures Trading Commission (CFTC), two groups matter: asset managers, the slow real money, and leveraged funds, mostly hedge funds.
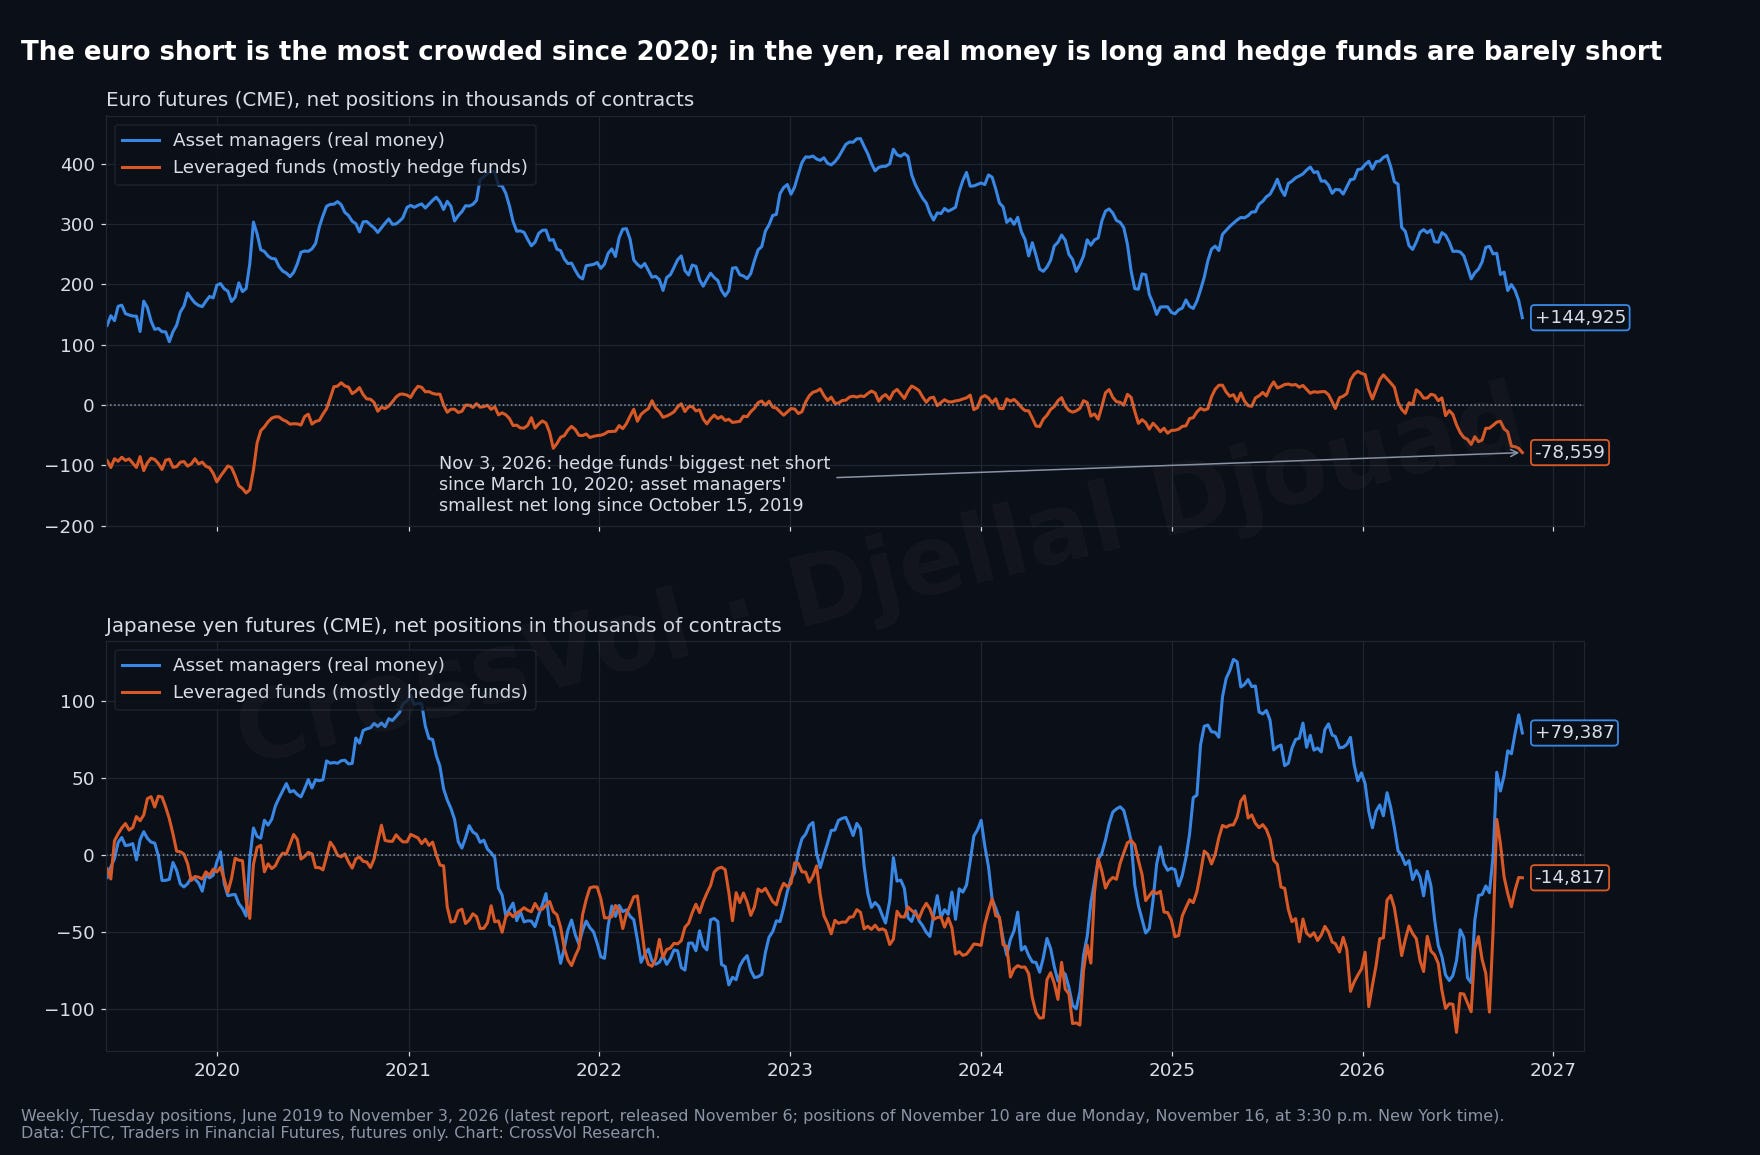
On November 3, the date of the latest report, leveraged funds held a net short of 78,559 euro futures contracts, after adding to it six weeks in a row: their biggest net short since March 10, 2020. Asset managers held a net long of 144,925 contracts, their smallest since October 15, 2019. They have cut it three weeks in a row, and by 42% since September 15, when it stood at 251,698. The euro has fallen from 1.1193 to 1.1023 since that report, so the short has probably grown. The next report, for positions on November 10, comes out on Monday, November 16, at 3:30 p.m. New York time, delayed by the Veterans Day holiday.
The CFTC's older and broader classification, non-commercial traders, covers speculators as a whole. On November 3 they held a net short of 157,791 euro futures contracts, the largest since January 2016, and their gross short, 387,174 contracts, was the largest in the CFTC's records. Hedge funds and speculators at large are short at multi-year extremes, and asset managers hold their smallest long since 2019: all three are moving the same way, which is rare. It built slowly: hedge funds were still net long the euro in mid-February, after its peak of 1.2041 on January 27, and they have been net short every week since June 9.
The selling went on this week: on November 11 and 12, open interest, the number of euro futures contracts outstanding, rose while the euro fell, the signature of fresh selling rather than longs leaving. On our data, trend-following funds are already fully short the euro and fully long the dollar. They have little left to sell if the euro keeps sliding, but they would have to buy if it bounced. The rates gap fuels the trend, and the positioning would make any bounce sharp. But a crowded short is not a squeeze in waiting: it takes a catalyst, and I see two (see below).
The yen is the mirror image. Asset managers held a net long of 79,387 yen futures contracts on November 3, nearly double the 41,629 they held on September 22. Leveraged funds held a net short of only 14,817, after covering more than half of their short since October 13. There is little yen short left to squeeze, so a yen rally needs a trigger rather than positioning. The risk runs the other way too: real money is long the yen and losing money as USD/JPY nears 160, and a break above it without intervention could force some of it out.
FX volatility is still asleep
Every option figure in this piece refers to FX options on the spot exchange rate, traded over the counter between banks, funds and companies, not to options on currency futures listed on exchanges. Their strikes are spot levels.
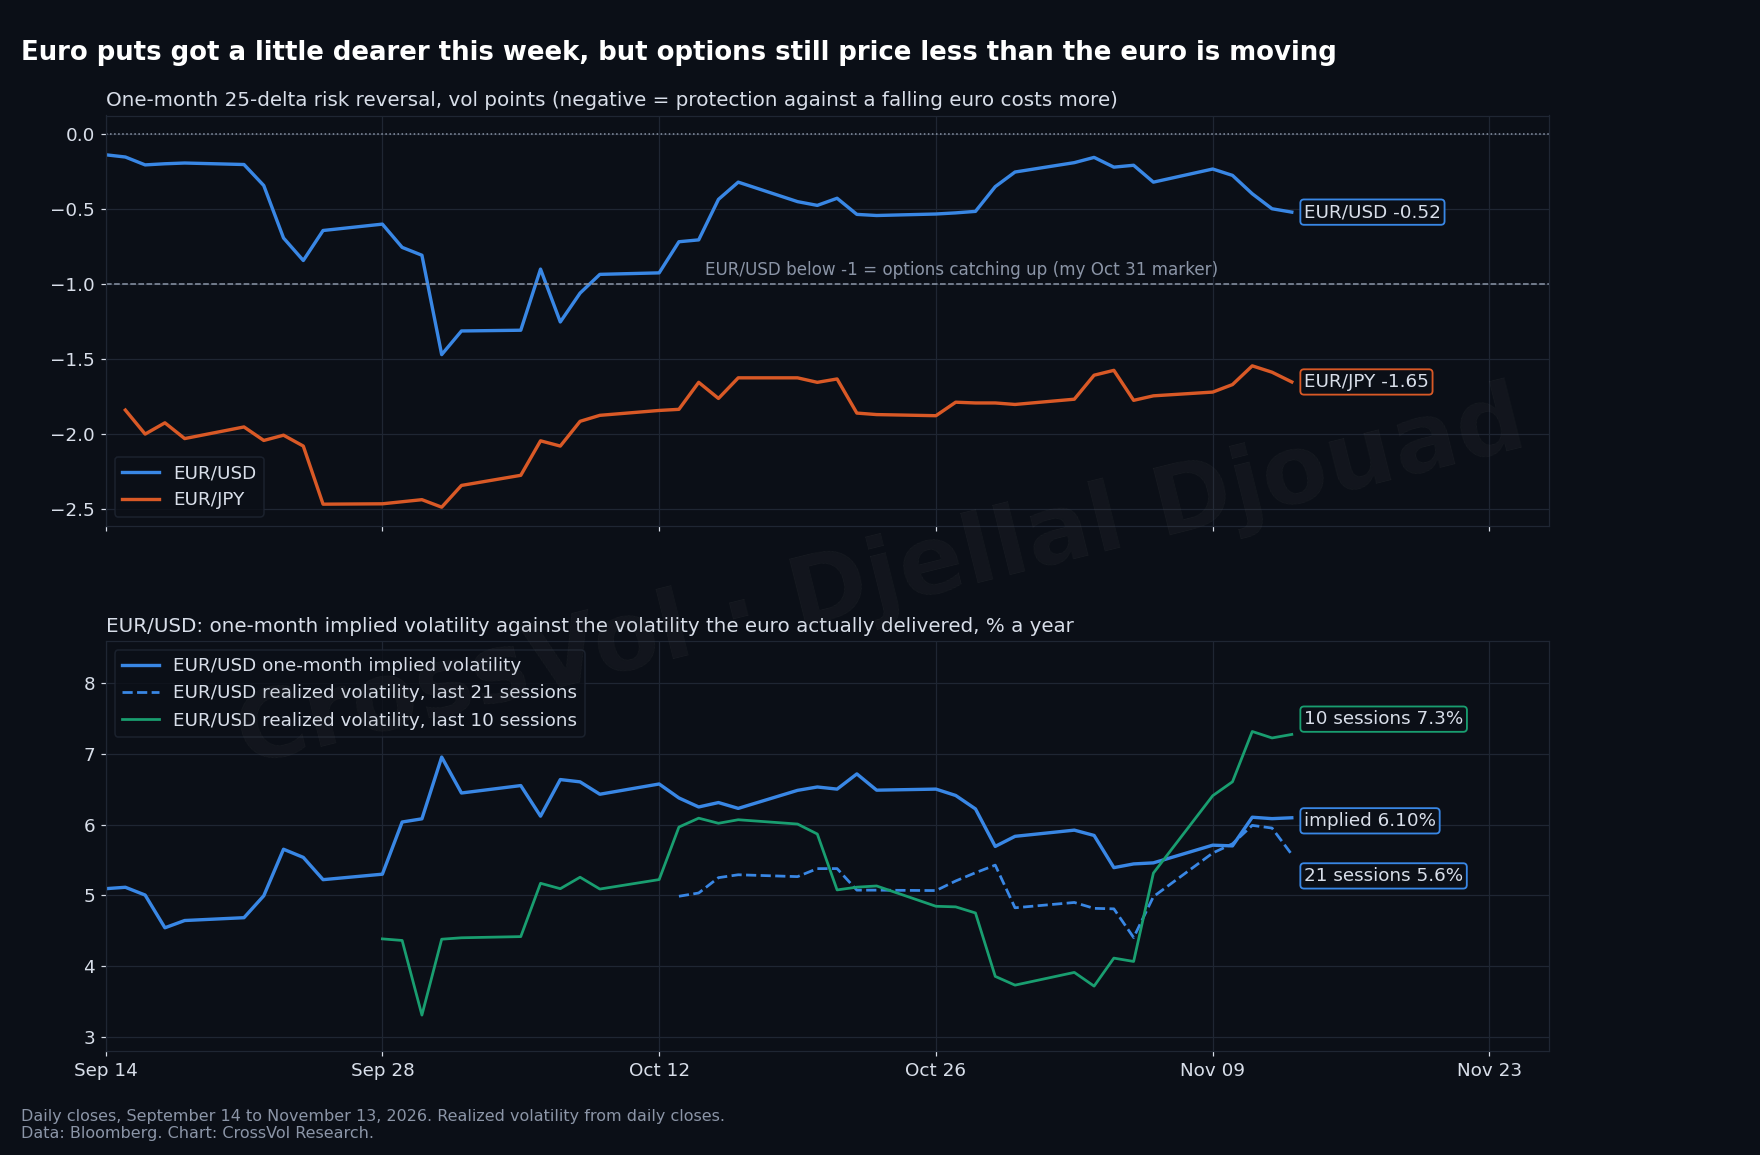
Implied volatility is what options charge for expected moves; realized volatility is what the market actually delivered. One-month EUR/USD implied volatility is 6.10%. It rose 0.64 point this week, from 5.46%, but it sits barely above its one-year average of 5.80% and far below its high of 9.21% on January 27. Over the last 10 sessions the euro moved at an annualized 7.3%, faster than its options price; over 21 sessions, 5.6%, a little slower. At 6.10%, a one-month straddle, a call and a put at today's price, prices a move of about 1.4% either way, about 1.5 US cents.
The skew, the extra price of protection on one side, moved a little. A risk reversal compares the implied volatility of two options equally far from the current price, one that pays if the euro rises and one that pays if it falls (Risk Reversal Skew Explained); negative means protection against a falling euro costs more. The one-month EUR/USD risk reversal went from minus 0.25 on October 30 to minus 0.52 on Friday. On October 1, the day the OAT-Bund spread jumped 14 bp, it reached minus 1.47. Euro puts got a little dearer this week, nothing more.
Against the yen, protection against a falling euro is structurally expensive: the one-month EUR/JPY risk reversal is minus 1.65 and has not been positive once in a year. Yet implied volatility is below its one-year average on both EUR/JPY (7.00%) and USD/JPY (7.13%). One detail stands out: the EUR/JPY butterfly, the extra price of options far from the current level against those close to it, is near its one-year high. The market is paying for a large move in the cross, in either direction.
The part of the EUR/USD curve that stands out is six months out, a tenor that now covers France's presidential election next spring. Six-month implied volatility is 6.59%, about 0.45 point above its one-year average, against 6.10% at one and three months, and its risk reversal, minus 0.78, leans further toward euro puts than the one-month.
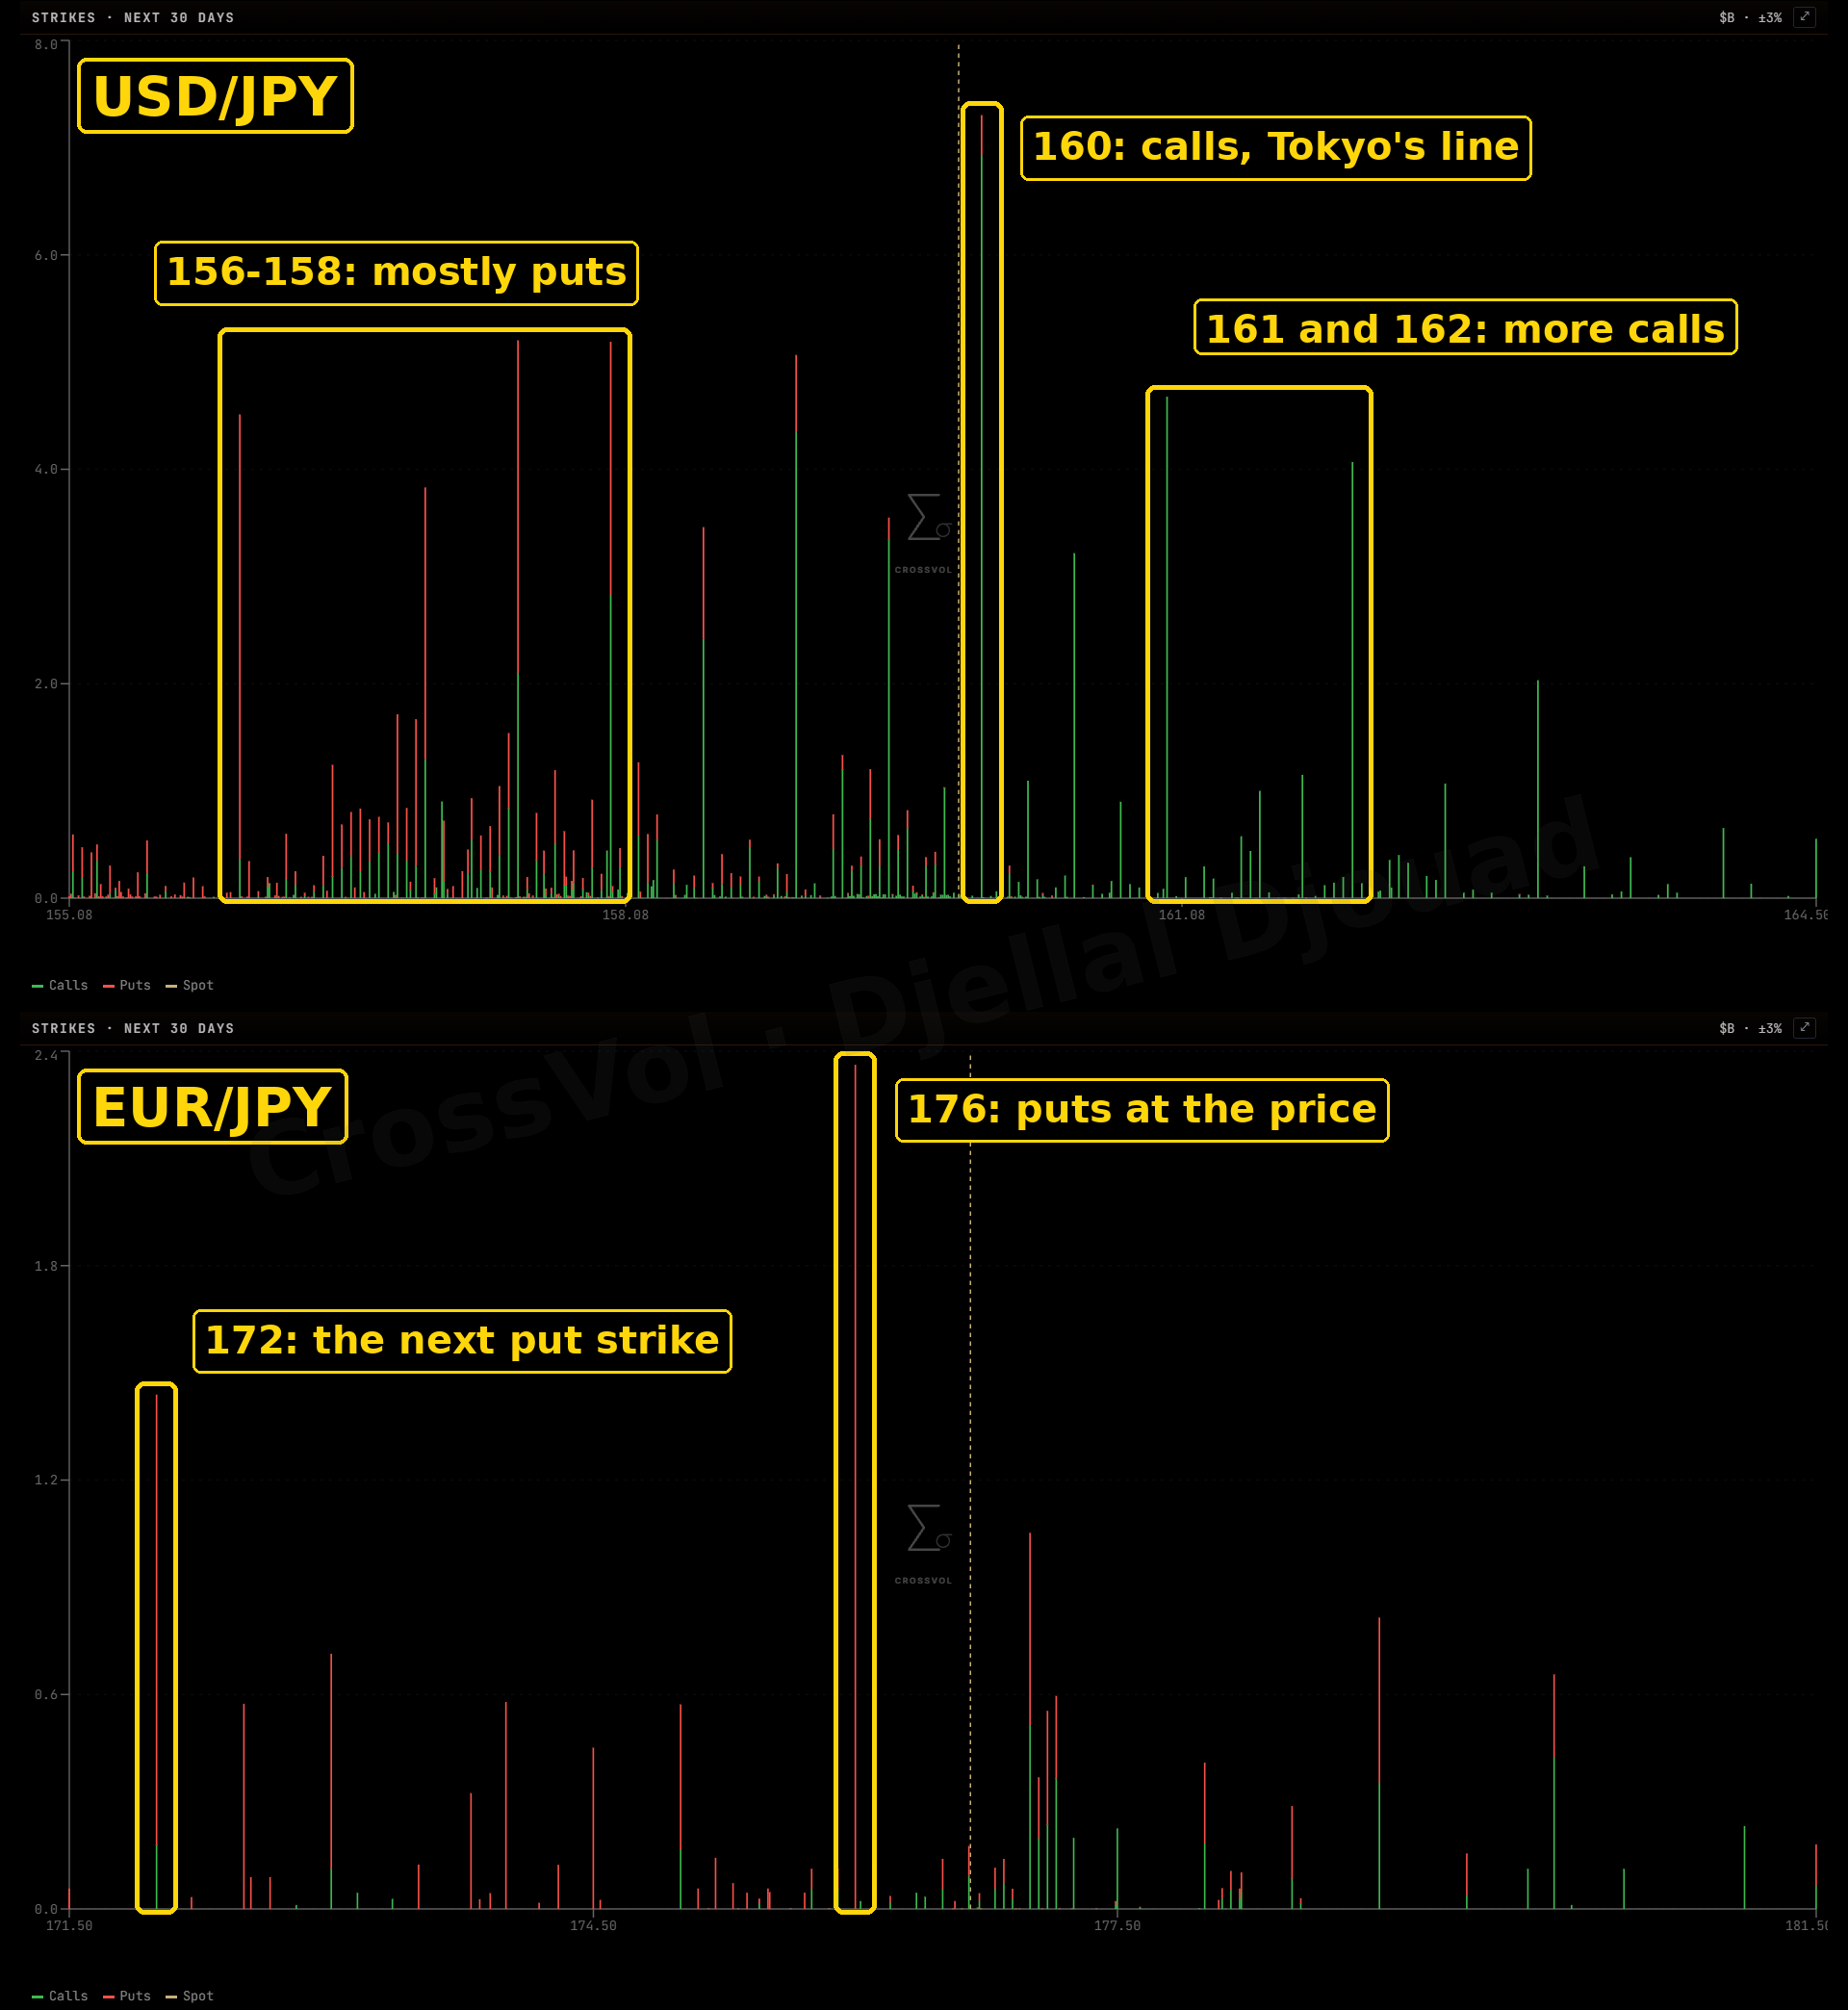
On our positioning data for swaps and spot FX options, there is no panic either: euro-dollar option volumes are below their recent average. Options on a weaker euro dominate the EUR/JPY market, and dollar-yen options are built around 160, the level the market is watching for intervention.
Against the yen: Tokyo decides the timing
USD/JPY closed Friday at 159.71, about where it stood on April 29 (159.8 on the European Central Bank's reference rates), the day before Japan's first intervention of the year. Japan bought about ¥27.1 trillion of yen this year, in two waves, from April 30 to May 6 and from July 30 to August 3, according to the Ministry of Finance. On August 1, in Volatility moved to the currencies, and crypto fell asleep, I quoted estimates of about ¥8.45 trillion for July 30, the biggest day; the official figure is ¥7.98 trillion. EUR/JPY lost 2.1% on April 30 and 3.3% between July 30 and August 3 (ECB reference rates): intervention moves only the yen leg, so it hits the cross hard. And this week a New York Fed report confirmed that on July 31 the US Treasury bought ¥79.4 billion by selling euros, about $500 million.
Intervention is the first trigger, and the warnings are back. On Thursday Japan's top currency official, Atsushi Mimura, called the yen's recent moves "too fast", and USD/JPY touched 160.19 on Friday.
The Bank of Japan is the second trigger. Swaps price a hike on December 18 at 84.1%, and about three by October 2027; the 10-year Japanese government bond yield rose 21.7 bp this week, to 2.871%. With 3-month swap rates at 2.60% in euros and 1.37% in yen, a long EUR/JPY position now earns only about 1.2 points a year from the rate gap, its carry: a thin cushion if volatility rises, and each Bank of Japan hike thins it further unless the ECB keeps pace.
The third trigger is the one I watch most closely, and I expect it to rise: funding stress among Tokyo banks. As I showed in today's recap, the 3-month Tokyo interbank rate (TIBOR) is 1.787%, its highest in at least a year, against 1.373% for the 3-month yen overnight swap rate, which prices only the expected policy path. The 41.4 bp between them is what Tokyo banks charge each other on top of that path. It jumped to a one-year high of 47.3 bp on November 6, the day after the crash. TIBOR has not moved since: the premium has narrowed only because swaps now price more of a December hike.
Why would funding stress lift the yen? Japanese banks and insurers that need yen sell foreign assets and bring the money home, and positions funded in yen get cut. On our data, trend-following funds are short the yen: a rally would force them to buy it back. The history is not one-way, though. In 1997 and 1998, when Japanese banks paid a premium to borrow dollars, the yen first weakened; it surged only when yen-funded positions were unwound, with the dollar losing about 20 yen in two days in October 1998. So I watch the yen when the premium rises: if USD/JPY falls at the same time, EUR/JPY falls fast.
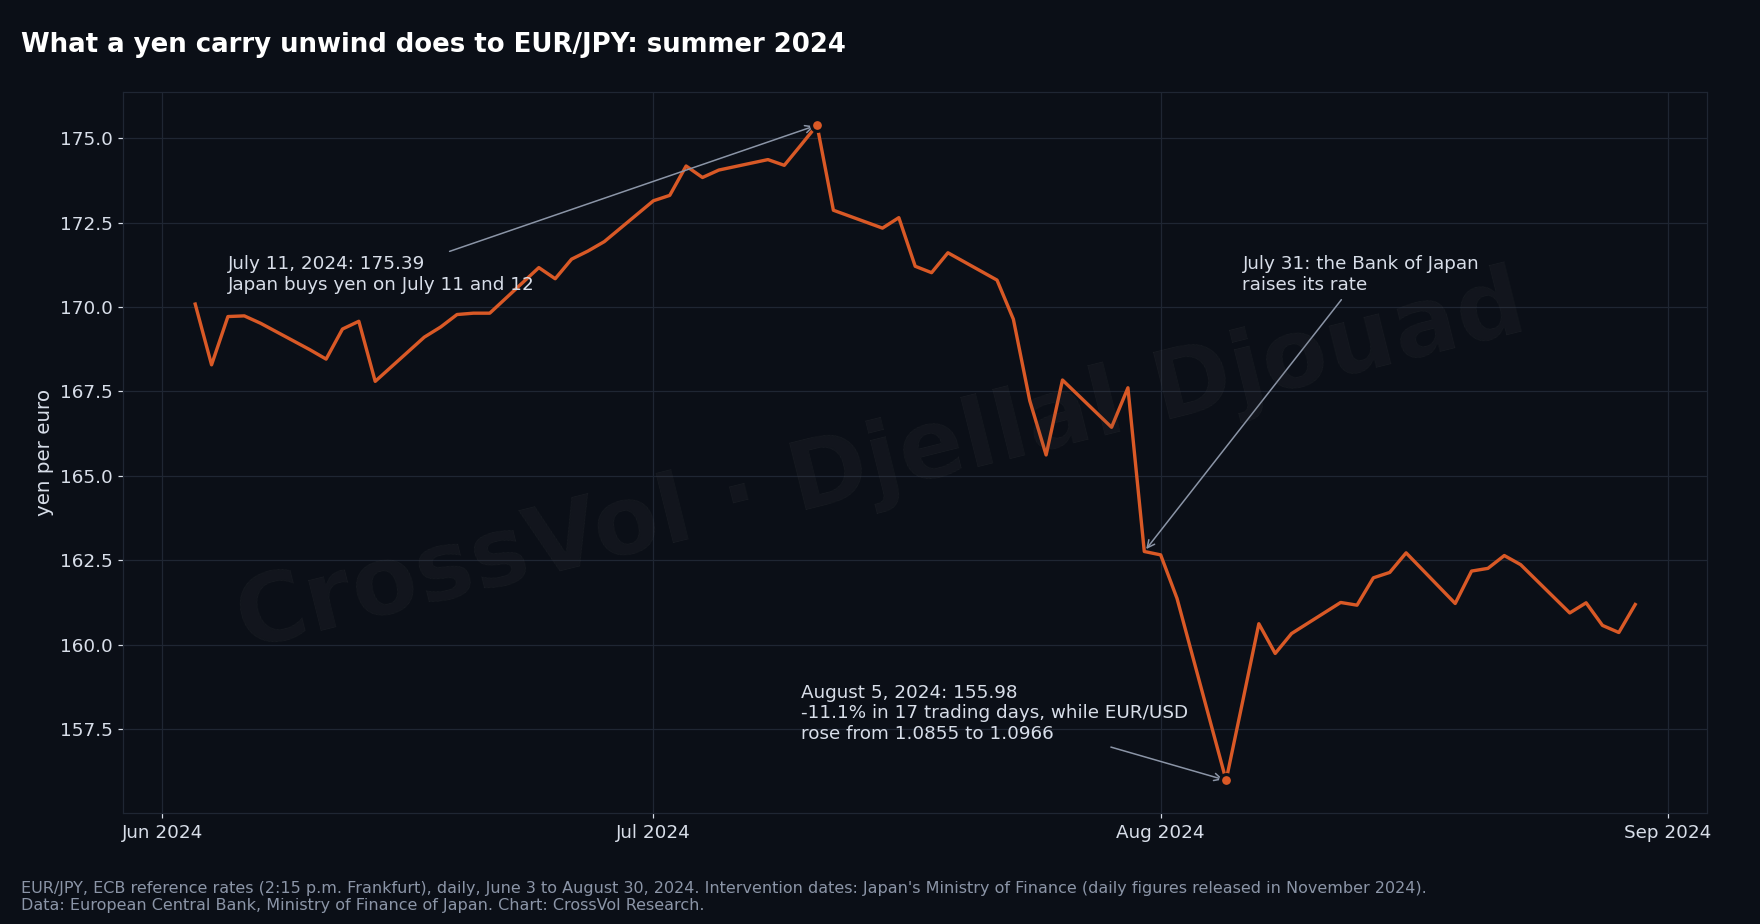
The last unwind shows the size of the move. In the summer of 2024, Japan bought yen on July 11 and 12, the Bank of Japan hiked on July 31, and EUR/JPY fell 11.1% in 17 sessions, from 175.39 to 155.98, while EUR/USD rose. Goldman Sachs calls a short USD/JPY the best currency hedge against an AI-led sell-off and in late September cut its USD/JPY forecast to 150 in a year, and MUFG recommends selling EUR/JPY with a target of 172, according to public reports.
The technical picture
EUR/USD: a downtrend on every horizon. Friday's close at 1.1023 was the fourth lower close in a row and the lowest of the year. On the ECB's reference rates, the euro has not been this low since April 9, 2025. It trades below its 50, 100 and 200-day moving averages, 1.1294, 1.1401 and 1.1524, which all point down and are stacked in bearish order, the shortest below the longest (chart at the top).
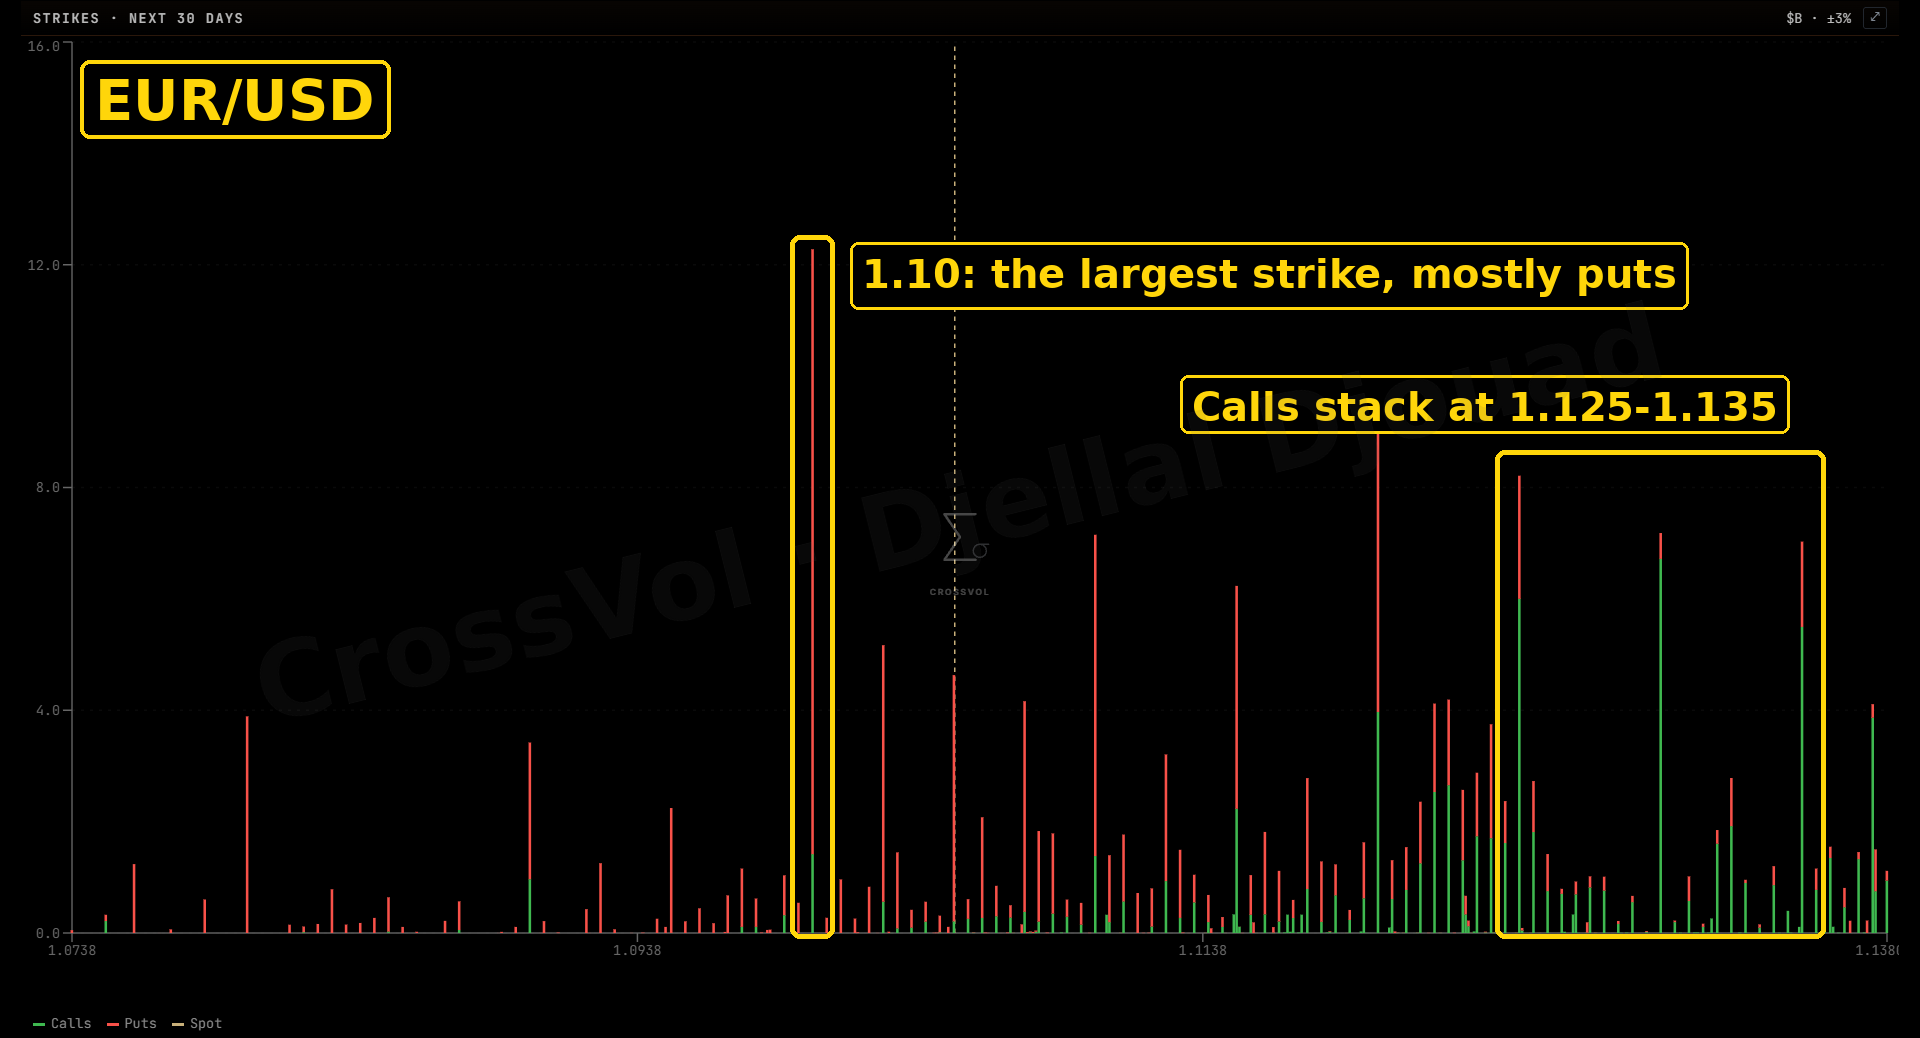
Support. First 1.10, a round number where, on our data, strikes of spot FX options cluster. Then 1.095, the last ECB reference rate below Friday's close, on April 8, 2025. Then 1.08, where the euro traded before its jump of April 2025.
Resistance. First 1.11, the floor broken on November 11, now the first ceiling. Then 1.12, around Monday's close before the four-day slide, where a close would put the fall on hold, and the 50-day average at 1.1294. A close above 1.13 would end the downtrend.
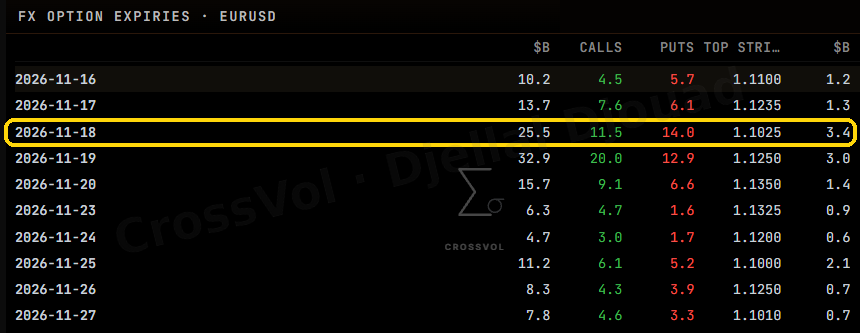
Next week. On our data, a large expiry of spot FX options sits at 1.1025 on Wednesday, November 18, right at Friday's price. It can hold the euro near there until then.
The other side. Chart watchers expected a weekly DeMark buy setup on Friday's close, a classic sign of exhaustion, and some strategists see the euro bottoming around current levels. The classic warning sign of a squeeze, a crowded short that stops making new lows, is not there: Friday's close was the low of the year.
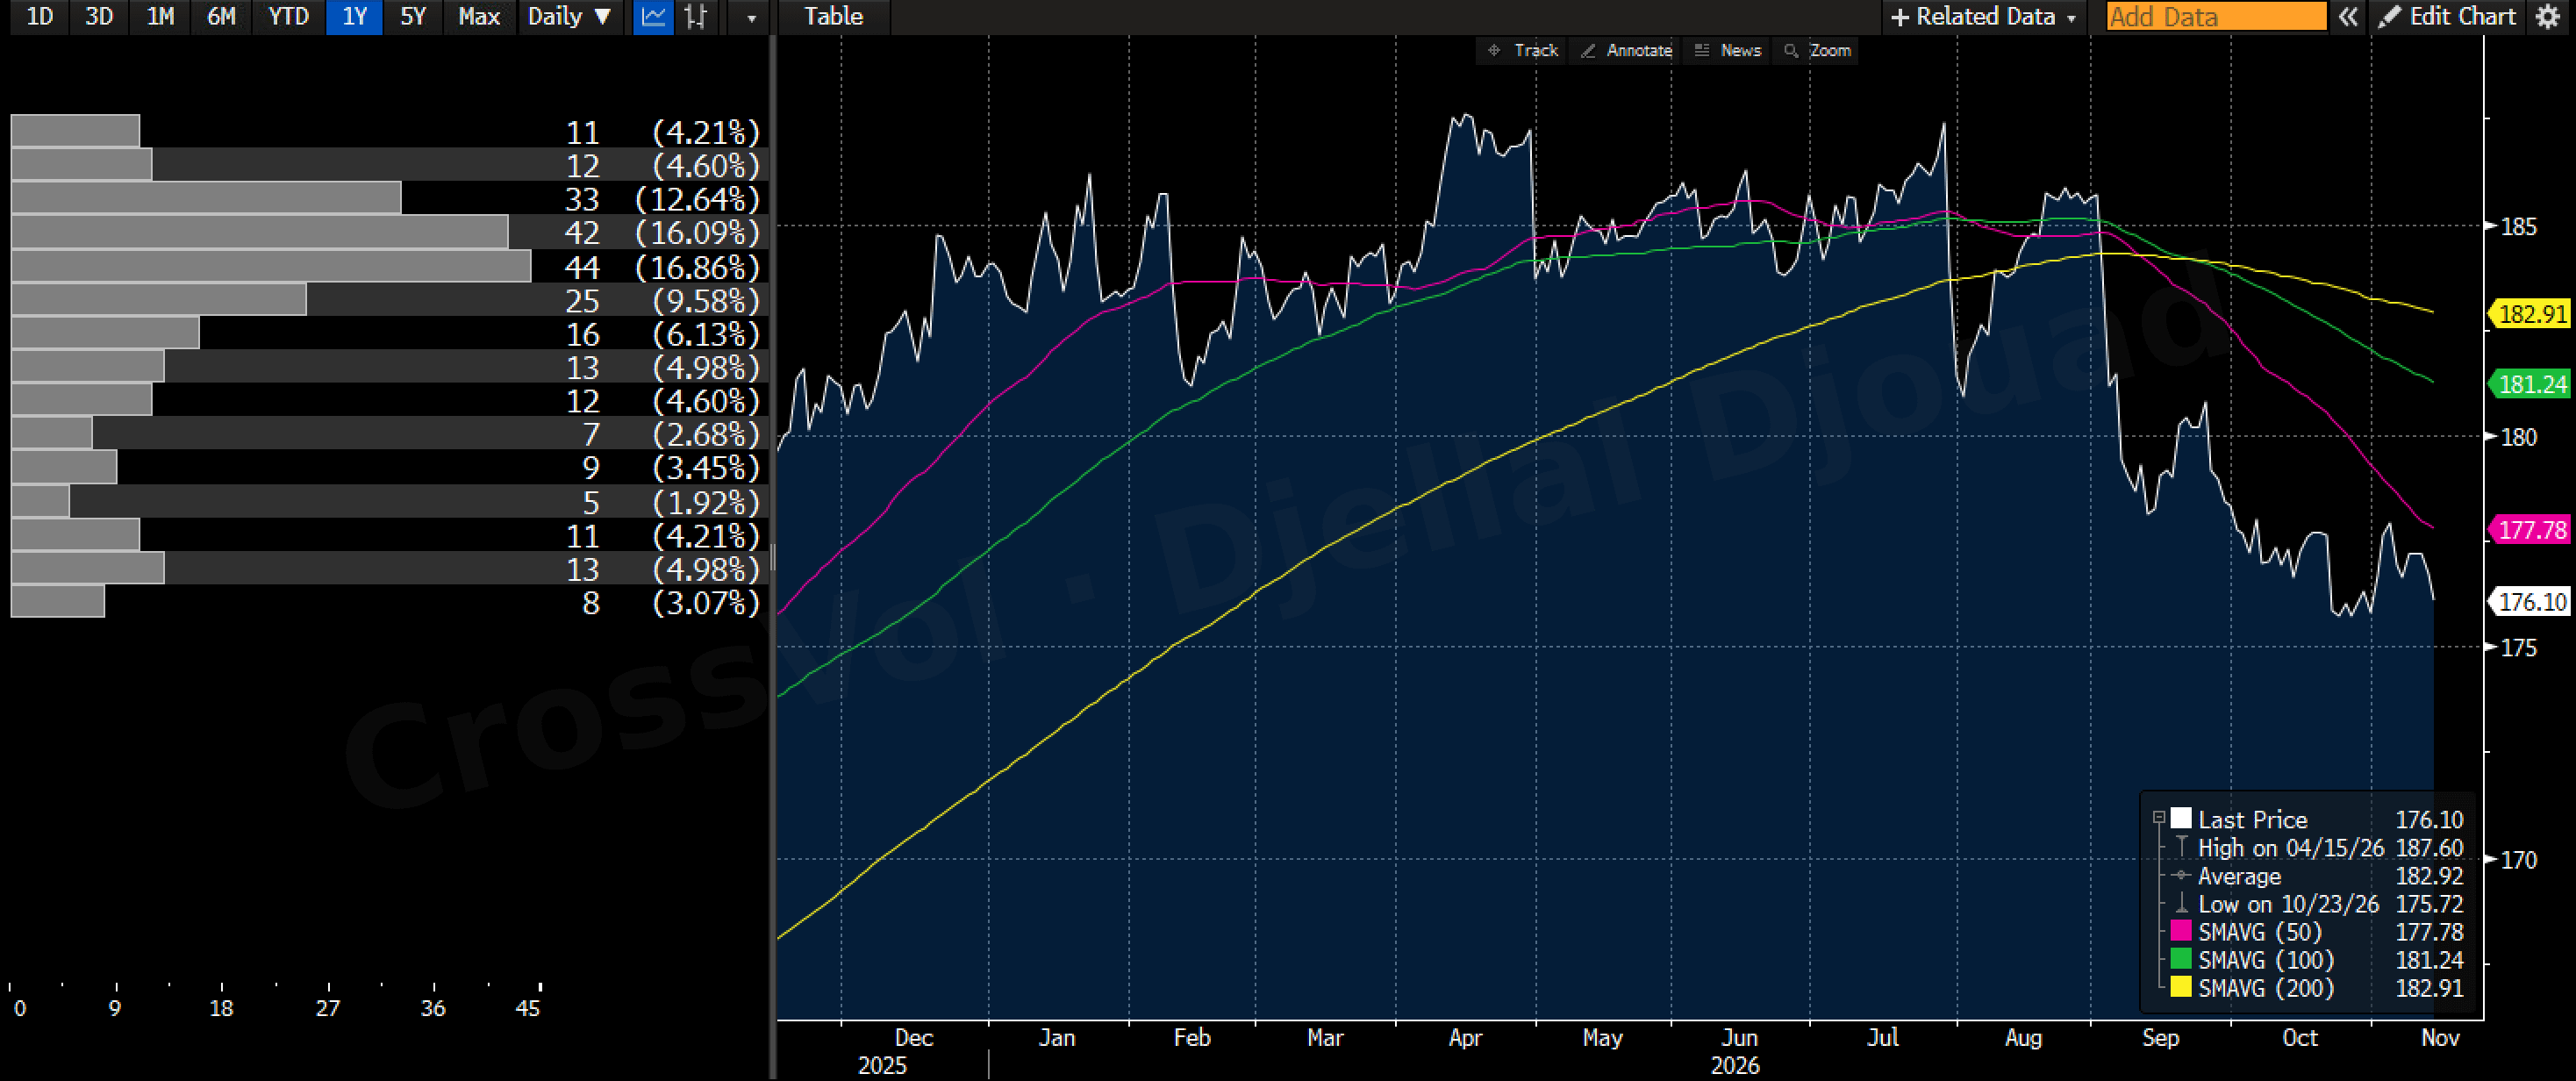
EUR/JPY: a pause, not a turn. The cross closed at 176.10, 0.38 yen above its one-year low of 175.72, set on October 23. It has been below its 50, 100 and 200-day averages, 177.78, 181.24 and 182.91, since September, and all three point down. Below 175.72, the first target is 172-173. In a Japan shock, 170-172 can come fast, and a 2024-style unwind would put 168 within reach. Above, a close over the 50-day average, 177.78, would tell me the yen leg is not ready. Options already expect a large move: as noted above, the EUR/JPY butterfly is near its one-year high, and puts on the euro cost more than the cross has been moving.
USD/JPY: Tokyo's line. USD/JPY closed at 159.71 after touching 160.19 on Friday. Before Friday, the last time it traded above 160 was September 2, when it peaked at 160.39 and the yen rebounded sharply. Its one-year high is 163.86, on July 23. Japan intervened the day after USD/JPY stood near 159.8 in April, and again in late July near 163.5-164: 160-164 is the zone Tokyo has defended. One-month implied volatility, 7.13%, is below its one-year average of 8.14%: options do not price an intervention.
The other markers I watch.
France. A close of the OAT-Bund spread below 150 bp that holds would mean the premium is leaking out. A close above 174 bp, the closing high of October 22, would open the next leg.
Tokyo funding. A rise in TIBOR itself, taking the premium back above its 47.3 bp high, would tell me the stress is spreading; 50 bp would be beyond anything seen in the past year. A premium that rises only because swaps price out the December hike would not count. If the premium rises while USD/JPY falls, it means repatriation and unwinding, and EUR/JPY falls fast.
Volatility. One-month EUR/USD implied volatility above 8% with a risk reversal below minus 1 would mean options are finally catching up.
December decides: the binary risk, and how to trade it
Nearly every speculator is short the euro, but that does not make a squeeze imminent. Most of the hedge funds' short was added since late September, above today's price: it is in profit, and the rate gap still pays them to hold it. A crowded short is fuel, not a spark. The spark would take one of two things:
The Fed seriously tempers expectations of further hikes while the ECB revises its own upward. That would narrow the rate gap that drives the trend. The Fed decides on December 9, the ECB on December 17, with new staff forecasts.
Peace in Ukraine or an end to the Iran war. Either would take pressure off gas, and with it the energy shock behind the ECB's dilemma and the euro's weakness. Before the Iran war, the Strait of Hormuz handled about a fifth of the world's trade in liquefied natural gas.
Against that, the risks weighing on the euro are many:
a Fed that has all but locked in a December hike;
a French budget that may have to pass by ordinance after December 17, with S&P's review of France on November 27;
a snap election in Spain on November 29, and budget fights in Germany's fragile coalition and in Italy, a year before its election;
a rift between France and Algeria over trade, fertilizer and energy, with Italy and Spain moving closer to Algiers;
gas storage 17 points below normal going into winter;
euro bank funding that has not normalized;
France's presidential election next spring, already visible in six-month volatility.
If FX volatility wakes up, the euro is exposed and the yen stands to gain. Positions funded in yen get cut, as in the summer of 2024, when EUR/JPY lost 11.1% in 17 sessions.
December packs the catalysts into two weeks:
US payrolls on December 4;
the Fed on December 9, and US inflation the day after;
the ECB and France's budget deadline on December 17;
the Bank of Japan on December 18.
That makes the outcome binary, and it is why I would trade it with options rather than with outright spot positions.
The paths I see:
The slide continues (my base case). The Fed hikes, US inflation stays firm and France stays under pressure: EUR/USD breaks 1.10 and grinds toward 1.08 by the ECB meeting. Against the yen, EUR/JPY ranges between 174 and 178 into the Bank of Japan, then falls toward 172-173 if Japan hikes and Tokyo caps USD/JPY in the 160-164 zone.
The acceleration. A French shock (a budget vote, a censure motion, a rating action) or a new funding spike takes EUR/USD to 1.07-1.075 in a few sessions, with one-month volatility above 8%. In Japan, a rise in TIBOR that lifts the premium above 47.3 bp, an intervention or a Bank of Japan surprise takes EUR/JPY to 170-172 fast, and a 2024-style unwind would put 168 within reach.
The squeeze. One of the two catalysts sends EUR/USD to 1.11, then 1.12, then the 50-day average at 1.1294. A close above 1.13 would end the downtrend.
The yen keeps sliding. The Bank of Japan waits, USD/JPY breaks 160 without a response from Tokyo, and EUR/JPY goes to 178-180.
How I would trade the binary. I would use spreads with a known maximum loss, on a Wednesday, December 23 expiry (New York 10:00 cut). That date sits after the whole cluster, the Fed, US inflation, the ECB and the Bank of Japan, and leaves a few sessions to take profits or cut before expiry, which I would not hold into. All the examples are over-the-counter vanilla options on the spot exchange rate, with strikes in spot terms and physical delivery, not options on currency futures. In each spread you buy one option and sell another further out. The one you sell carries a higher implied volatility than the one you buy, most of all on euro and dollar puts against the yen, where the market pays up for protection, so the spread costs much less than the single option. On EUR/USD, options also price less than the euro has just moved. Mid-market prices at Friday's close, for 1 million of the base currency (spot references: EUR/USD 1.1023, EUR/JPY 176.05, USD/JPY 159.71); a dealer would charge somewhat more, mostly on the option you sell:
For the base case, a EUR/USD 1.10/1.08 put spread. About 0.43% of the euro amount (4,260 euros per million, or 47 dollar pips), paying at most 2 cents per euro, 20,000 dollars per million, about 4 times the cost; breakeven at expiry 1.0953.
If volatility wakes up and Tokyo moves, a EUR/JPY 175/170 put spread. About 0.52% of the euro amount (5,230 euros per million, about 0.92 yen per euro), paying at most 5 yen per euro, about 5 times the cost; breakeven 174.08. It gains from a weaker euro and a stronger yen at the same time. A 174/168 version, the Japan-shock trade, costs about 0.43% (0.76 yen) and pays at most 6 yen, about 8 times the cost.
If the Fed backs off, a USD/JPY 157/152 put spread. About 0.35% of the dollar amount (3,510 dollars per million, about 0.56 yen per dollar), paying at most 5 yen per dollar, about 9 times the cost; breakeven 156.44. If the dollar loses its rate premium, USD/JPY has the most room to fall, and the same trade gains if Tokyo intervenes or the Bank of Japan surprises. With USD/JPY volatility below its one-year average, the put you buy is cheap, while the market pays up for the one you sell.
To hedge an existing euro short, a EUR/USD 1.11/1.13 call spread. About 0.41% of the euro amount (4,100 euros per million, or 45 dollar pips), paying at most 2 cents per euro, about 4 times the cost; breakeven at expiry 1.1145. It pays between 1.11 and 1.13, at a known cost; above 1.13, the short is exposed again.
Each spread covers one branch of December, at a cost known in advance: the most you can lose is the premium. I would take part of the gain if EUR/USD reaches 1.09 before the Fed, and cut the put spread on a close above 1.12, where the fall would be on hold. What I would avoid: selling volatility into three central bank meetings within nine days, and selling euro calls to pay for puts with the short this crowded. These examples illustrate the mechanics; none is a recommendation.
The calendar
Sunday, November 15, 6:50 p.m. New York time (Monday morning in Tokyo): Japan's third-quarter GDP.
Monday, November 16, 3:30 p.m. New York time: the CFTC report for positions on November 10.
Wednesday, November 18: final October inflation for the euro area. Thursday night: Japan's October consumer prices.
Friday, November 27: S&P's scheduled review of France's rating.
Sunday, November 29: Spain's snap general election.
Tuesday, December 1: flash November inflation for the euro area.
Friday, December 4: US payrolls. Wednesday, December 9: the Fed. Thursday, December 10: US November CPI, the day after the Fed.
Thursday, December 17: the ECB, and the end of the 70 days parliament has to pass France's budget. Friday, December 18: the Bank of Japan.
Spring 2027: France's presidential election, already visible in six-month EUR/USD volatility.
This article is for educational purposes only. It is not investment advice and not a recommendation to buy or sell anything. Currencies, bonds, options and futures carry a high risk of loss, and leveraged products can lose more than the amount invested. Figures are Friday, November 13, 2026 closes unless stated otherwise. Positioning data are those of November 3, the latest published.
Further reading
The Volatility Risk Premium Explained: Why Implied Beats Realized
Risk Reversal Skew Explained: Reading Put vs Call Implied Vol
The OAT-Bund Spread Explained: France, Germany, and Sovereign Risk
CrossVol Research is the research desk of CrossVol (crossvol.com), an options analytics platform for derivatives traders.
How to cite: Djellal Djouad, CrossVol Research, "EUR/USD and EUR/JPY Forecast: The Euro Keeps Falling While FX Volatility Sleeps", 14 November 2026. https://newsletter.crossvolresearch.com/p/eur-usd-eur-jpy-forecast-euro-falling-fx-volatility
Very great work. Thank you so much
Very clear and useful article to understand all the mechanisms to setup a trade. Great work, thank you.