

By Lucas Erbrech, CrossVol Derivatives Team. Data: close of Tuesday, November 17, 2026.
This article is published for educational purposes. It is neither investment advice nor a recommendation to buy or sell. Options and other derivatives carry a high risk of loss.
Gold, the dollar, the yen, Treasuries or consumer staples: which one protects a portfolio if the AI trade breaks? I looked for the answer in twenty-five years of tech sell-offs, today's option prices and the balance sheets behind the AI build-out.
Since Sep 28, semiconductors have lost 23%, Nvidia 32% and the Nasdaq 11%. An investor who bought gold for protection lost 6.7%. With silver, 22%. With bitcoin, 23%.
Nvidia reported its results on Tuesday evening. On Wednesday it opened 2.4% higher, gave the gain back during the session and closed down 2.9%. Gold lost 3.2% to its lowest close of the year, below the previous day's low.
What has already been written. On July 18 CrossVol Research showed that gold had stopped doing its job in the oil shock: real yields were winning, and demand for real assets was moving to industrial metals. On October 30 it described gold sold as the last winner to liquidate in a slowdown, down in 16 of the 21 sessions of 2026 in which the S&P lost more than 1%. Those notes explain why gold is falling. Here the question is narrower: in an AI crisis, which haven protects, at what cost, and what can the past tell us?
My read. There is no single haven against an AI crisis, but one per rate regime, and the Fed picks the regime.
As long as short rates rise, as they did from June to September, history leaves little besides the dollar and, to a lesser degree, short-dated Treasuries. In the tech crises when the 2-year Treasury yield rose, gold fell three times out of four and the yen two times out of three, on my split of the episodes (section 5 shows how fragile that count is). Gold in 2026 is doing what it has always done in this regime.
If the Fed turns, everything changes. In the crises when the 2-year fell, the yen rose five times out of five and gold gained a median 11% (Treasuries too, but that is almost automatic when yields fall).
Consumer staples did protect this time, but that is the exception of this episode, not a rule: their implied vol is at the 79th percentile of the past year, and history does not know them as a haven.
Between the two regimes sits an asset the market barely pays for: the yen. Its one-month implied vol in currency options is 6.9%, at the 8th percentile of the past five years (only 8% of daily readings were lower), and no asset's vol rises more clearly when its price rises. It is not a haven today but a cheap option on the day the Fed, or the carry trade (borrowing cheap yen to buy higher-yielding assets), turns. Cheap, not free: holding the yen costs the gap between US and Japanese rates, about 3% a year.
To know which regime is coming, watch the AI circuit, where the money goes round in circles: Nvidia finances its customers, who buy its chips, and the big groups sign leases that serve as collateral for the data-center builders. The most fragile link, CoreWeave, already has credit default swaps pricing roughly a one-in-six chance of default within a year.
One caveat runs through the article: no past crisis involved the kind of default now taking shape, and I flag it each time it changes the conclusion.
In brief
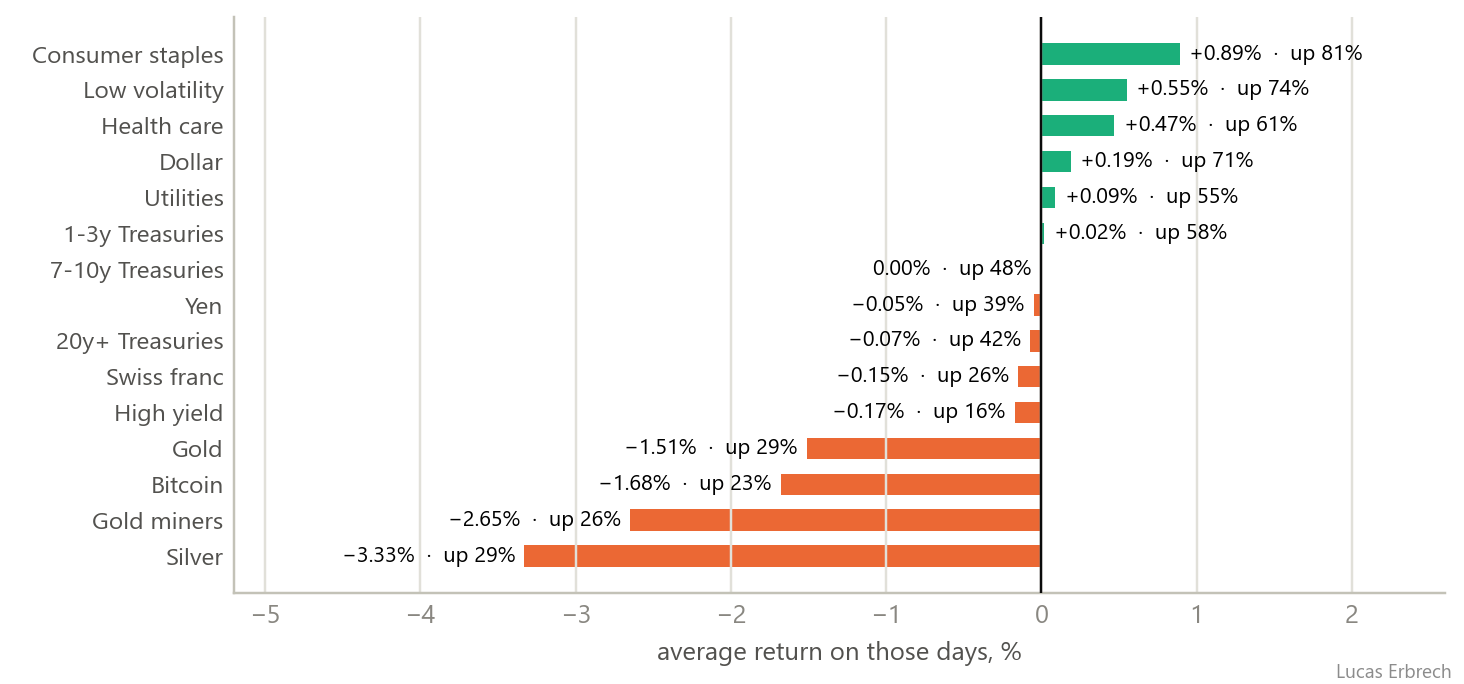
The 31 days of 2026 when SMH (the semiconductor ETF) fell 3% or more. Staples rose on 81% of them, the dollar on 71%. Gold fell 1.5% on average, silver 3.3%, bitcoin 1.7%.
Gold tracks the Nasdaq and the dollar, not real yields, and this is neither new nor specific to AI. Nasdaq beta of 0.32 (0.57 six months ago), against a five-year median of 0.03; dollar sensitivity of −2.3 (−0.9 at the median, −0.1 six months ago). Its vol rises when it falls: a −0.46 correlation between its returns and its implied vol changes, against +0.40 at the median.
What is expensive. Tech vol (Nasdaq at the 99th percentile of one year, semiconductors at the 99th of five) and, less so, defensive vol (health care at the 88th percentile of one year, staples at the 79th).
What is cheap, over five years. The yen (6.9% in currency options, 8th percentile), Treasuries (24th to 28th), the dollar (50th). Over one year, only the yen (15th) and the Swiss franc (35th) stay low.
Vol on AI sell-off days. Implied correlation among the largest S&P stocks rises 87% of the time, the VIX 81%, rates vol (the MOVE index) only half the time: this is still an equity crisis.
Skew. Puts are expensive on tech (25-delta risk reversals of −9 to −11 vol points), more so at short maturities. Treasury skew is flat, gold's stays on the put side and the yen's is on the call side.
The AI circuit is circular and largely off balance sheet. According to the Fed, seven groups carry more than $1 trillion of leases not yet commenced and more than $2 trillion of purchase commitments and guarantees. Nvidia guarantees up to $108.5bn.
The hyperscalers spend 95% of what they generate, 100% counting finance leases. Their free cash flow has fallen from $223bn to $33bn in three years, and their debt has doubled.
The weak link is under strain. CoreWeave's naive distance to default is 0.1, below 1 since mid-October. Read literally, that is a 46% chance of default within a year; its credit default swaps price about one in six, and a standard structural default model 12%, up from 4.5% in May. Oracle is at 1.6. Private credit is still calm on its listed prices (23rd percentile).
What I keep. The dollar first. Consumer staples held outright, without overpaying. Short-dated Treasuries only if the Fed stops hiking. Yen calls as an option on that turn. No gold while short rates rise.
1. A thematic crisis: AI falls, the rest of the market holds
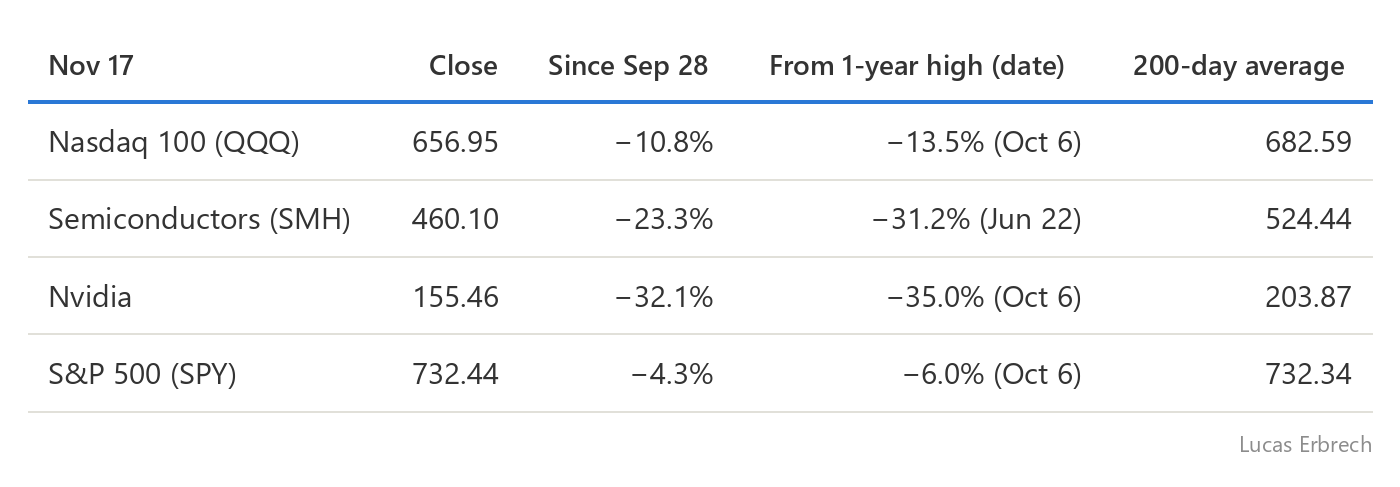
The fall is concentrated on one theme. The S&P has lost 4% and still holds its 200-day moving average, by 0.01%.
Positioning has been cleared out. Desk summaries from Nov 17 and 18 agree:
the prime brokers' long/short ratio on tech is 1.5, the lowest since the series began in 2016;
fund managers' tech overweight has dropped 27 points in a month;
$7.3bn has flowed out of semiconductors;
52% of managers expect the hyperscalers to cut their AI spending.
The contagion risk runs through credit.
Spreads on AI-linked credit have widened from 100 to 140 basis points (bp), according to one desk summary.
38% of managers see hyperscaler bonds as the leading systemic credit risk.
The high-yield spread (the extra yield on junk bonds over Treasuries) is 3.37%, at the 98th percentile of the past year, just below its Oct 30 high of 3.40%.
Correlation is coming back. Implied correlation among the largest S&P stocks (the one-month COR1M index: how closely options price them to move together) has gone from 8 to 20 in twenty sessions, against a 2026 average of 12.5. An index hedge works again, and "long AI, short index vol" positions turn dangerous.
And the Fed is hiking. Fed funds futures price a hike on Dec 9 and three by mid-2027. The 2-year yield rose 24 bp between the tech peak in June and the Nov 5 trough, which sets this sell-off apart from most earlier ones and decides the havens (section 5). One nuance: the 2-year touched 4.93% on Sep 28 and stands at 4.80%, so the market is still waiting for the Fed but has stopped adding to the bet.
In plain English. For now this is a thematic crisis, unfolding under a tightening Fed; it would become systemic if credit broke. The right protection depends on those two things.
2. Since September, the usual havens have cost money
Returns of each haven, and its correlation with the Nasdaq 100 (QQQ) over 63 sessions (about three months):
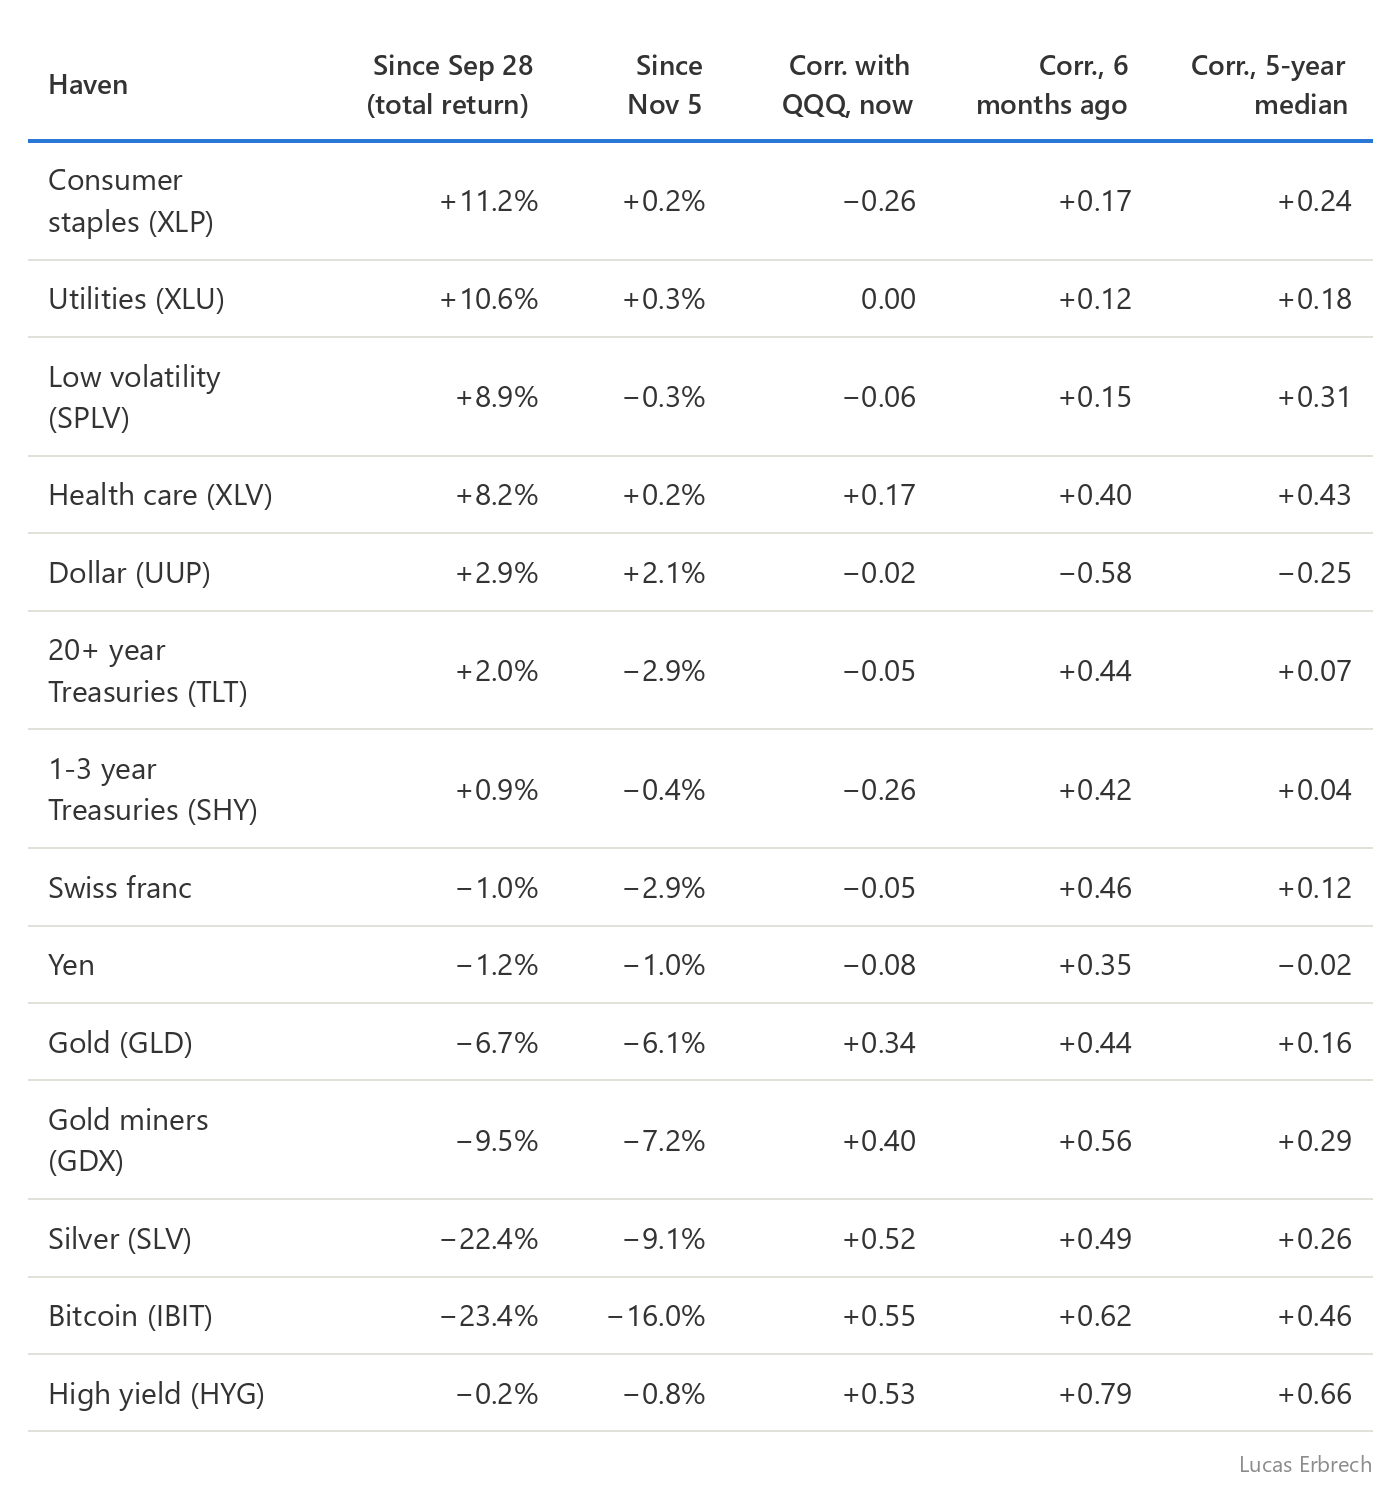
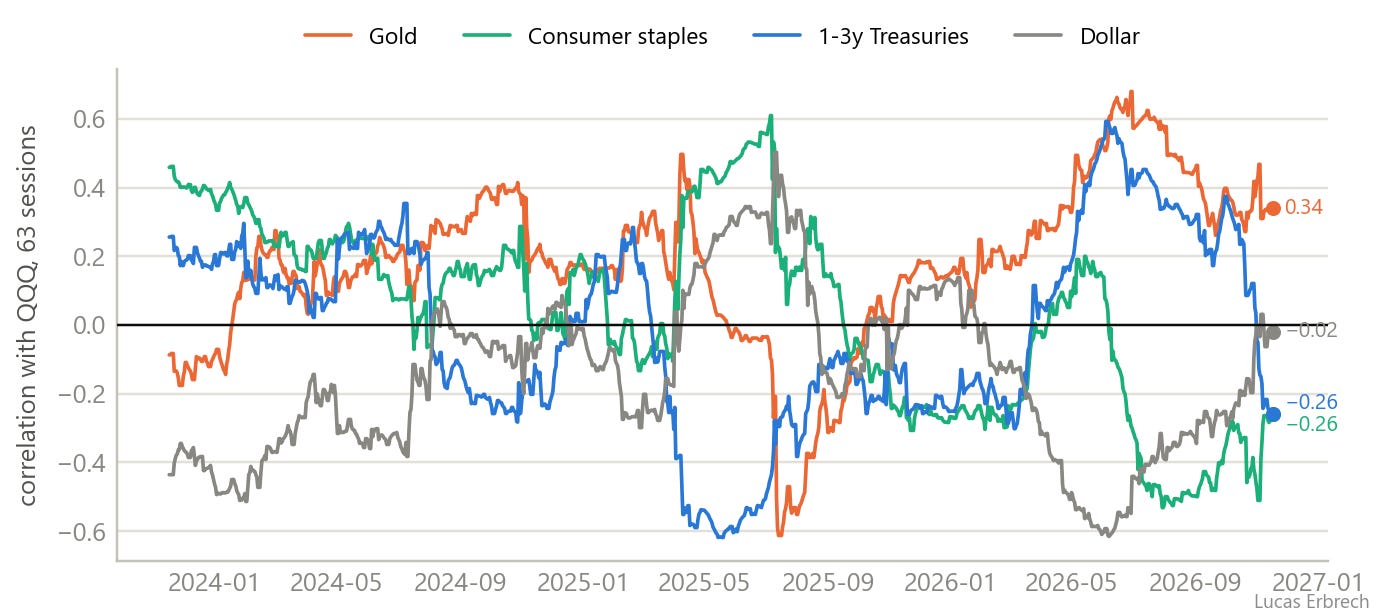
A word on precision. Over 63 sessions, a correlation carries a standard error of about 0.13: below 0.25 in absolute value, it cannot be told apart from zero, so most readings in the middle of the "now" column are noise. The change is not: for Treasuries, the franc, the yen, staples and the dollar, today's reading sits two to four standard errors from the one six months ago.
Gold, silver and bitcoin remain correlated with the Nasdaq, as they already were in the spring; for gold, above its five-year median, though within its usual range. What has changed in six months is the rest of the table: Treasuries, the franc and the yen have stopped tracking the Nasdaq, and staples have started doing the opposite.
The cleanest test is the 31 sessions of 2026 in which SMH lost 3% or more:
What rose. Consumer staples (+0.89% on average, up 81% of the time), low volatility (+0.55%, 74%), health care (+0.47%, 61%), the dollar (+0.19%, 71%).
What did nothing. Treasuries, the yen, utilities: between −0.07% and +0.09%, up 39% to 58% of the time.
What fell with AI. The Swiss franc (up 26% of the time), gold (−1.51%, up 29%), bitcoin (−1.68%), gold miners (−2.65%), silver (−3.33%).
Treasuries did protect in October: CrossVol Research noted that they rose in the four sharp sell-offs of the month. Since Nov 5, long-dated Treasuries have lost 2.9% while tech barely bounced. With the Fed hiking, their protection is intermittent.
3. Gold falls with the dollar and the Nasdaq, not with real yields
Real yields are the obvious suspect. The 10-year TIPS real yield is 2.88%, close to its five-year high (2.94% on Oct 5), but it has made a round trip in seven weeks: it fell to 2.58% on Oct 30, and gold fell anyway. Unchanged since Sep 28, it does not explain the fall.
So I regressed gold's daily return over 63 sessions on the dollar, the real yield and the Nasdaq.
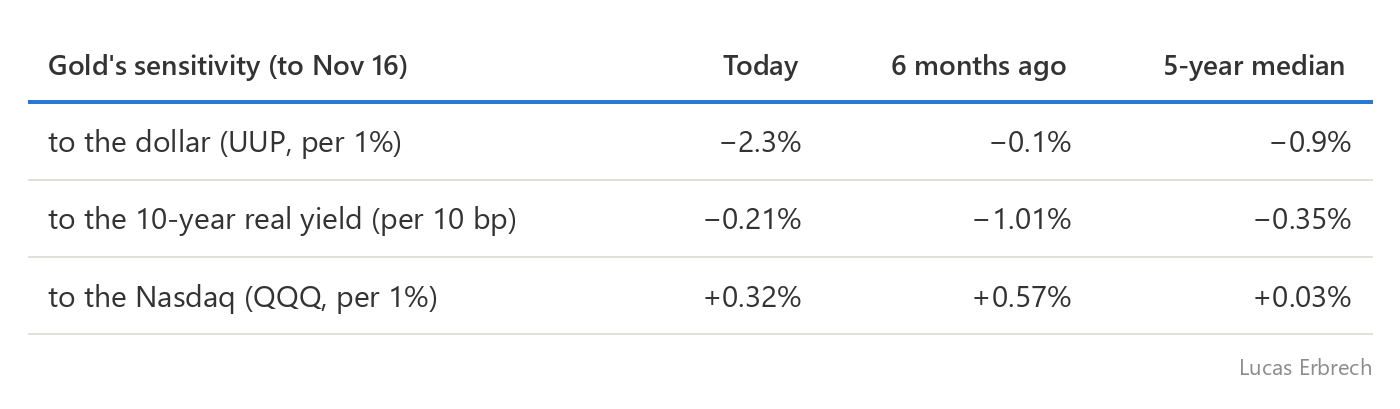
Three things stand out. (With three related factors over 63 sessions, each sensitivity is approximate: the dollar's carries a standard error of about 0.5, so −2.3 is clearly negative, but its gap to the median is only just significant.)
The dollar is the driver of the moment. Gold's sensitivity to it was almost nil six months ago; today it is two and a half times its median, and UUP set its one-year high on Nov 16.
The Nasdaq has weighed since the spring. Gold's Nasdaq beta is 0.32 against a five-year median of 0.03; over five years, only one window in ten shows a higher beta. It was even stronger six months ago (0.57): the October sell-off did not create it.
Gold positioning has not been cleared out. Speculative funds are still net long, at the 41st percentile of three years, against the 3rd percentile in silver: gold can still be sold, silver much less so.
The link with the Nasdaq has two readings, not mutually exclusive.
Positioning. This year gold was bought by the same portfolios as AI, as a hedge against currency debasement and a liquidity reserve; it is now being sold along with AI.
Rates. Gold and tech are both long-duration assets with no yield, hit together by rising short rates. Gold fell in three of the four tech crises when the 2-year rose (section 5), long before AI.
The second reading matters in practice: gold would become a haven again when the Fed stops hiking, not when positioning is purged.
4. Options: insurance is expensive where everyone is sheltering
An implied vol measures what insurance costs, not where prices are heading. But its level, its gap to realized, its reaction to price and its curve show whether the market treats an asset as a haven or as a risk.
4.1 The level: tech at the ceiling, defensives high, the yen on the floor
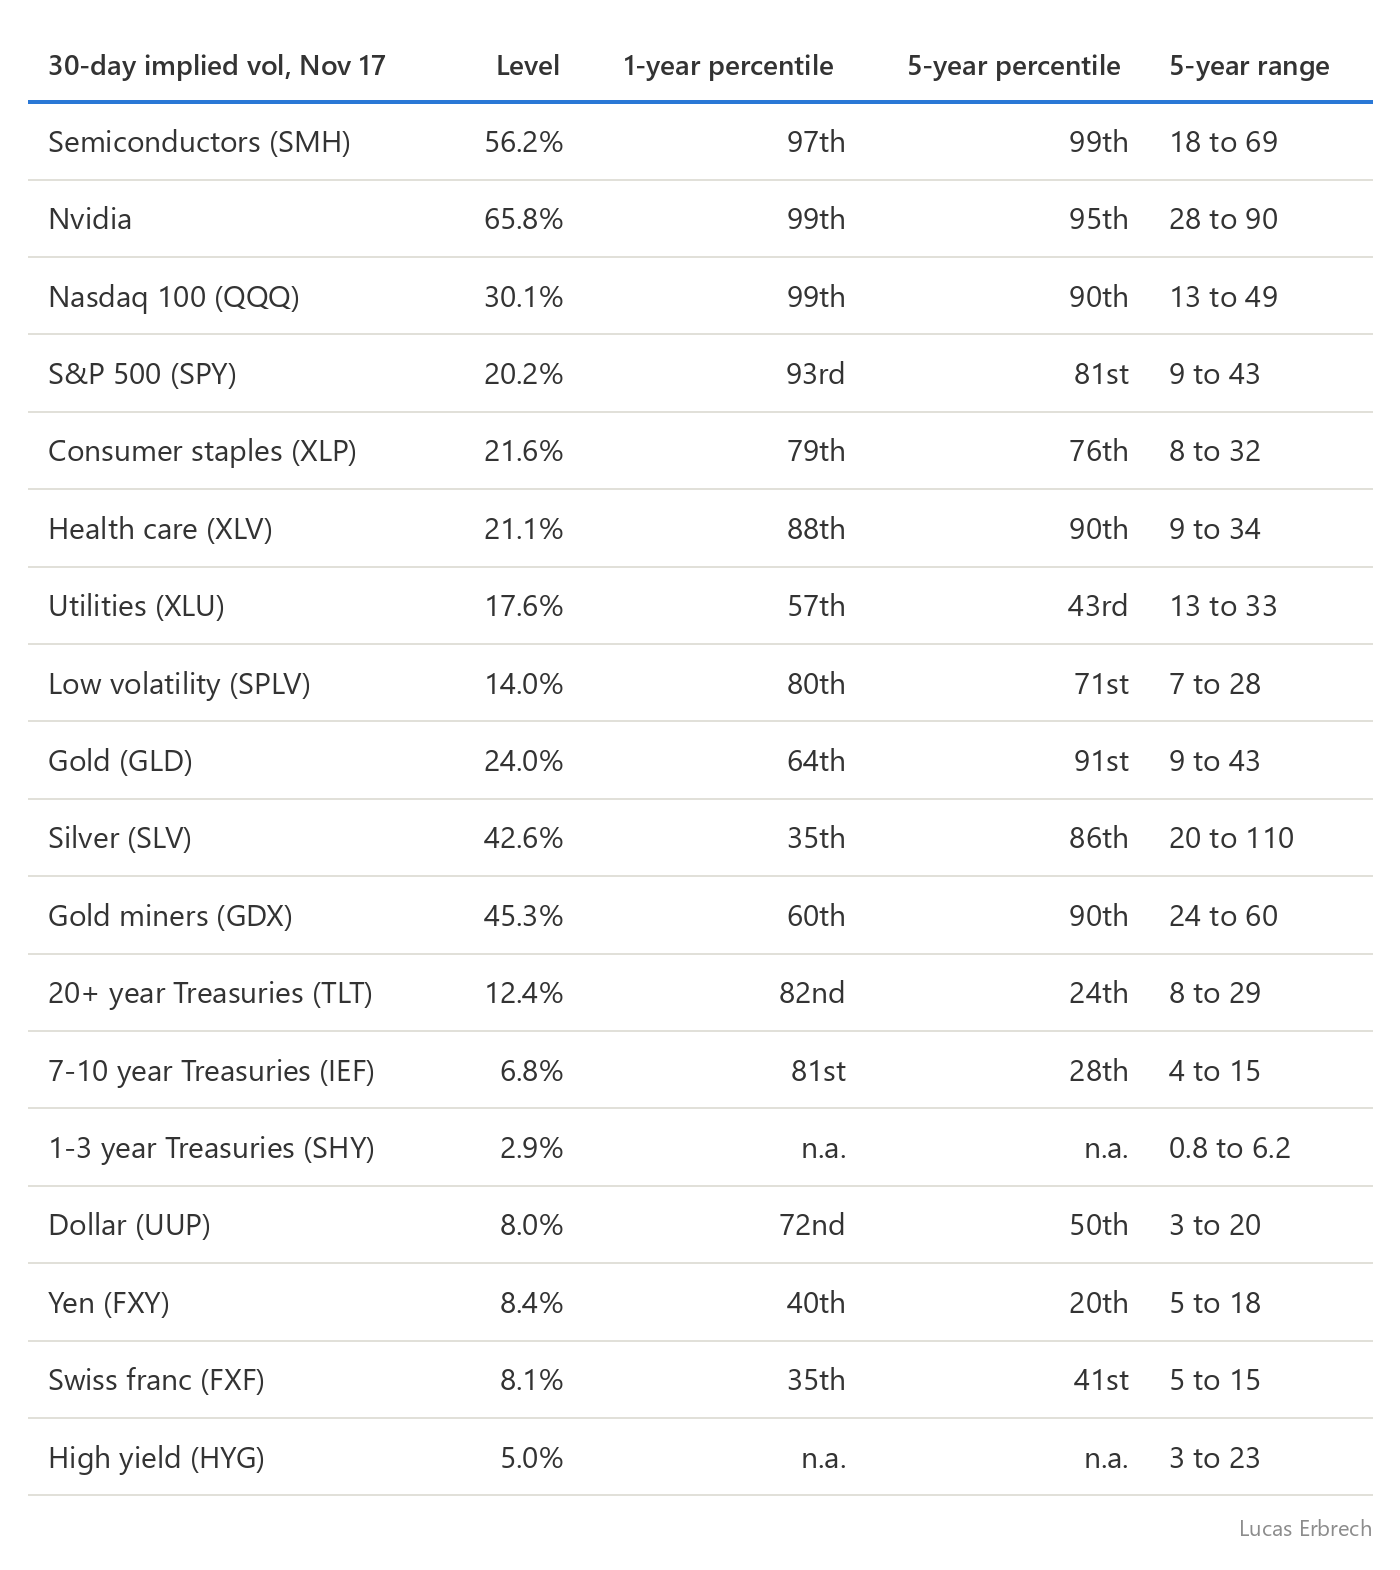
For the yen, currency options are the better gauge than the thinly traded ETF: one-month vol of 6.9%, at the 15th percentile of the past year and the 8th of the past five.
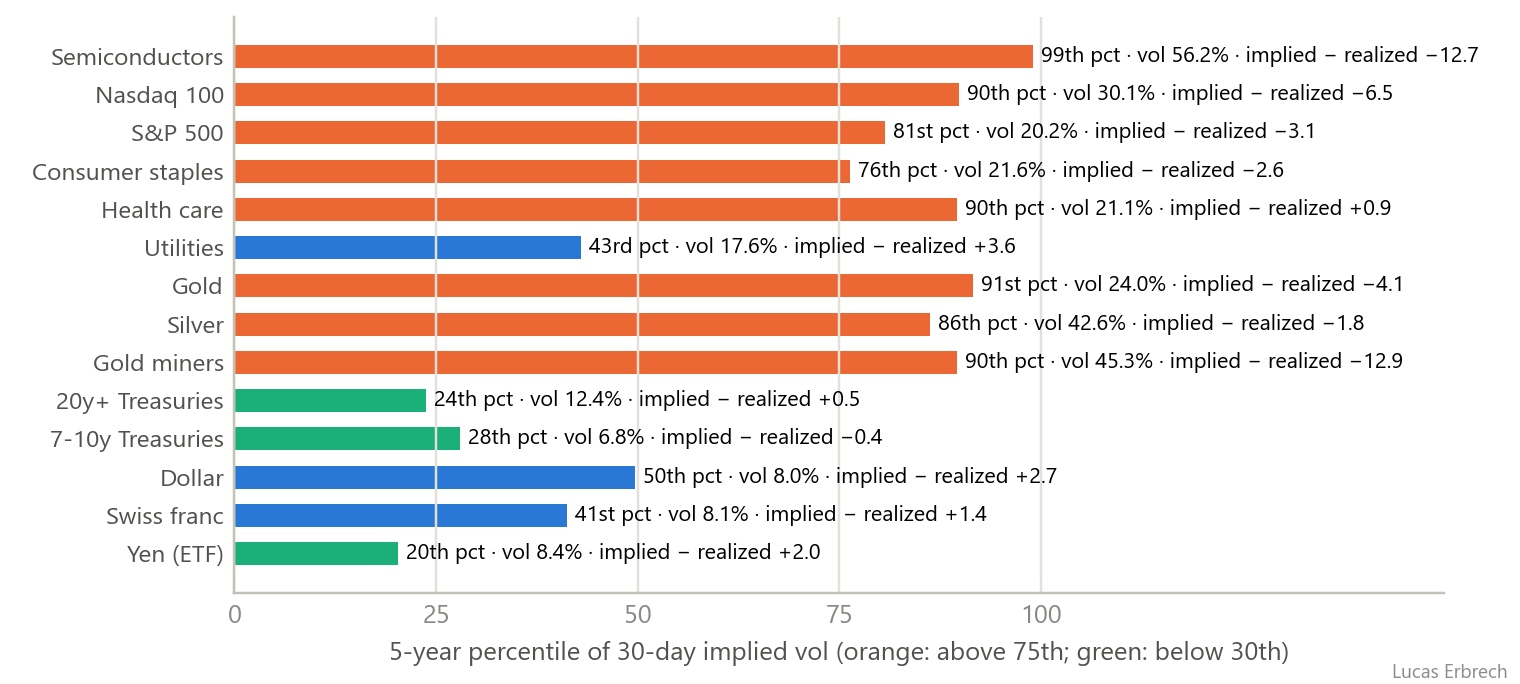
Tech is insured at a high price, and Nvidia's vol lost almost 15 points by Wednesday's close as the insurance against its results was sold back. Defensives are dear too, if less so. A haven whose vol sits at the top of its range is no longer a quiet shelter but a crowded asset that moves a lot. The classic havens cost little on a five-year view, but over one year only the yen and the franc stay low; Treasuries and the dollar sit between the 72nd and the 82nd percentile.
4.2 Implied against realized: who is underestimating the moves
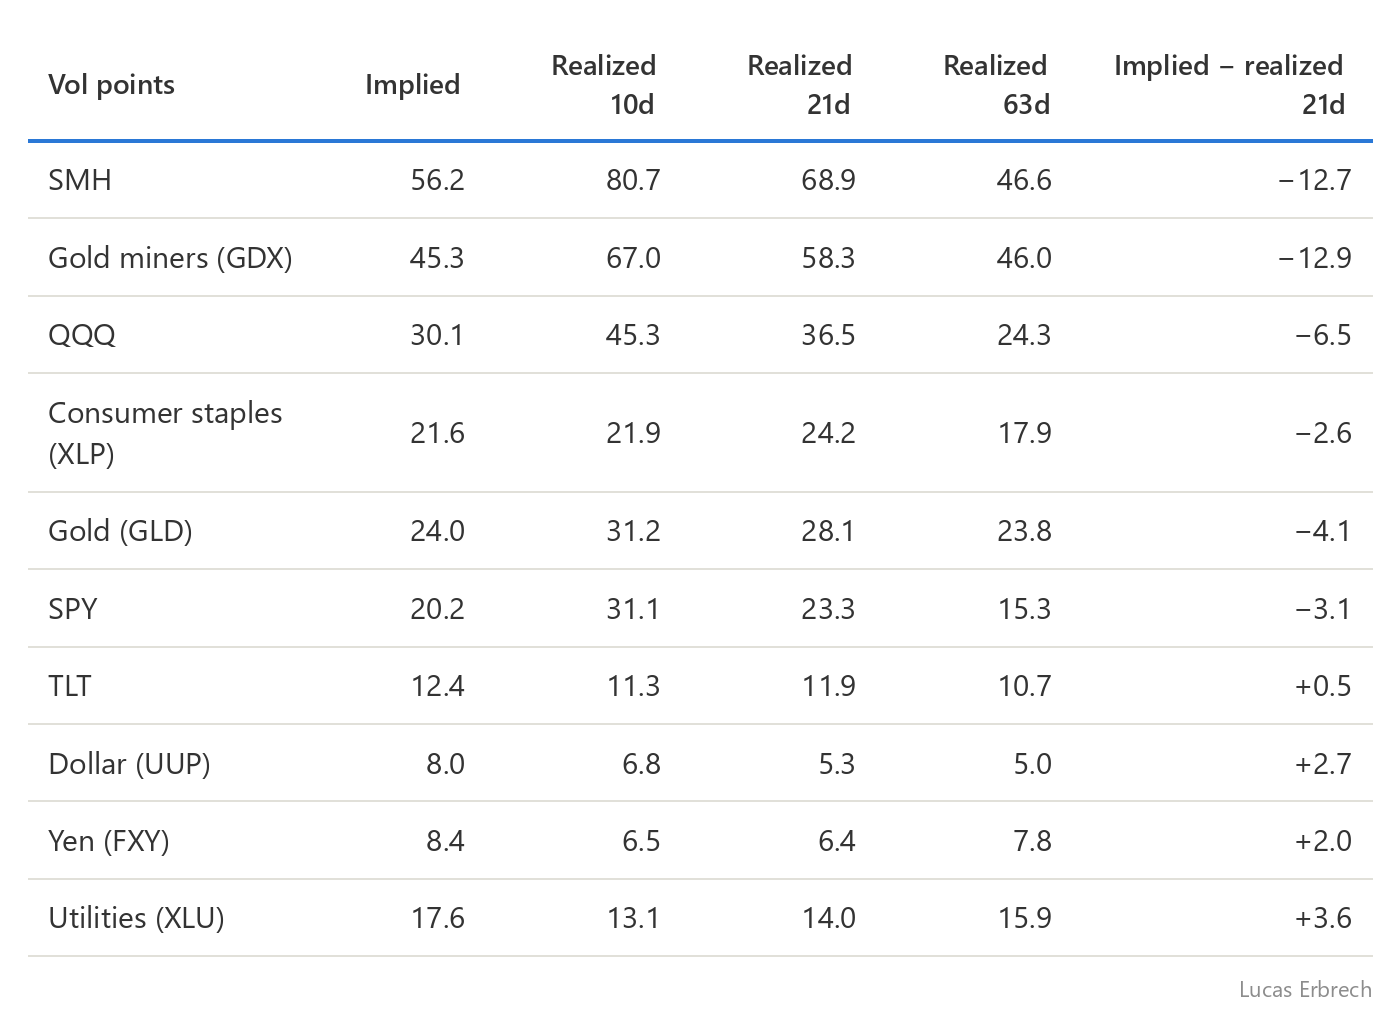
In normal times implied vol exceeds realized: the seller of insurance collects a premium. When realized runs ahead, as after a shock, the market is moving faster than options price, and options are betting on a return to calm.
That is the case for tech, gold and the miners: realized exceeds implied by about 13 points on SMH and the miners, and gold has moved more than its options price, downward.
Staples move as much as the S&P. Their 21-session realized vol (24.2%) is level with the S&P's (23.3%). The gap is within the error of a 21-session measure (about 3.6 points), but for a sector known to be calm, moving like the index may signal a concentrated flow.
The dollar, the yen and long-dated Treasuries are calm. Their implied vol exceeds realized by 0.5 to 2.7 points, the normal regime of an asset bought before the storm, not during it.
4.3 The price-vol link: gold has lost its haven signature, the yen has it
For each asset I measure the correlation, over 63 sessions, between its daily return and the daily change in its implied vol.
Negative: vol rises when the price falls, the signature of a risk asset: people insure against its fall.
Positive: vol rises when the price rises, the signature of a haven: people rush to buy its upside as insurance.
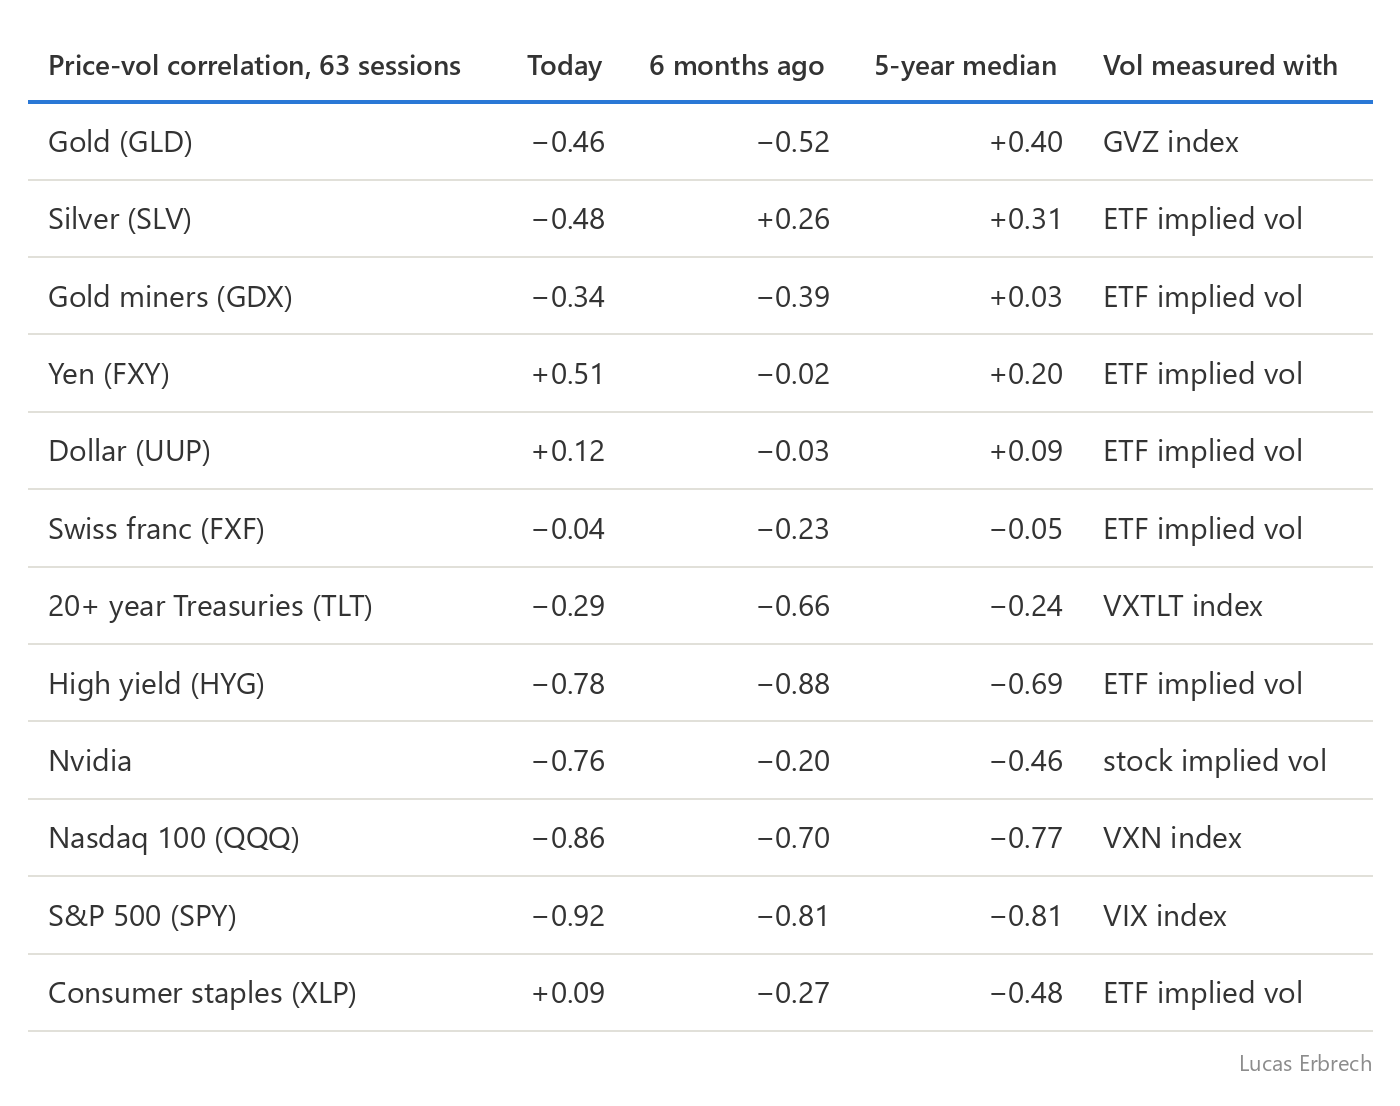
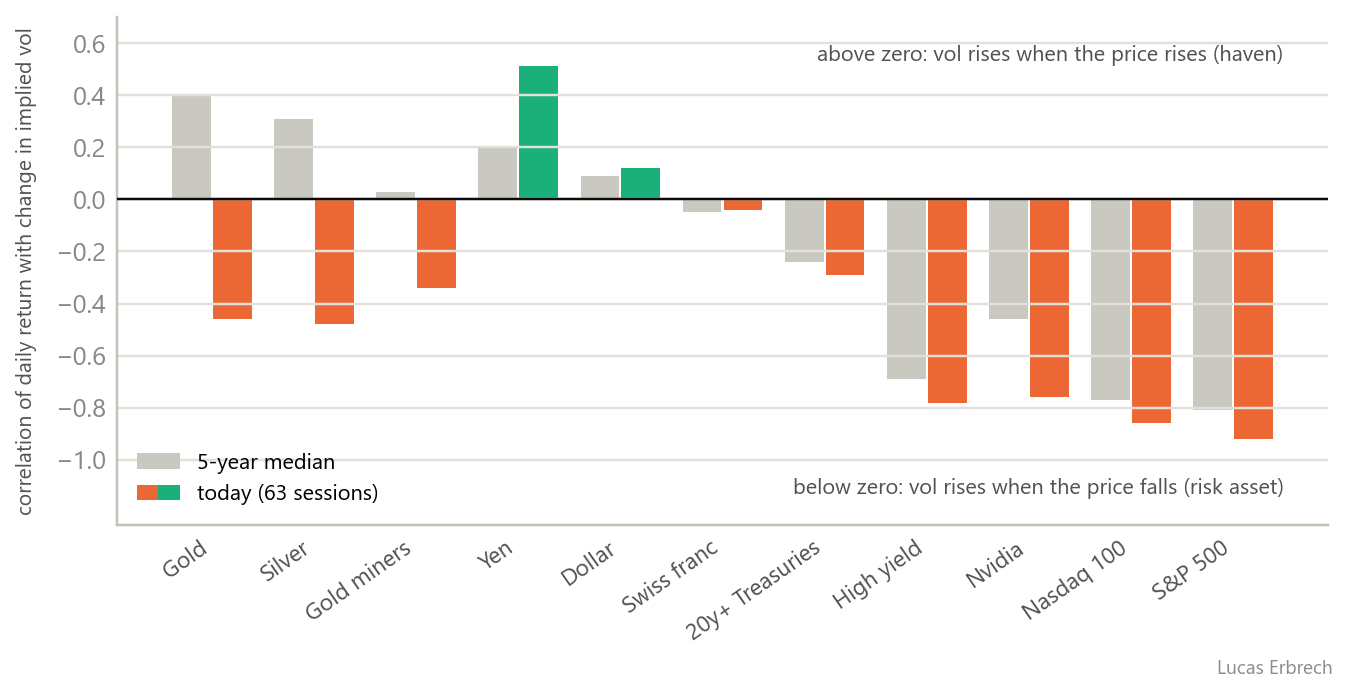
Gold has lost its haven signature, and not recently. At the five-year median its vol rose with its price (+0.40); today, as six months ago, it rises when gold falls (−0.46): the market hedges against its fall instead of buying its upside. Silver has flipped since the spring.
The yen has it. +0.51, against +0.20 at the median and zero six months ago: the strongest positive reading in the table. When the yen rises its options are bought in a hurry, as for an asset people do not yet own.
The Nasdaq and the S&P remain ordinary risk assets. At −0.86 and −0.92, their vol rises when they fall, slightly more sharply than usual.
Staples no longer behave like equities. Their correlation has gone from −0.48 to zero or above: their vol now rises on the days they are bought, not when they fall (section 4.4).
Treasuries remain rate assets. Their vol rises when they fall (−0.29): the perceived risk is a Fed that tightens.
Two cautions. The sign depends on the quote: the yen's +0.51 is measured on the yen in dollars and reads −0.51 in the market's dollar-yen convention; on currency options the link is even stronger, +0.66 over the same 63 sessions. And this link and the skew largely carry the same information: when the smile is higher on one side, at-the-money vol rises mechanically as the price moves that way. Semiconductors have no vol index and my two measures disagree, so I draw no conclusion for them (see Methods).
4.4 On AI sell-off days, dollar and yen vol barely move
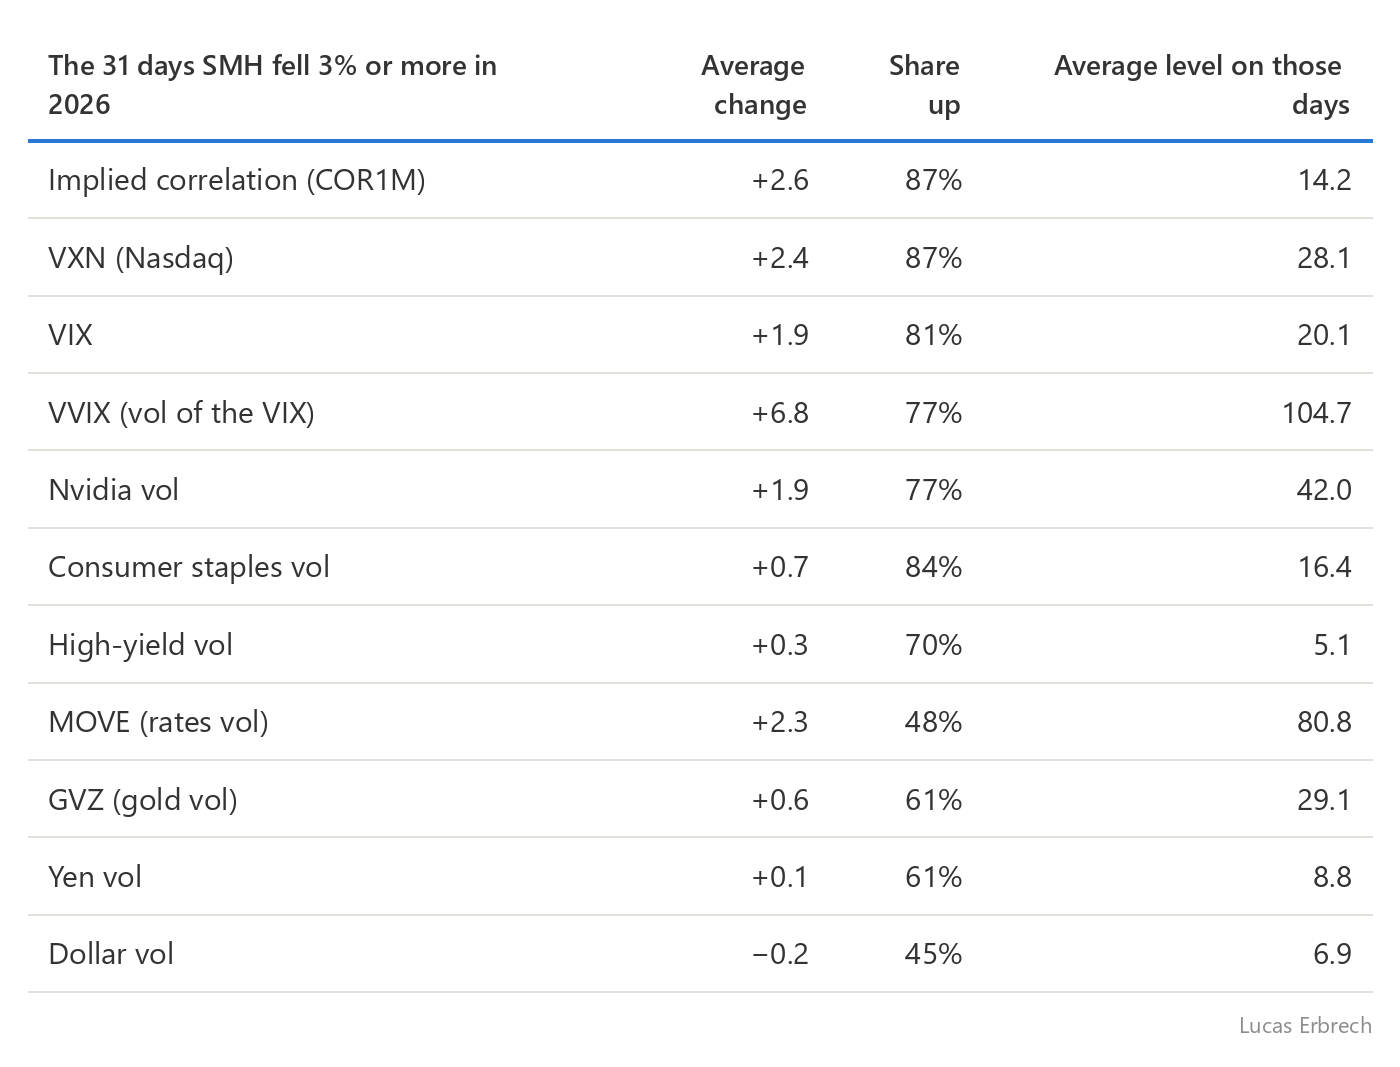
This is a crisis of correlation and equity vol. Implied correlation and Nasdaq vol rise almost every time.
Rates vol follows only half the time. AI sell-off days are not, for now, days of bond stress.
Staples vol rises 84% of the time. They are bought in a panic, so their calls get dearer just when you need them.
Dollar and yen vol barely move (−0.2 and +0.1 point on average): their options can be bought in calm conditions.
4.5 In past crises, dollar vol more than doubled
Five years of implied vol cover three episodes.
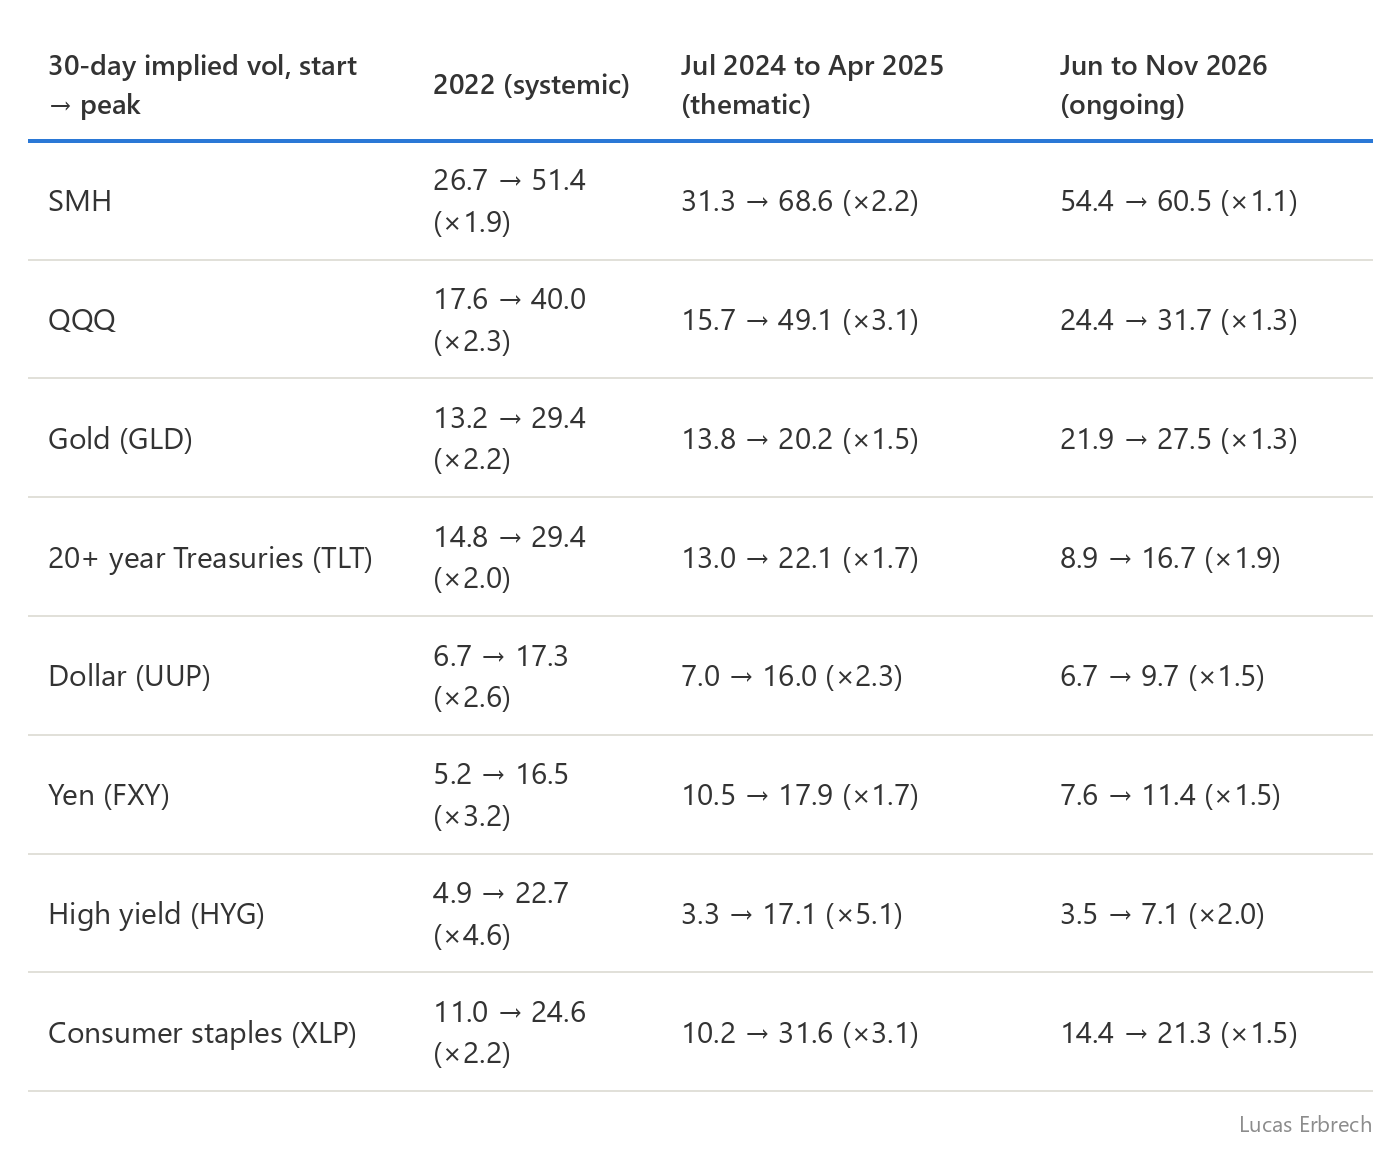
In the two completed crises, dollar and yen vol were multiplied by 1.7 to 3.2. That is where the convexity lies: options bought at around 7% vol saw it climb to 16% to 18% at the height of those crises.
Aug 5, 2024 is the precedent to keep in mind. The yen carry unwind sent one-month yen vol in currency options to 15.6% at the close (17.9% on the yen ETF) on the very day Nvidia's vol hit 90%. An AI position funded in yen unwinds in yen. It was an episode of falling rates: the 2-year had just dropped 38 bp in two sessions, 27 bp on Friday Aug 2 alone.
In the current episode, dollar and yen vol have risen little. Dollar vol peaked at 9.7%, against 16% to 17% in the earlier episodes, and yen ETF vol is back at 8.4%: there is room if the crisis deepens. Long-dated Treasury vol has already nearly doubled (8.9 → 16.7).
4.6 The fear is short-dated, and it is in equities
On Nov 18, intraday, I read each ETF's December and March option chains: at-the-money vol per expiry, the slope between the two (the term structure, "inverted" when the near expiry is dearer) and the 25-delta risk reversal (call vol minus put vol at 25 delta; negative means puts are dearer).
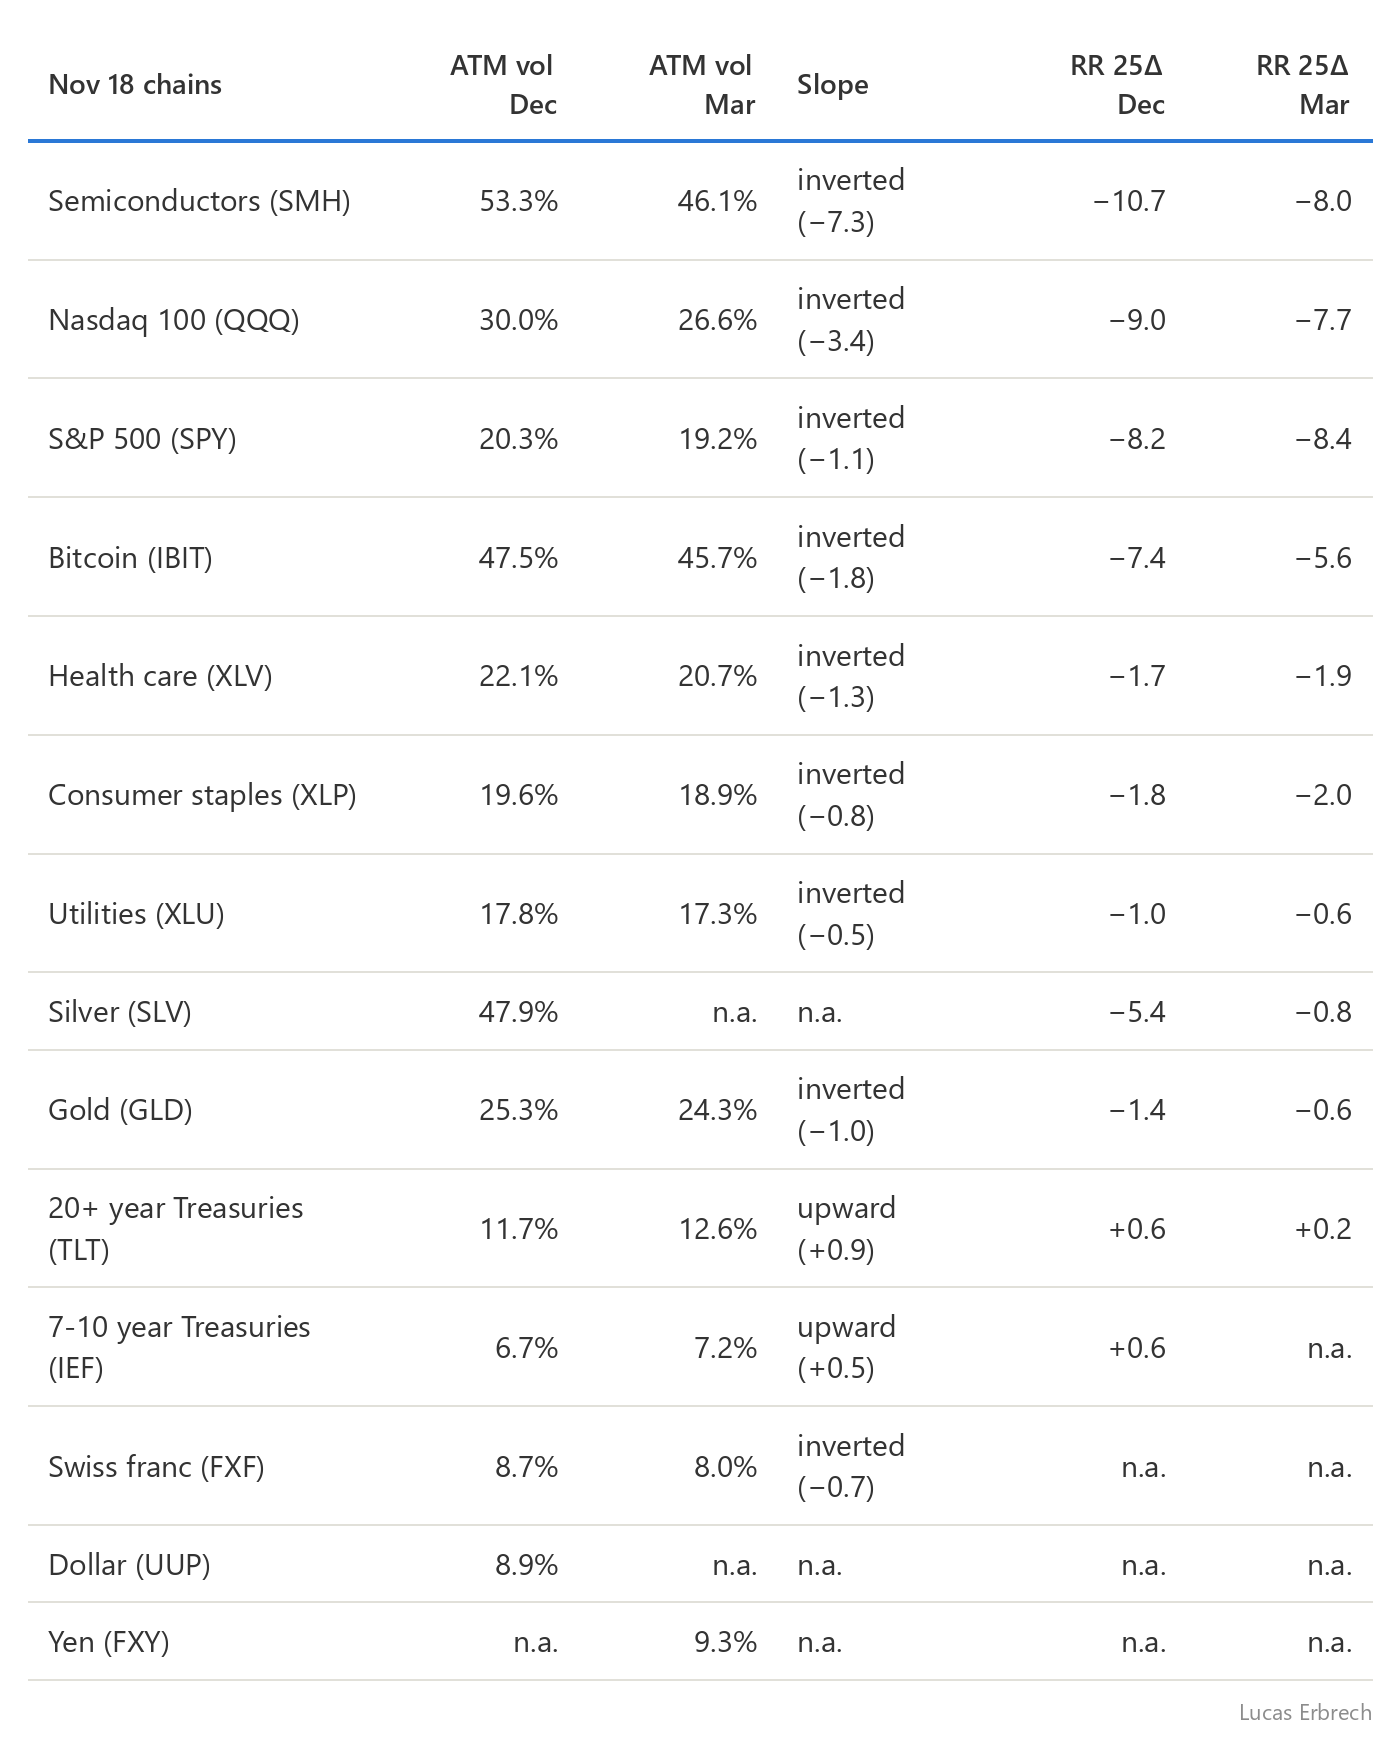
The fear in equities is immediate. On tech as on defensives, December costs more than March, and the skew is already steep at the short end: −9 to −11 points on the Nasdaq and semiconductors. The market is paying for the next four weeks: the Fed, payrolls, inflation and the Dec 18 expiry.
On Treasuries, the skew is flat. Calls are worth only 0.6 point more than puts in December, on TLT as on IEF, and the vol curve slopes upward: the risk is placed further out.
On gold and silver, the skew stays on the put side. In the gold options market, the one-month 25-delta risk reversal is −1.3 (−0.4 on Nov 5), at the 28th percentile of the past year.
The yen is read in currency options, not on its ETF, whose options are too thinly quoted (four priced on the December expiry, a single put bracketing 25 delta on March); UUP strikes are too far apart for a skew. In dollar-yen options on Nov 17:
one-month vol is 6.9%, at the 15th percentile of the past year;
the one-month 25-delta risk reversal is 1.6 points in favor of yen calls (−1.6 in the dollar-yen convention), down from 2.0 on Nov 5;
the curve slopes upward: 5.7% at one week, 6.9% at one month, 7.1% at two months, 7.4% at three.
So the market already pays a little for a stronger yen and places the move further out. The one-week option is the cheapest point on the curve because it holds no event: the forward vol rises to about 7.25% for weeks two to four (payrolls on Dec 4, the Fed on Dec 9), 7.3% for the second month and 8.0% for the third. A one-month option bought on Nov 17 expires before the Bank of Japan's Dec 18 decision; covering both meetings takes at least five weeks. And cheap means cheap against its own history, not against today's moves: one-month implied vol is only about half a point above the yen's realized vol over the past 21 sessions.
5. What history says, and what it cannot say
I took every fall of at least 15% in the Nasdaq and at least 20% in semiconductors since late 2001, from peak to trough. Merging overlaps leaves eleven: ten completed, plus the current one.
Episodes are usually sorted by size. I call one "systemic" when the S&P itself lost 20% or more from its one-year high, the usual definition of a bear market, and the others thematic. Size says nothing about the cause or what the Fed was doing, so I add the cause, the type of default at stake and the change in the 2-year yield from start to end.
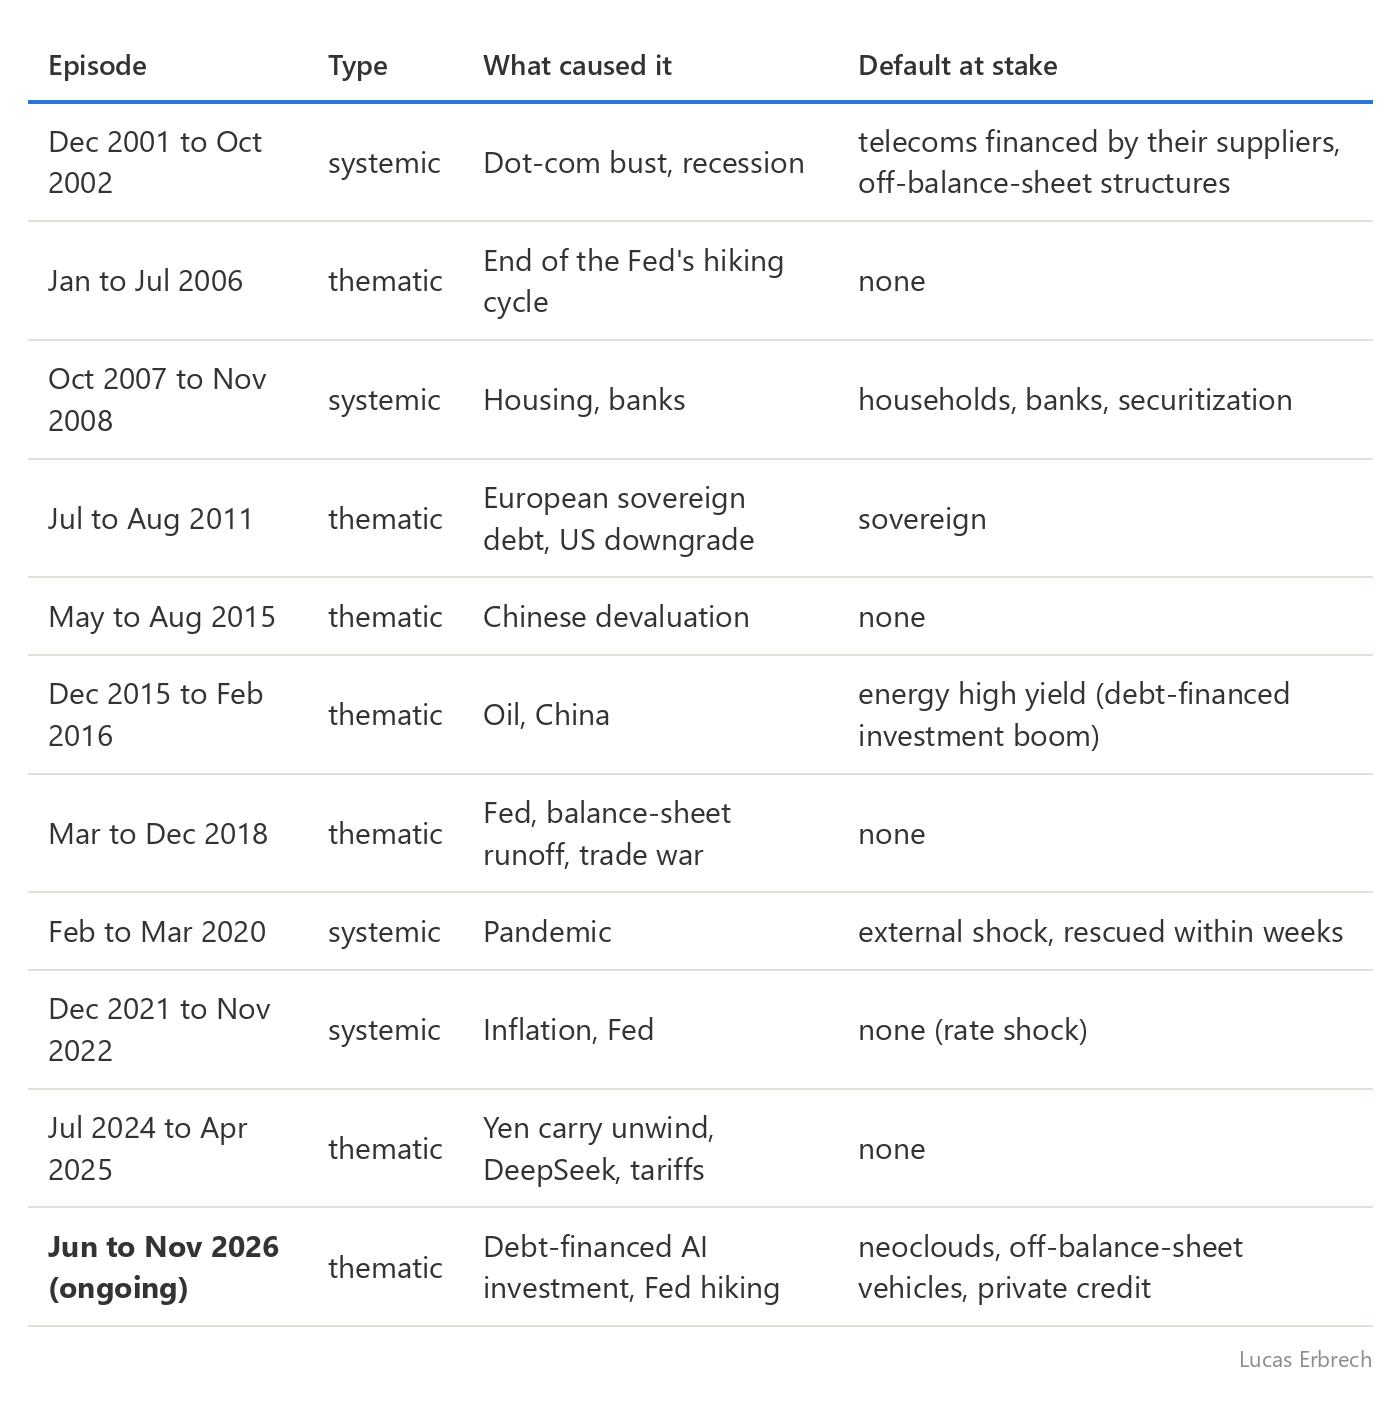
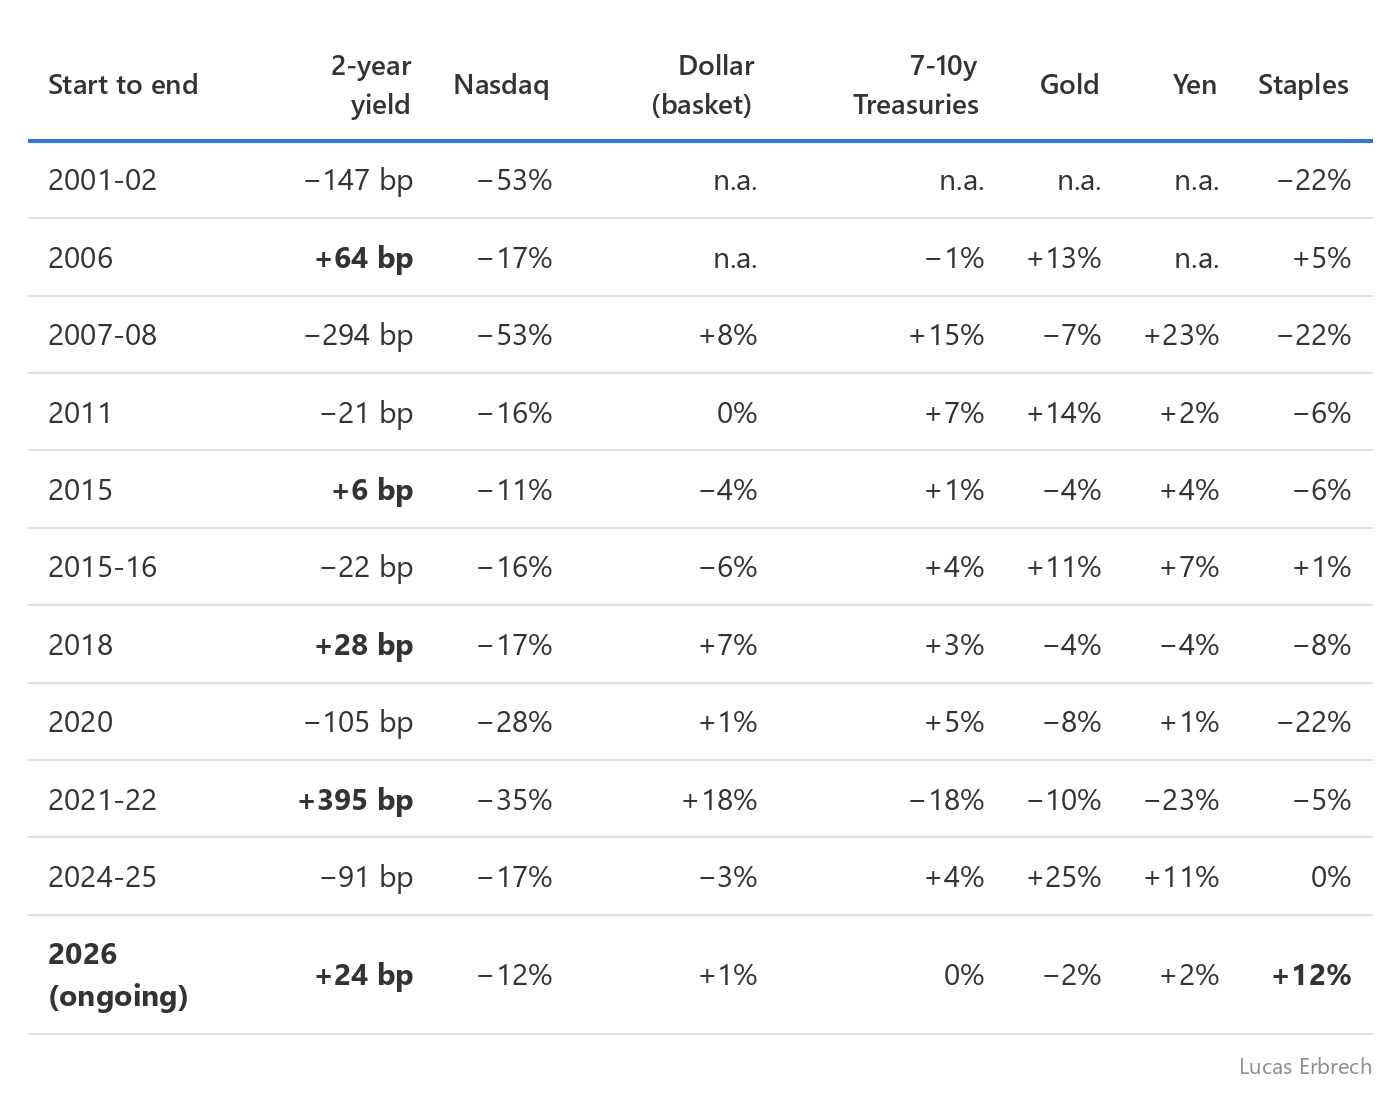
The current episode is shown but left out of the medians: we do not yet know where it ends.
5.1 By size: in a systemic crisis, the dollar first
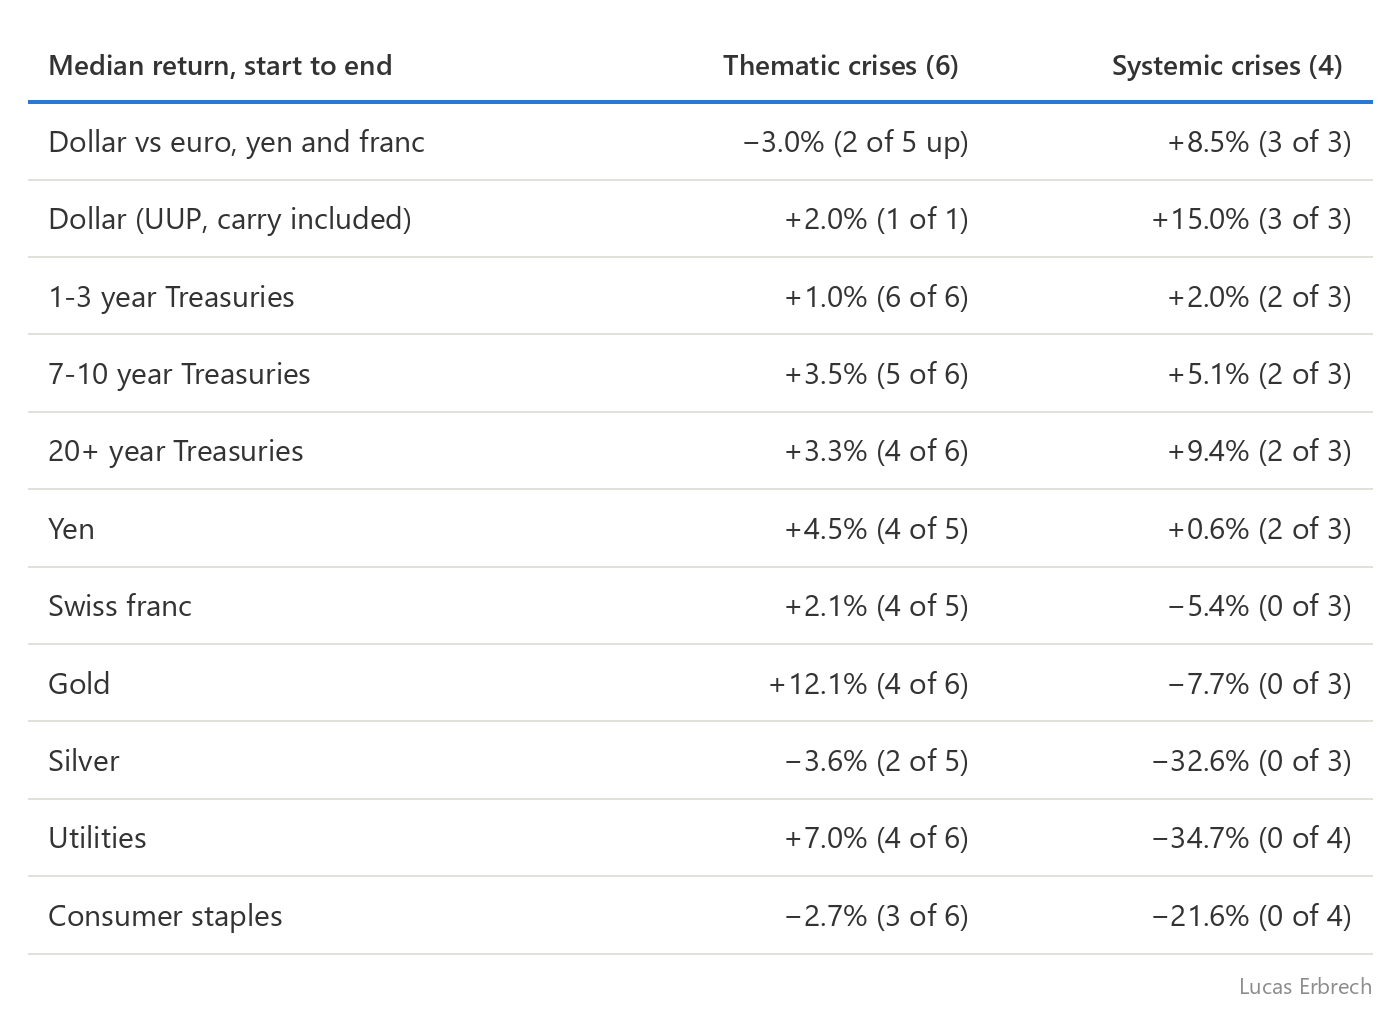
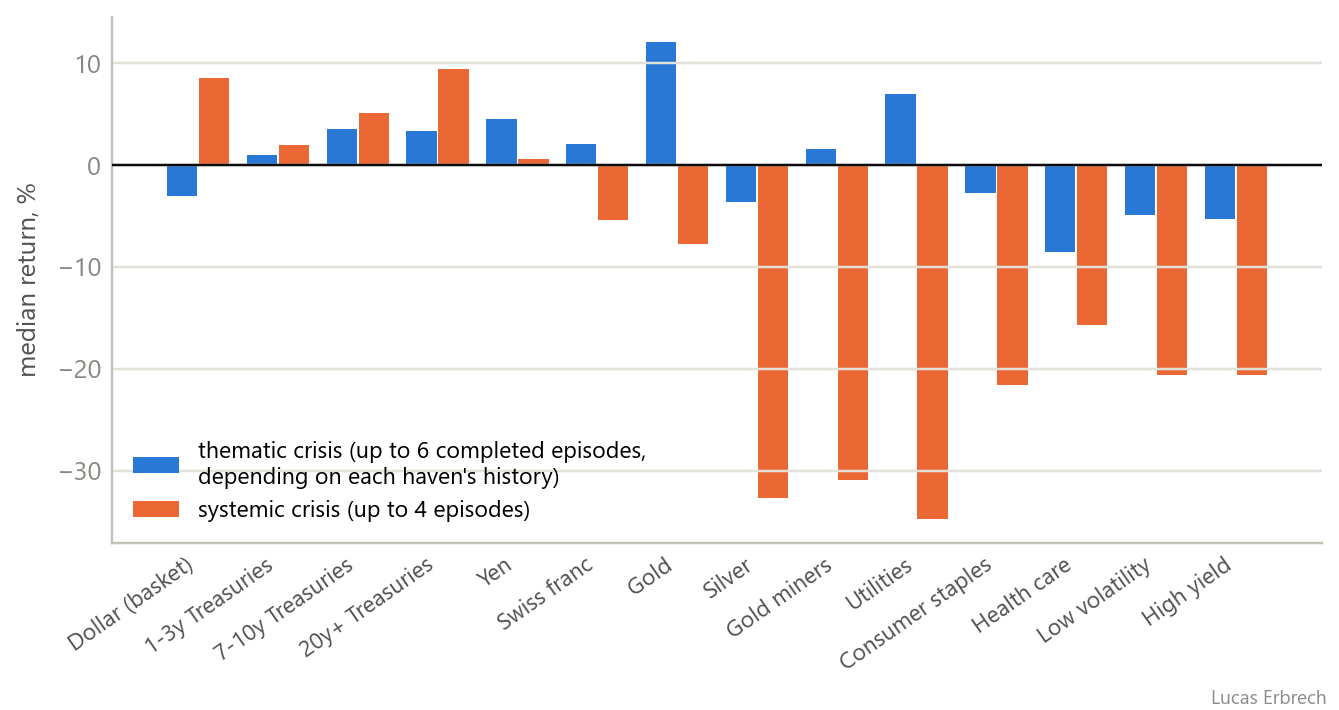
What the size split says:
In a thematic crisis, short-dated Treasuries, gold and the yen protected. Gold was the best (up four times out of six); the dollar did nothing, falling against the euro, yen and franc in three of the five.
In a systemic crisis, the dollar alone rose every time, three out of three. Treasuries and the yen rose two times out of three, except in 2022, under a tightening Fed. Gold fell in all three systemic crises in which it traded; silver, defensives and credit fell every time.
Staples are not a historical haven. −2.7% at the median in thematic crises, −21.6% in systemic ones. Their +12% of 2026 is an exception.
The split is fragile at the margin. 2018 (−19.3% for the S&P) and 2024-25 (−18.8%) sit about a point from the 20% threshold.
5.2 By rate regime: when the 2-year rises, only the dollar is left
The same episodes, cut another way: on the left, the six in which the 2-year yield fell (the Fed was easing, or the market expected it to); on the right, the four in which it rose (2006, summer 2015, 2018, 2022). The current episode belongs on the right (+24 bp from Jun 22 to Nov 5), even though the 2-year has plateaued since late September.
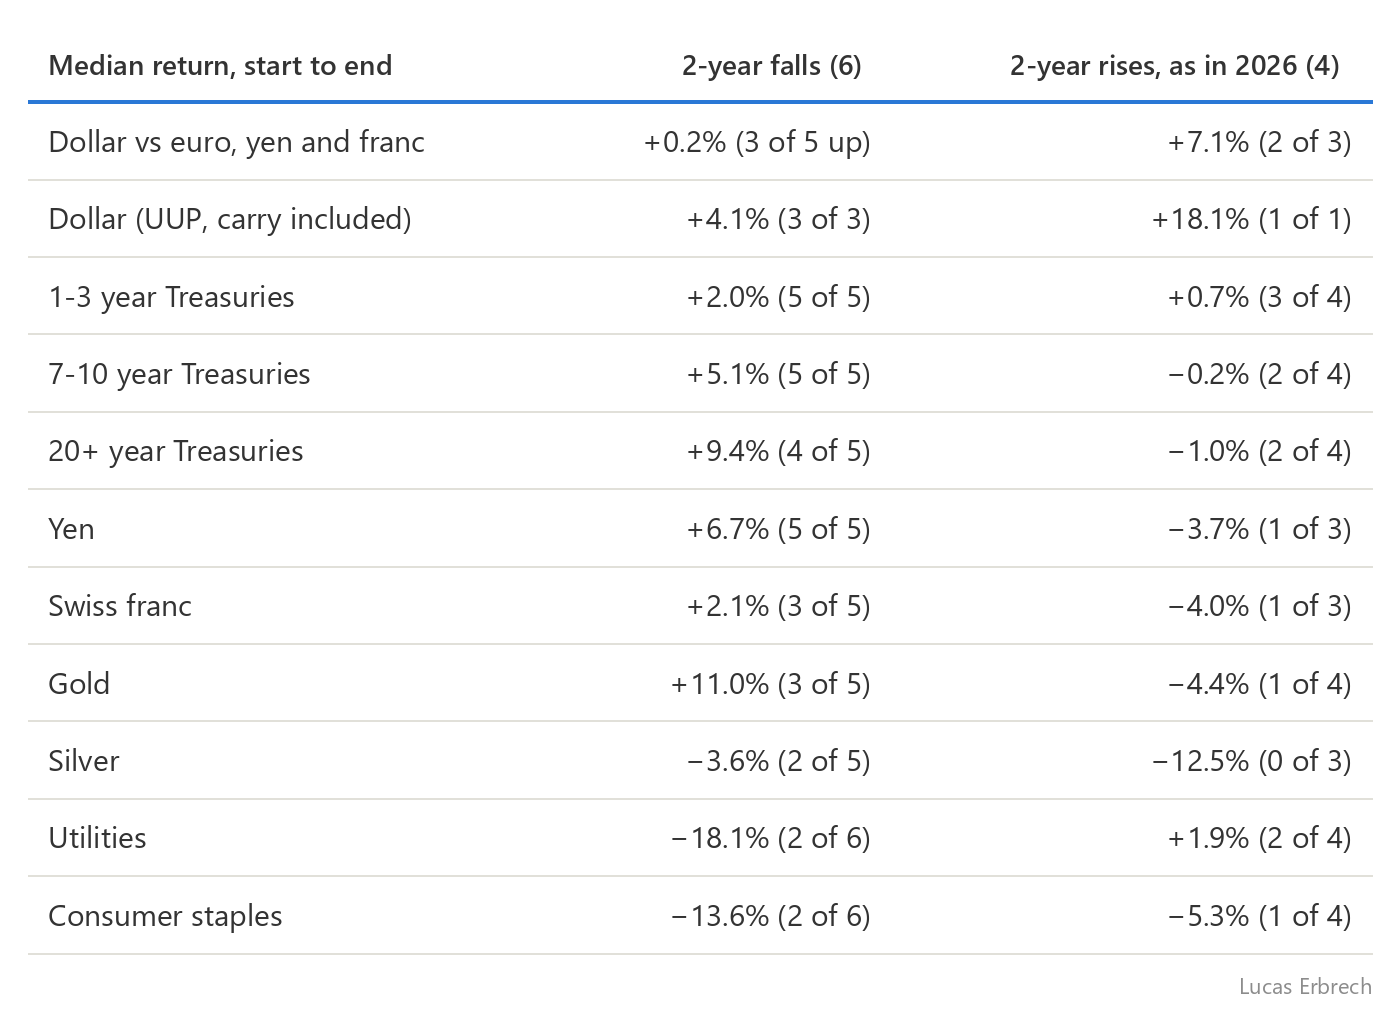
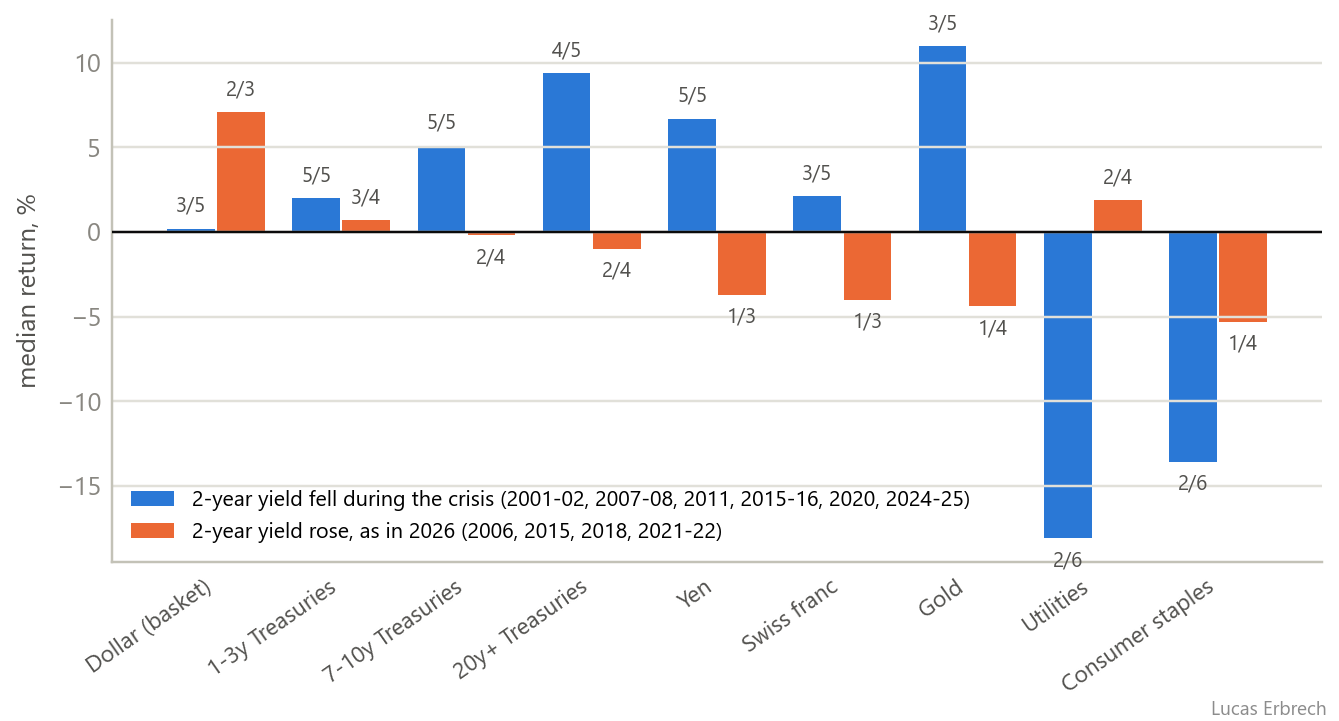
What the rate split changes:
Gold has not changed its nature in 2026. When the 2-year rose during a tech crisis, gold fell three times out of four in this split. Its +12% "in thematic crises" came mostly from episodes of falling short rates (2011, 2015-16, 2024-25), 2006 being the only exception. Its current fall fits the history of its regime.
The yen is the haven most dependent on the Fed. Five rises out of five when the 2-year fell: the rate gap narrows and the carry trade unwinds. One out of three when it rose: the carry is still paid, and the yen serves as a funding currency.
The dollar is the only clear winner in the right-hand column. +7.1% at the median against the euro, the yen and the franc: it rose in 2018 and 2022, and fell in summer 2015, when the 2-year gained only 6 bp. 1-3 year Treasuries (+0.7%) and utilities (+1.9%) barely hold.
Long-dated Treasuries do not protect when the Fed hikes. Two times out of four, and −34% for TLT in 2022. Short-dated ones, with little duration, do better: a Treasury fund only loses over a year if yields rise by more than its yield divided by its duration, roughly 250 bp for 1-3 year notes today, 70 bp for 7-10 year notes and 30 bp for long bonds.
How robust is this? Less than the medians suggest, for four reasons.
Treasuries rising "five times out of five" when the 2-year falls is close to automatic: a Treasury fund gains when yields fall. The informative results are for gold, the yen, the dollar and defensives.
Each cell rests on one to six episodes, three to six for most. Five out of five for the yen has about a 3% chance of happening by luck; three out of four for gold, about 31%.
Start and end dates are known only after the fact. In 2021-22 the Nasdaq made two near-identical lows, on Nov 3 and Dec 28, 2022: measured to the first, gold lost 10.4%; to the second, 0.9%.
The split itself matters. With the usual rule (a running peak, then the lowest close before that peak is regained), semiconductors had a single drawdown from May 2015 to February 2016, with the 2-year up 4 bp, and the Nasdaq's 2018 fall (Aug 29 to Dec 24) came with the 2-year down 12 bp; on those two windows gold rose 4.3% and 5.1%. Two of the four "rising 2-year" episodes, and so "three times out of four", depend on the rule.
Medians also hide the spread: in the rising-yield column, gold ranges from −10% (2021-22) to +13% (2006). The regime is also partly a consequence of the crisis: in December 2015 the Fed had just raised rates, and it was the sell-off that pushed the 2-year down.
5.3 The type of default: the two useful precedents are the least measurable
None of the ten crises involved the kind of default the AI circuit is setting up, which must be said before using the medians.
The episodes that weigh most in the numbers have nothing to do with it. 2008 was a bank and housing credit crisis, 2020 an external shock rescued within weeks by the Fed and the Treasury, 2022 a rate shock without defaults.
Two episodes share the mechanism: a debt-financed investment boom that turns.
2001-02, telecoms. Equipment makers financed their customers' purchases of their gear, and part of the debt sat off balance sheet: the ancestor of circular financing. But almost no haven in my data traded yet; only staples (−22%), health care (−7%) and utilities (−45%) can be measured. The 2-year lost 147 bp.
2015-16, energy. Energy high yield had financed shale oil, and the oil price broke. The 2-year fell 22 bp. Gold gained 11%, the yen 7%, 7-10 year Treasuries 4%. The dollar lost 6% against the euro, the yen and the franc.
In both cases, short rates fell. A default crisis ends up stopping the central bank. That is the most serious argument against too simple a reading of section 5.2: if AI credit really breaks, the rate regime may well flip, and the havens with it.
In plain English. As long as AI deflates under a hiking Fed, history says the dollar. If credit breaks and the Fed stops, it says Treasuries, the yen and gold. The switch shows up in the 2-year yield, not in the Nasdaq. And these conclusions rest on one to six measurements per cell, three to six for most, none of them from an AI crisis.
6. The AI circuit: money going round in circles
Whether an AI crisis stays thematic depends on where the money flows, and for a year it has gone round in circles.
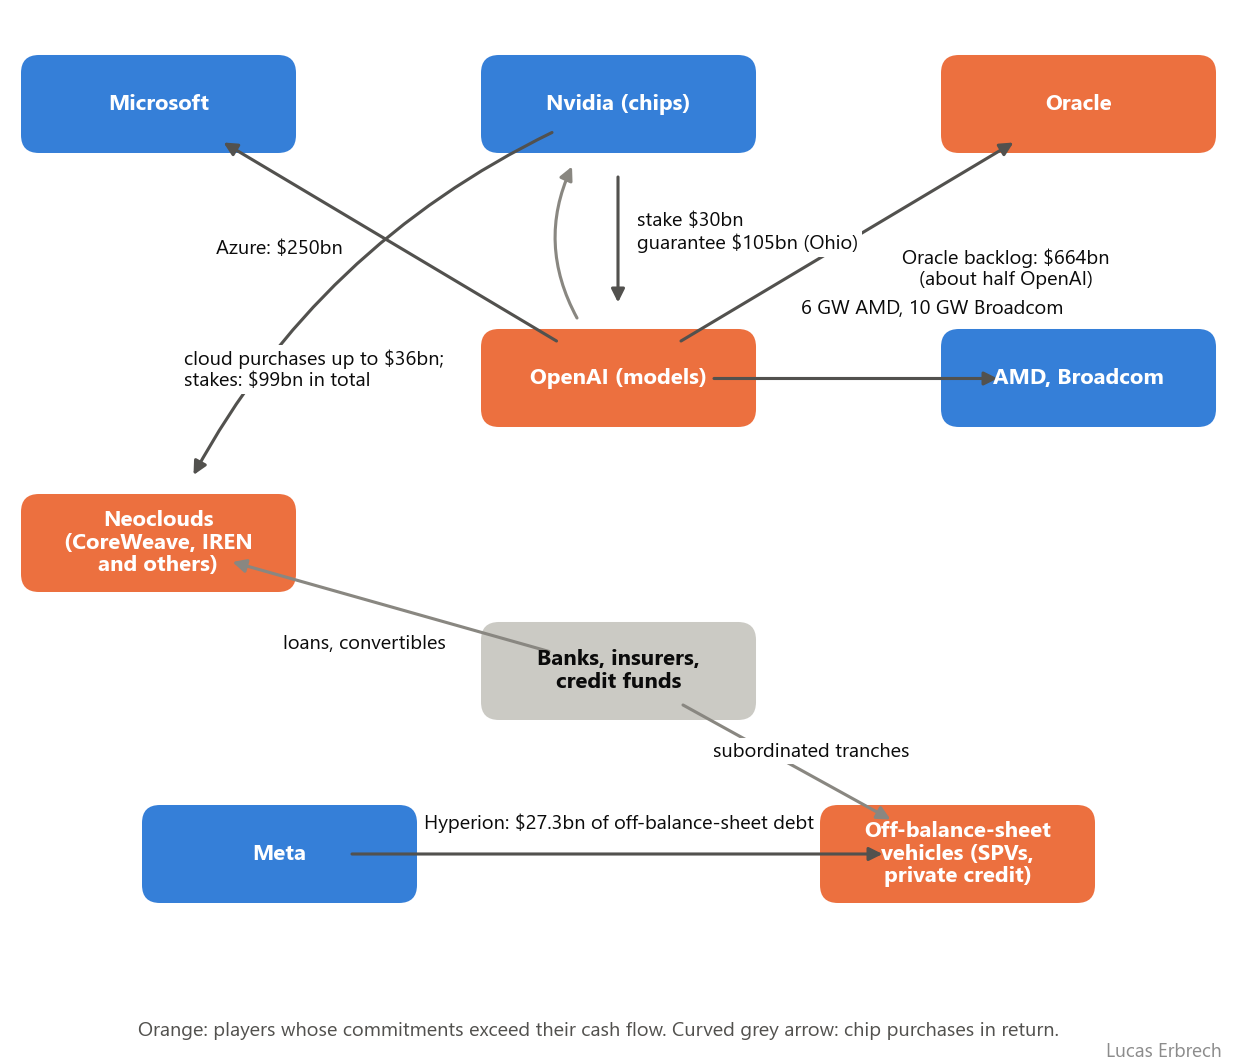
Nvidia to its customers.
Nvidia holds $99bn of stakes in companies (about $7bn a year earlier, per a CNBC tally of its July report), the largest in OpenAI: $30bn.
That report shows a maximum guarantee of $108.5bn, of which $105bn covers a data-center campus leased by OpenAI in Ohio.
Nvidia has committed to buy up to $36bn of cloud services from the "neoclouds" (GPU cloud providers such as CoreWeave and IREN), which buy its chips.
Columbia professor Stijn Van Nieuwerburgh, quoted by CNBC, puts its total obligations at about $400bn.
OpenAI to its suppliers.
OpenAI's compute purchase commitments are between $600bn and $730bn; press tallies do not agree.
They include $250bn of Azure services (Microsoft) and contracts with AMD (6 GW, with warrants on AMD shares), Broadcom (10 GW) and Amazon.
Oracle's backlog reached $664bn at Aug 31, about half reportedly tied to OpenAI.
Off-balance-sheet structures. Meta finances its Hyperion campus through a vehicle 80% owned by Blue Owl, which issued $27.3bn of debt outside Meta's balance sheet, and guarantees the campus's residual value for sixteen years.
Recent signs of strain.
Jensen Huang stepped down as Nvidia's chief executive and left its board on Nov 12. The CFO, Colette Kress, is interim CEO.
CoreWeave's five-year credit default swap rose 51% from Oct 1 (854 bp) to a record 1,289 bp on Nov 5.
An IREN convertible bond due 2029 lost 23% from Nov 3 to Nov 5.
SoftBank reported a $7bn quarterly loss, $3.7bn of it from revising its purchases of electrical equipment for US data centers.
In plain English. In a circular circuit, one company's revenue is financed by another's money. As long as everyone grows, the circuit feeds on itself; if one link stops paying, the loss travels back to whoever financed it. The Fed's Financial Stability Report of Nov 13 notes that the big groups could absorb the losses, but their real exposure could be "significantly larger" than their balance sheets show.
7. Balance sheets: the hyperscalers spend everything they generate
According to the Fed, publicly issued debt linked to advanced computing exceeds $1.1 trillion, all issuers combined. For seven groups (Alphabet, Amazon, Broadcom, Meta, Microsoft, Nvidia, Oracle), it adds more than $1 trillion of leases signed but not yet commenced and more than $2 trillion of firm purchase contracts and guarantees, neither shown as debt; the Fed notes they are undiscounted, so not directly comparable with it. I went through the accounts one by one.
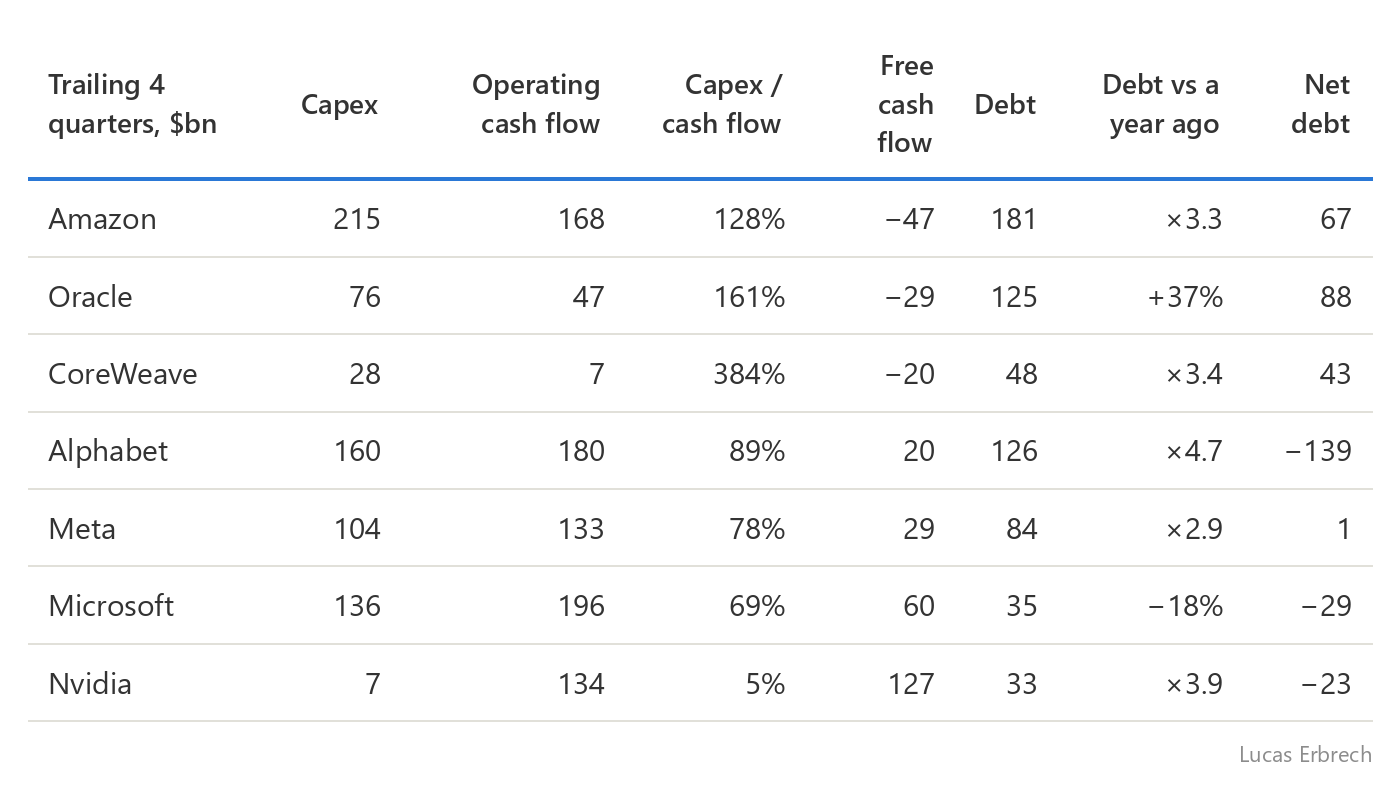
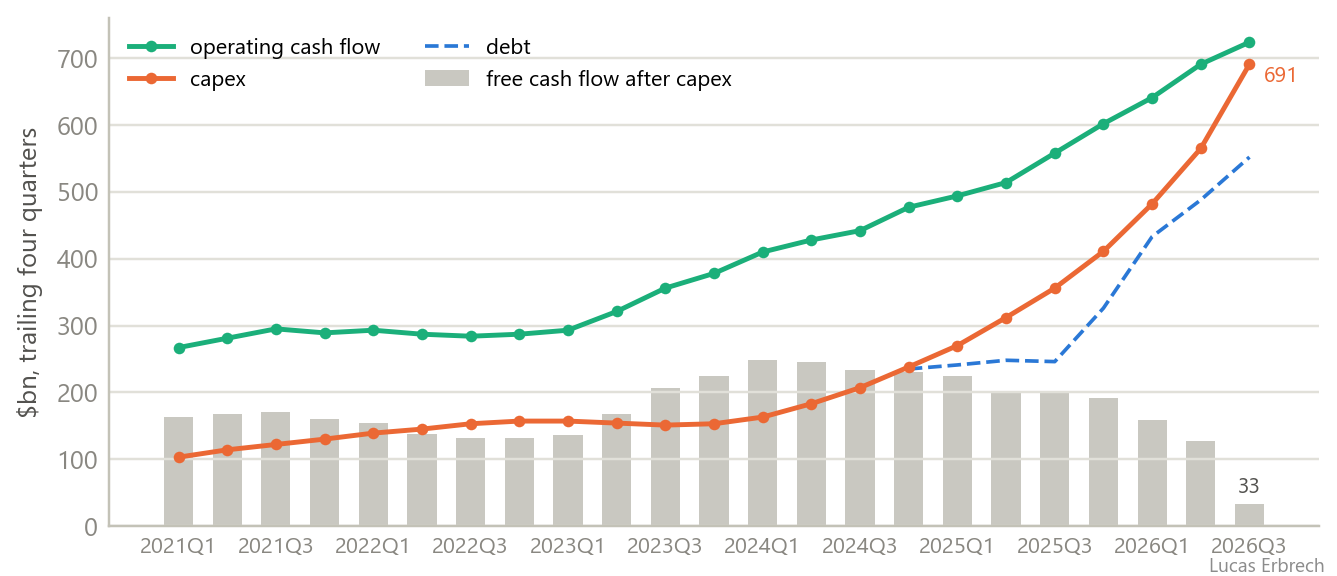
For the five hyperscalers combined:
They spend almost everything they earn. Capex is 95% of operating cash flow, against 41% at the end of 2023, when free cash flow was $223bn; it is now $33bn.
Debt has doubled, from $262bn at the end of 2023 to $552bn ($422bn to $851bn on a broader measure that includes leases). Until the summer of 2025, cash flow was enough; it no longer is.
Counting finance leases, nothing is left. Assets taken on finance leases are investment that bypasses capex: $32bn over four quarters. Including them, investment reaches 100% of operating cash flow, and free cash flow falls to $1bn.
Commitments in the accounts:
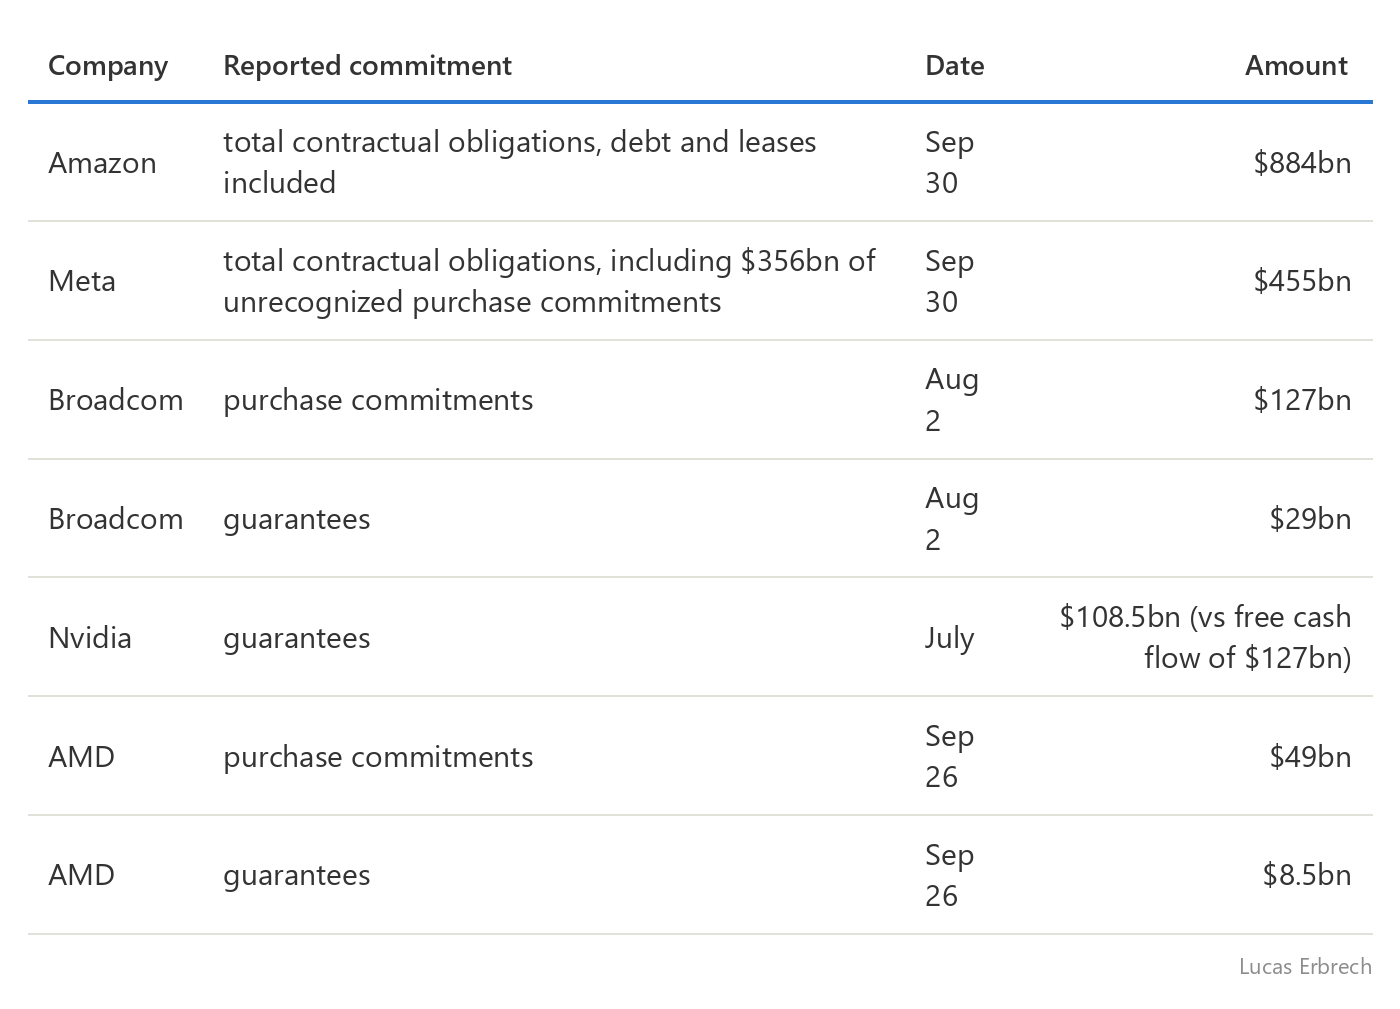
Who holds the risk. According to the Fed:
big-company debt is held mostly by mutual funds, pension funds and insurers;
the riskiest tranches of the off-balance-sheet vehicles sit with high-yield funds, life insurers, BDCs (listed lenders to private companies) and private credit;
large US banks have nearly $1 trillion of exposure to the circuit: big tech groups, data-center developers, dedicated vehicles, private credit and utilities.
In plain English. The risk is not where people look for it. Microsoft, Alphabet and Nvidia have more cash than debt, Meta is at breakeven, and Amazon, Oracle and CoreWeave spend more than they generate. Most of the commitments, more than $3 trillion on the Fed's two figures combined, are not on the liability side of any balance sheet.
8. Debt: the weak link has already crossed the threshold
Volume. According to the Fed, debt issued to fund advanced computing exceeded $680bn in 2026 through October, five times the $130bn of all of 2023 and about 31% of investment-grade non-financial corporate bond issuance, against less than 6% in 2023. (On depreciation, see CrossVol Research's The AI Depreciation Bomb: The Chips Last Three Years, the Loans Last Ten, Nov 5.)
Price. The market already tells good borrowers from bad ones:
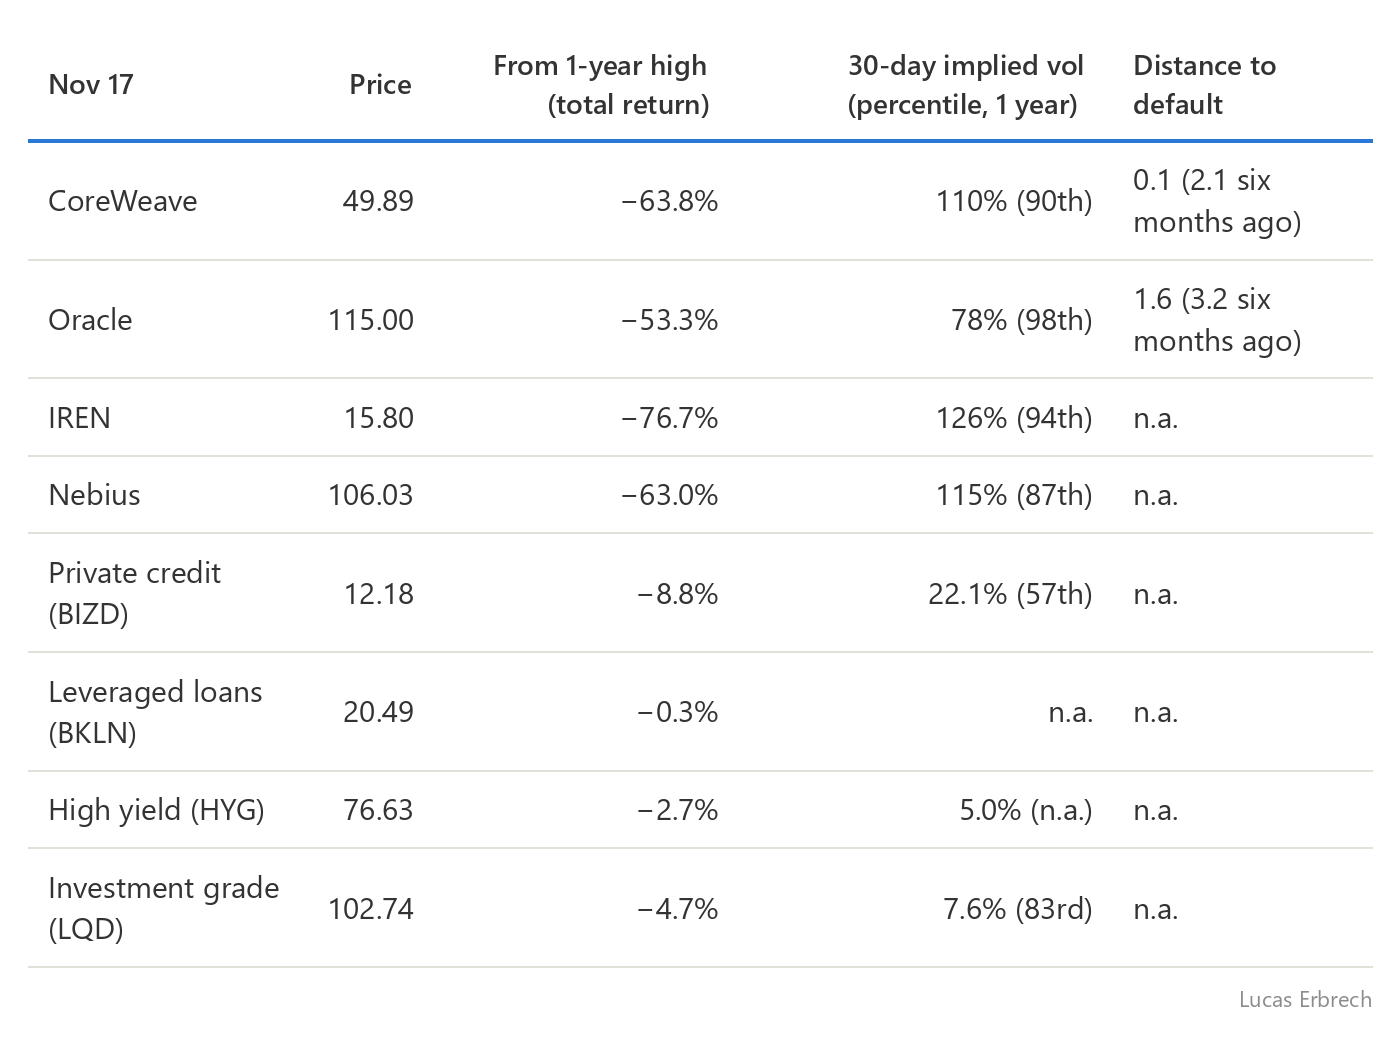
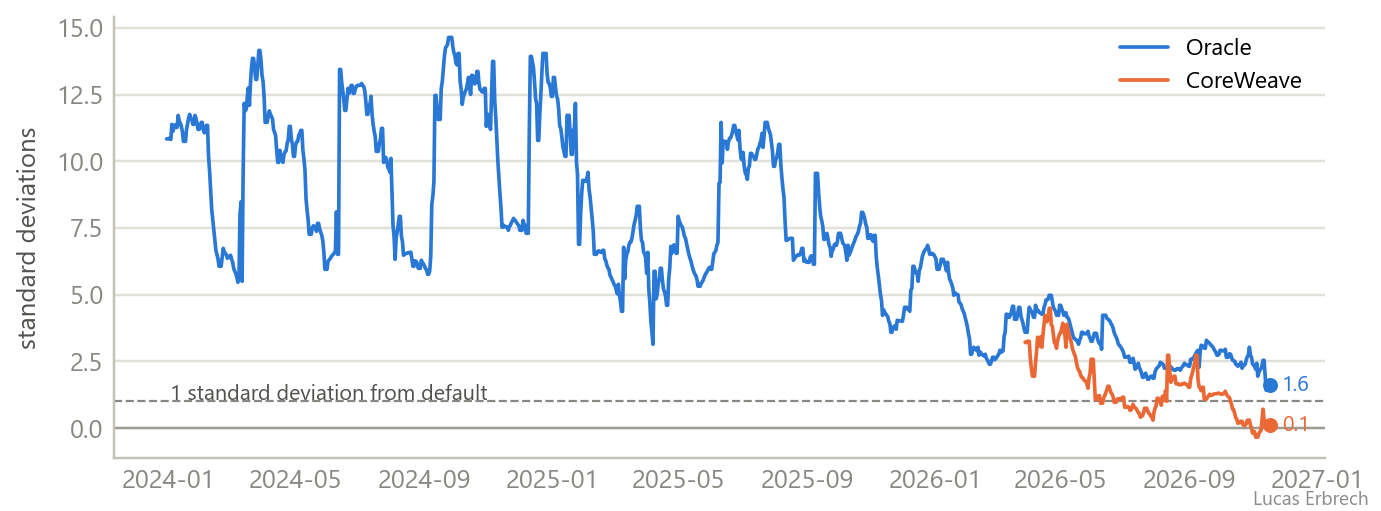
Distance to default measures, in standard deviations, how far a company's value stands above its debt. Under the model, the chance of default within a year is the normal tail beyond it: about one in six at 1, 46% at 0.1. That is a model's reading, not a market price. I use the "naive" version of Bharath and Shumway (2008): debt due within a year plus half the rest, with the stock's one-year return as the drift. That term weighs most today (CoreWeave has lost 36% over a year, Oracle 48%), so the figure depends on the method:
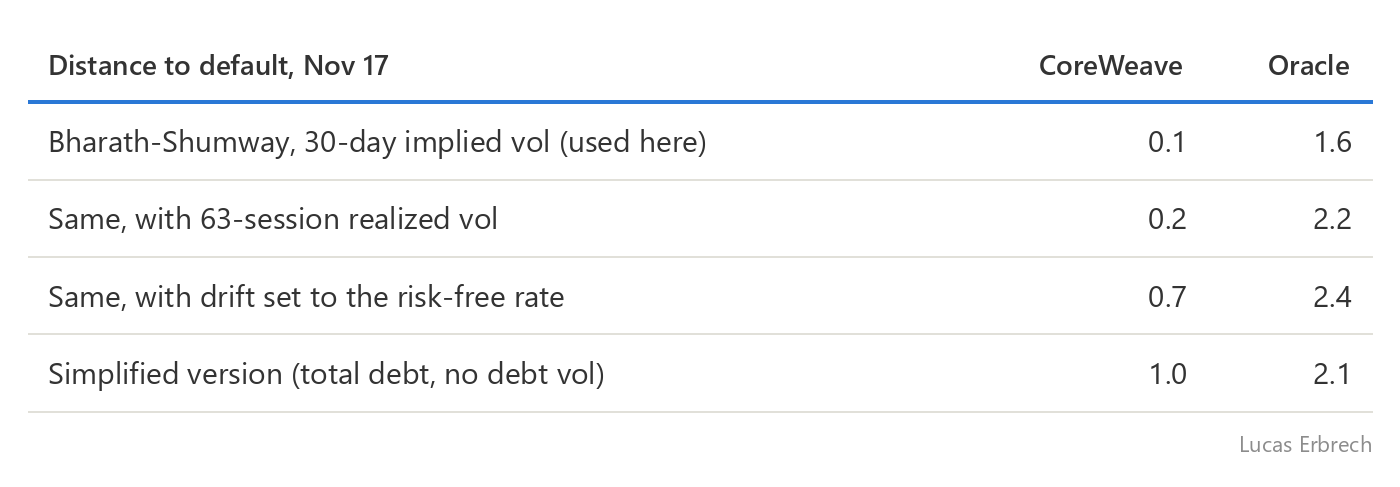
CoreWeave is between 0.1 and 1.0 depending on the method, below the threshold in three cases out of four. On the measure used here, it has been below 1 without a break since Oct 12 and was negative from Nov 2 to Nov 10 (−0.35 at the low, on Nov 5). With $11bn of debt due within twelve months against $4.2bn of cash, it depends on rolling over its financing.
What the credit market says. CoreWeave's five-year CDS is at 1,152 bp: with a 40% recovery, that is roughly a one-in-six chance of default within a year (13% to 18% depending on the slope of the curve) and about 60% over five years. These are risk-neutral odds, which include a risk premium. A standard structural default model, calibrated on equity and balance sheets, gives 12% at one year, up from 4.5% in May. Oracle's CDS is at 316 bp (249 bp on Oct 1), about 6% at one year on the same basis, against 0.6% in the same model, up from 0.1%.
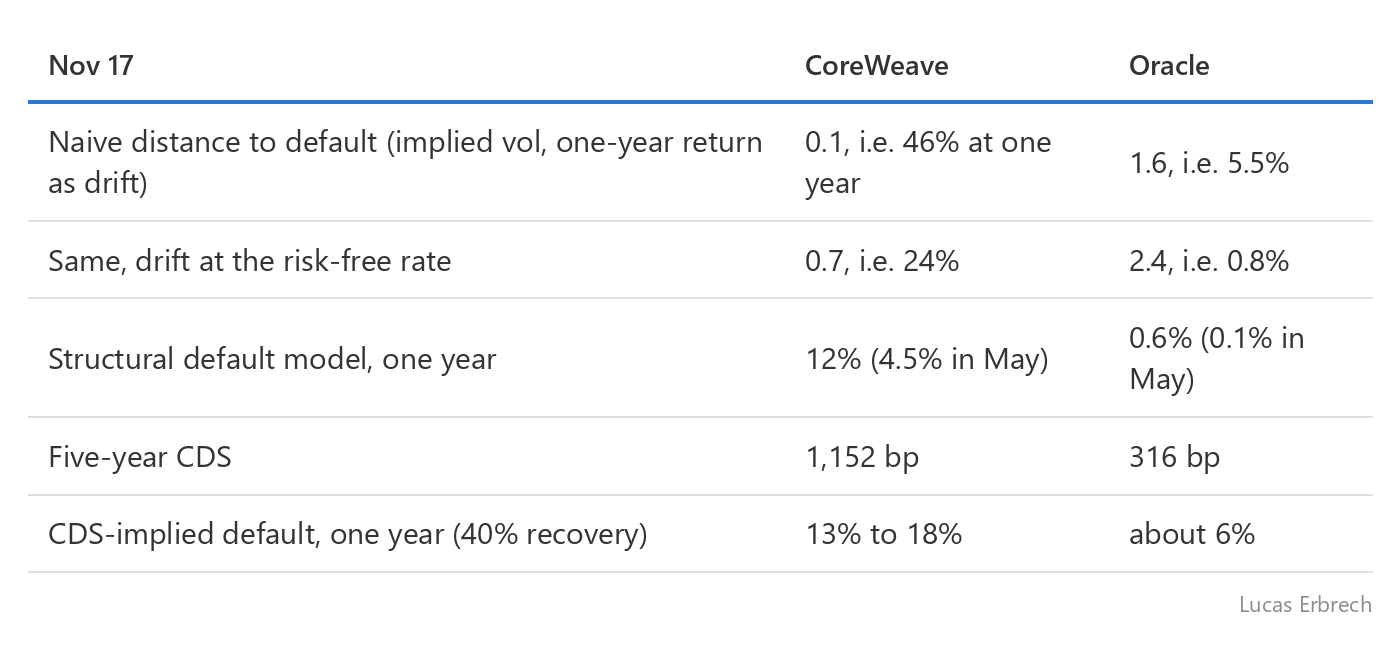
The naive measure overstates the market's reading for CoreWeave about threefold, mostly through its drift: the stock's 36% fall over a year enters twice, in the equity value and as the expected return. Its default point also leaves out leases, debt in all but name for a neocloud (CoreWeave had $18.7bn of lease liabilities at Sep 30, next to $47.5bn of debt). The conclusion holds all the same: the circuit's weakest borrower is priced at stress levels, and the trend is what matters.
Oracle is between 1.6 and 2.4. It averaged 9.8 in January and February 2024 and stood at 4.4 in mid-November 2025; its 30-day vol includes its mid-December results, which pulls the figure down. It repays $7bn within twelve months and $10bn the year after, and issued $10bn of bonds on Nov 2 at spreads well wider than in February.
Credit as a whole is strained, but not yet broken.
The high-yield option-adjusted spread is 3.37%, at the 98th percentile of the past year, and the spread of the lowest-rated bonds (Caa) is 11.1%, at the 97th.
Leveraged loans are holding (−0.3% from their high).
Listed private credit (BIZD) is 8.8% below its one-year high in total return (19% on price alone), but has lost only 2.0% since Sep 28.
The Fed notes that the private-credit default rate has reached the top of its historical range, a history it calls short.
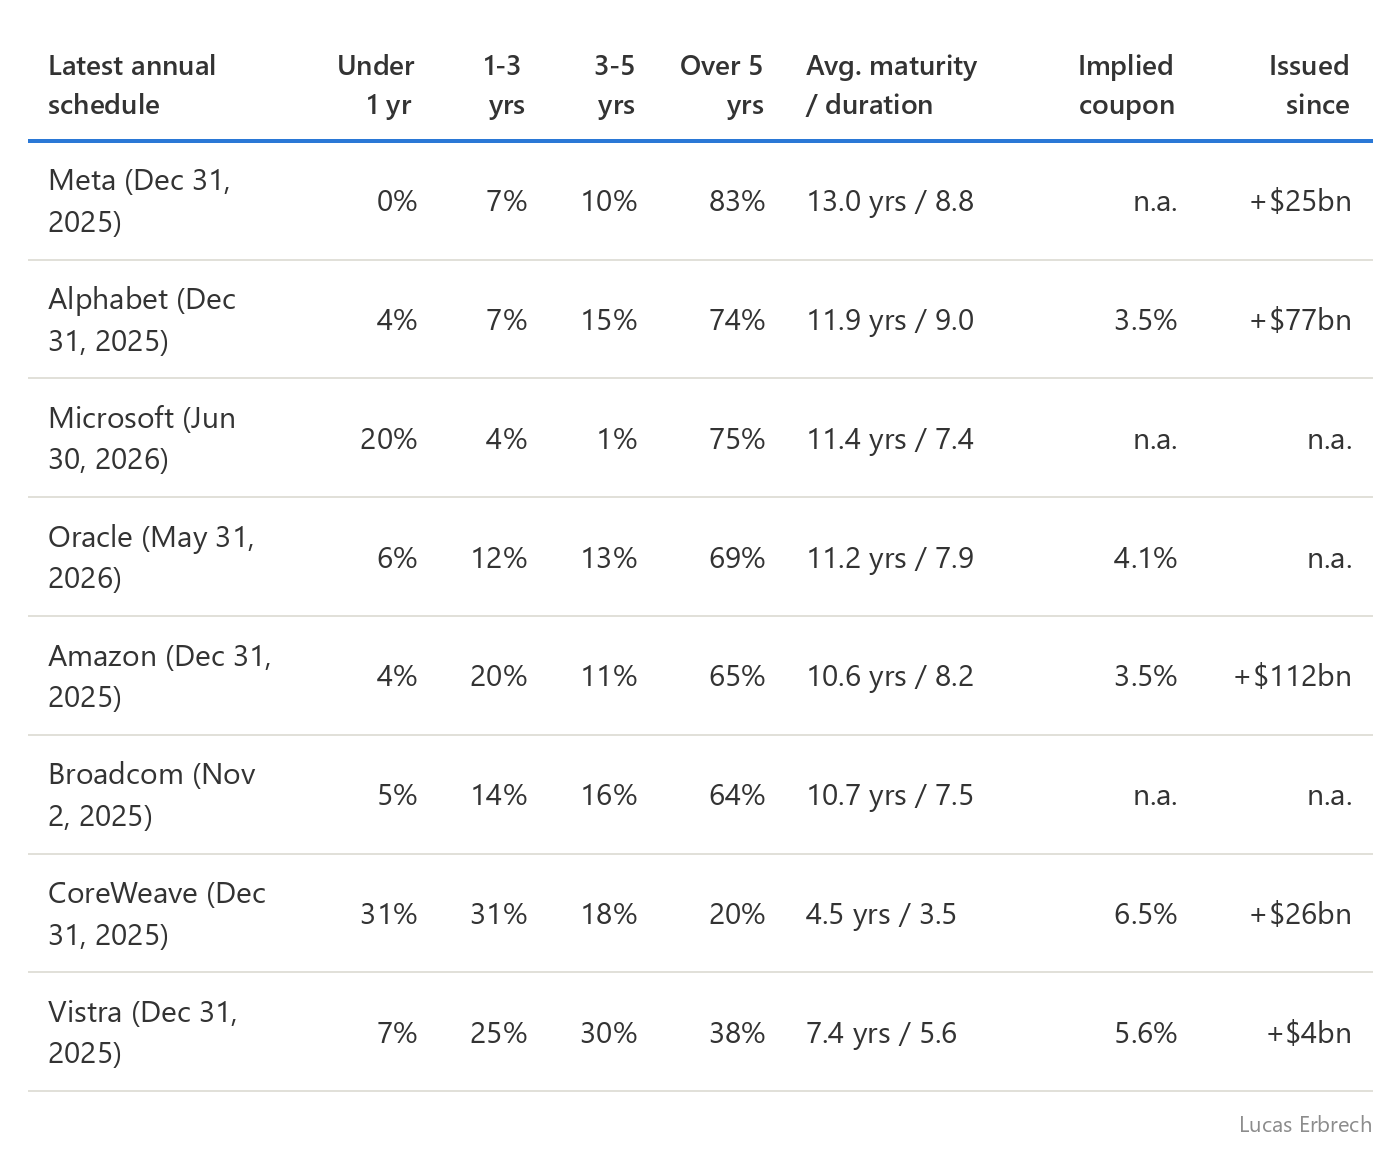
Maturities: who carries the rate risk, who carries the refinancing risk. From each company's latest full maturity schedule:
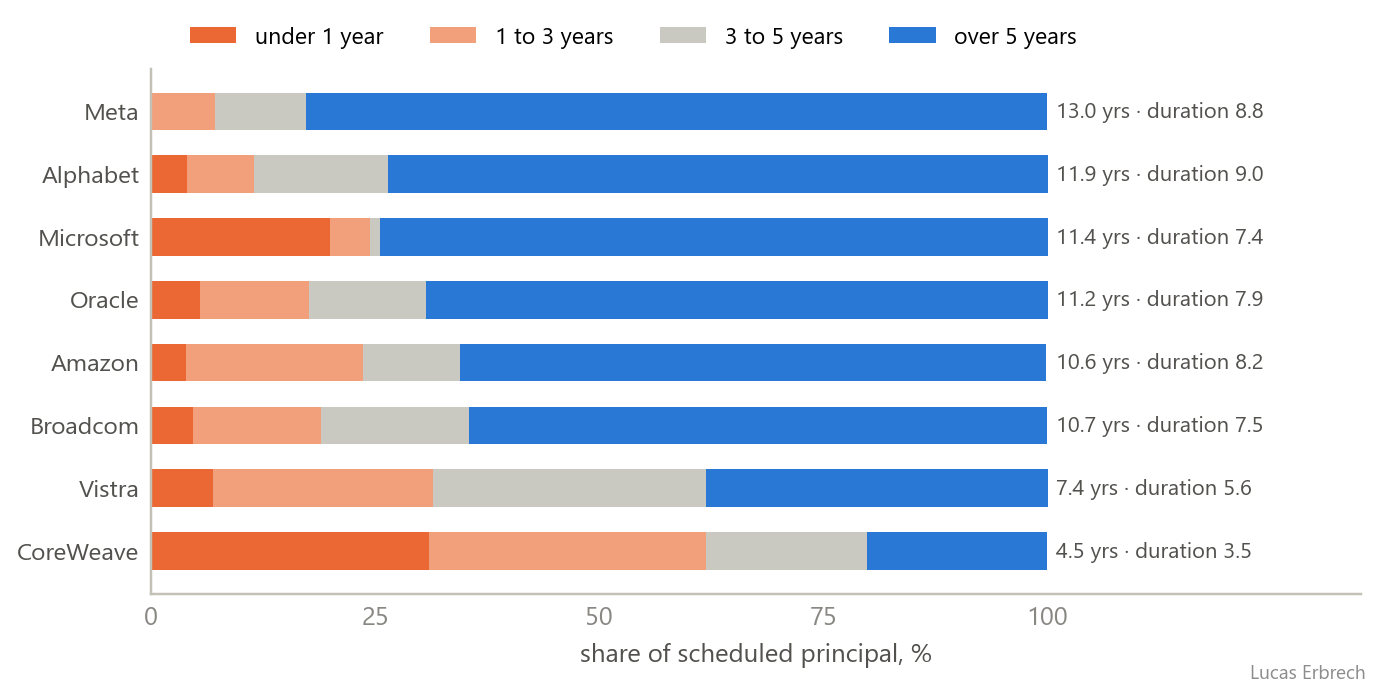
Two worlds.
The hyperscalers have locked in their funding. 65% to 83% of their debt matures beyond five years, with durations of 7.4 to 9; their average coupon stays low (3.5% to 4.1%), and higher rates only hit new debt. The rate risk has passed to the buyers of those bonds, and it is recent: Amazon has issued $112bn and Alphabet $77bn since their last annual schedule, mostly long-dated.
CoreWeave lives on short-term debt. 62% of its schedule fell due within three years. At the schedule date its cash covered 0.38 times what it had to repay within 24 months (2.1 for Oracle, 10 to 100 for the other hyperscalers), and its free cash flow is negative. It has to refinance, and the market makes it pay: an implied average coupon of 6.5% and an assumed market rate of about 10%.
The effect on the yield curve. According to TwentyFour Asset Management (Sep 3, 2026), 41% of hyperscaler issuance in 2025-26 had a maturity beyond 15 years, against 16% for the corporate bond index, with bonds running to 2066 (Meta, Oracle), 2076 (Amazon) and 2126 (Alphabet's sterling century bond). A $5bn to $6bn 30-year deal competes head-on with the 30-year Treasury for pension funds and insurers. This cuts both ways:
As long as the circuit invests, it weighs on long-dated Treasuries, adding duration supply while the Treasury is already issuing heavily: one reason TLT has not protected this year.
If the circuit cuts capex, that supply stops, and a flight to quality meets no competition: one more argument for Treasuries in the systemic scenario, provided the Fed is not tightening.
In plain English. The strain sits with the circuit's most fragile borrowers, and for the first of them a default within a year is no longer a tail scenario: the credit market puts it at about one in six. The rest of credit is watching, the mark of a thematic crisis. It would turn systemic if the strain spread to private credit and leveraged loans, where the risky tranches of these structures sit.
9. Where to look: balance sheets, AI credit, private credit
General credit gives no warning. On daily moves since 2012, high-yield credit and SMH move on the same day (correlation 0.55), with nothing one day apart (−0.05 and −0.08); on blocks of twenty sessions, the same: 0.47 for the same block, −0.10 and −0.05 for the previous and the next, within the margin of error. Waiting for the high-yield spread to widen means waiting until equities have already fallen.
The leading information lies in three places:
the balance sheets: capex against cash flow, every quarter;
AI-specific credit: Oracle's distance to default has been cut sixfold since early 2024, while SMH was still rising;
private credit: the channel through which a thematic crisis turns systemic, still calm.
To choose the haven, add a fourth: the 2-year yield (section 5.2).
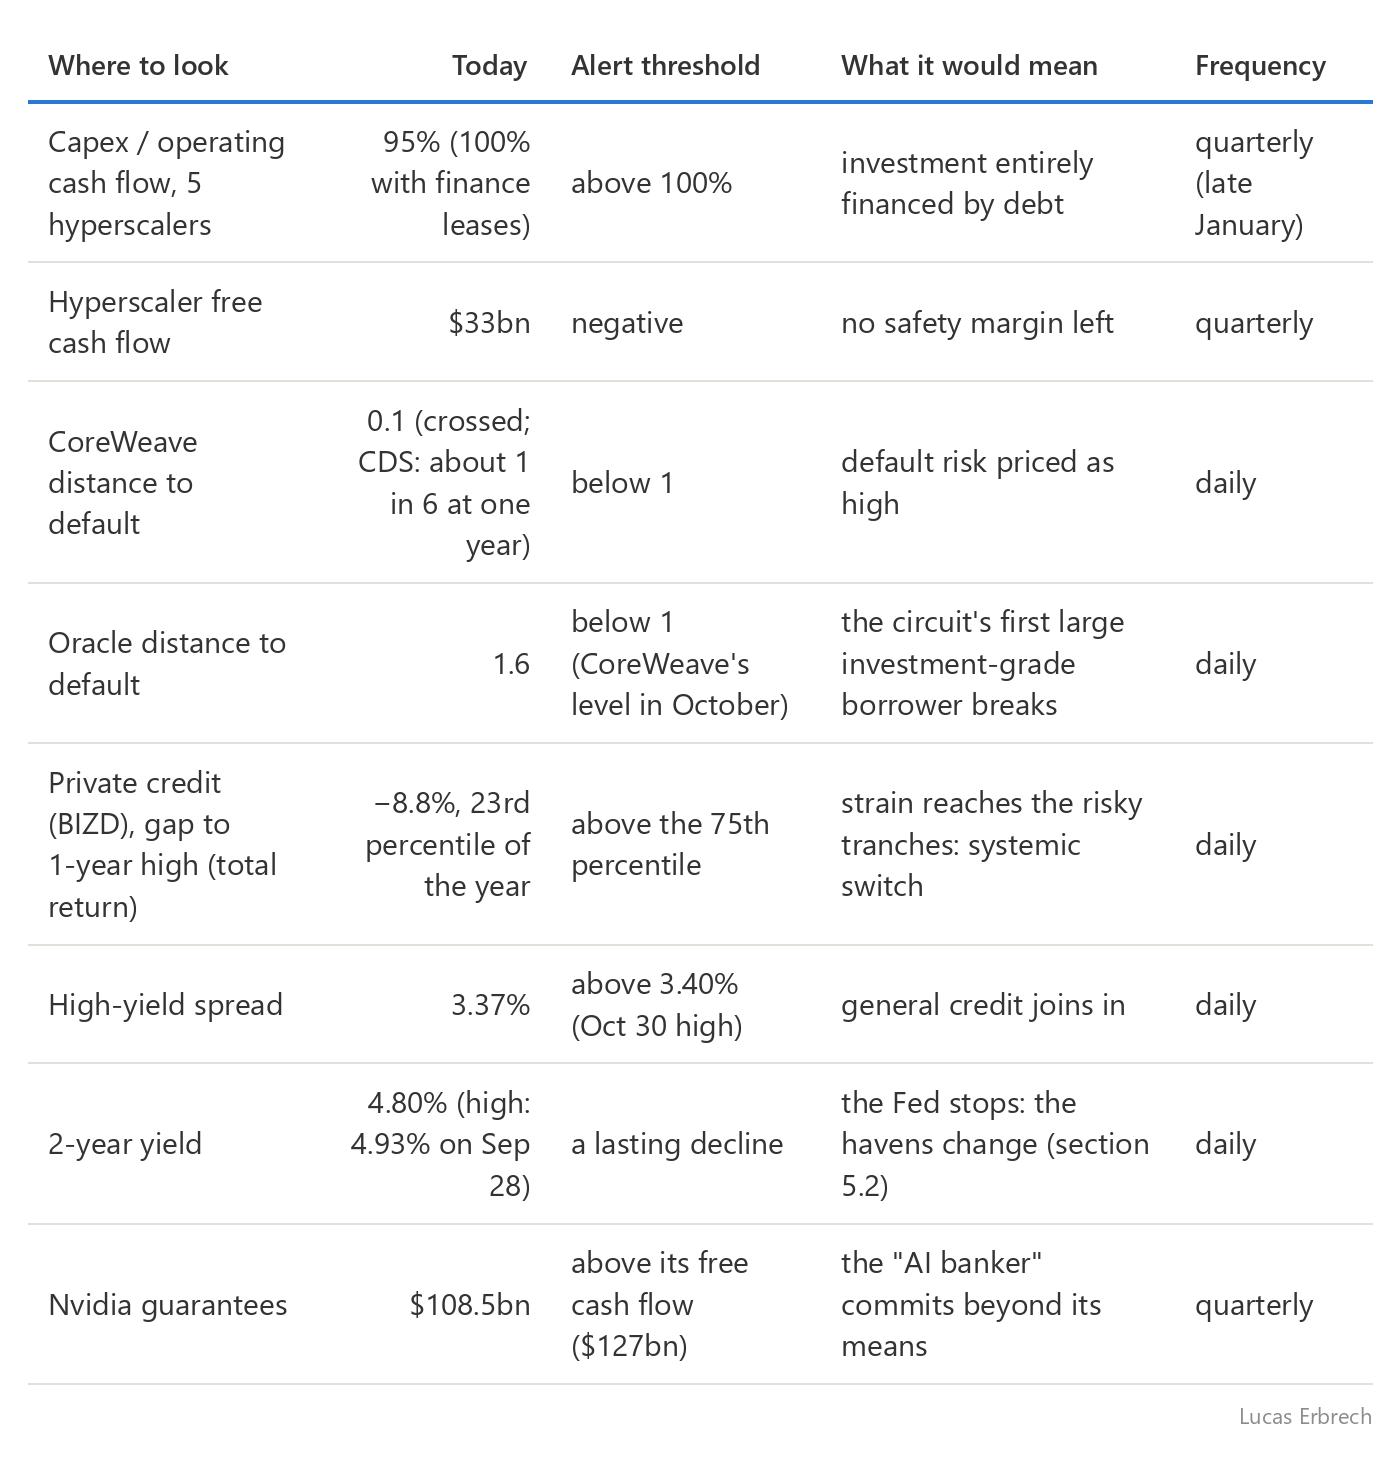
10. The contrary evidence, and what it is worth
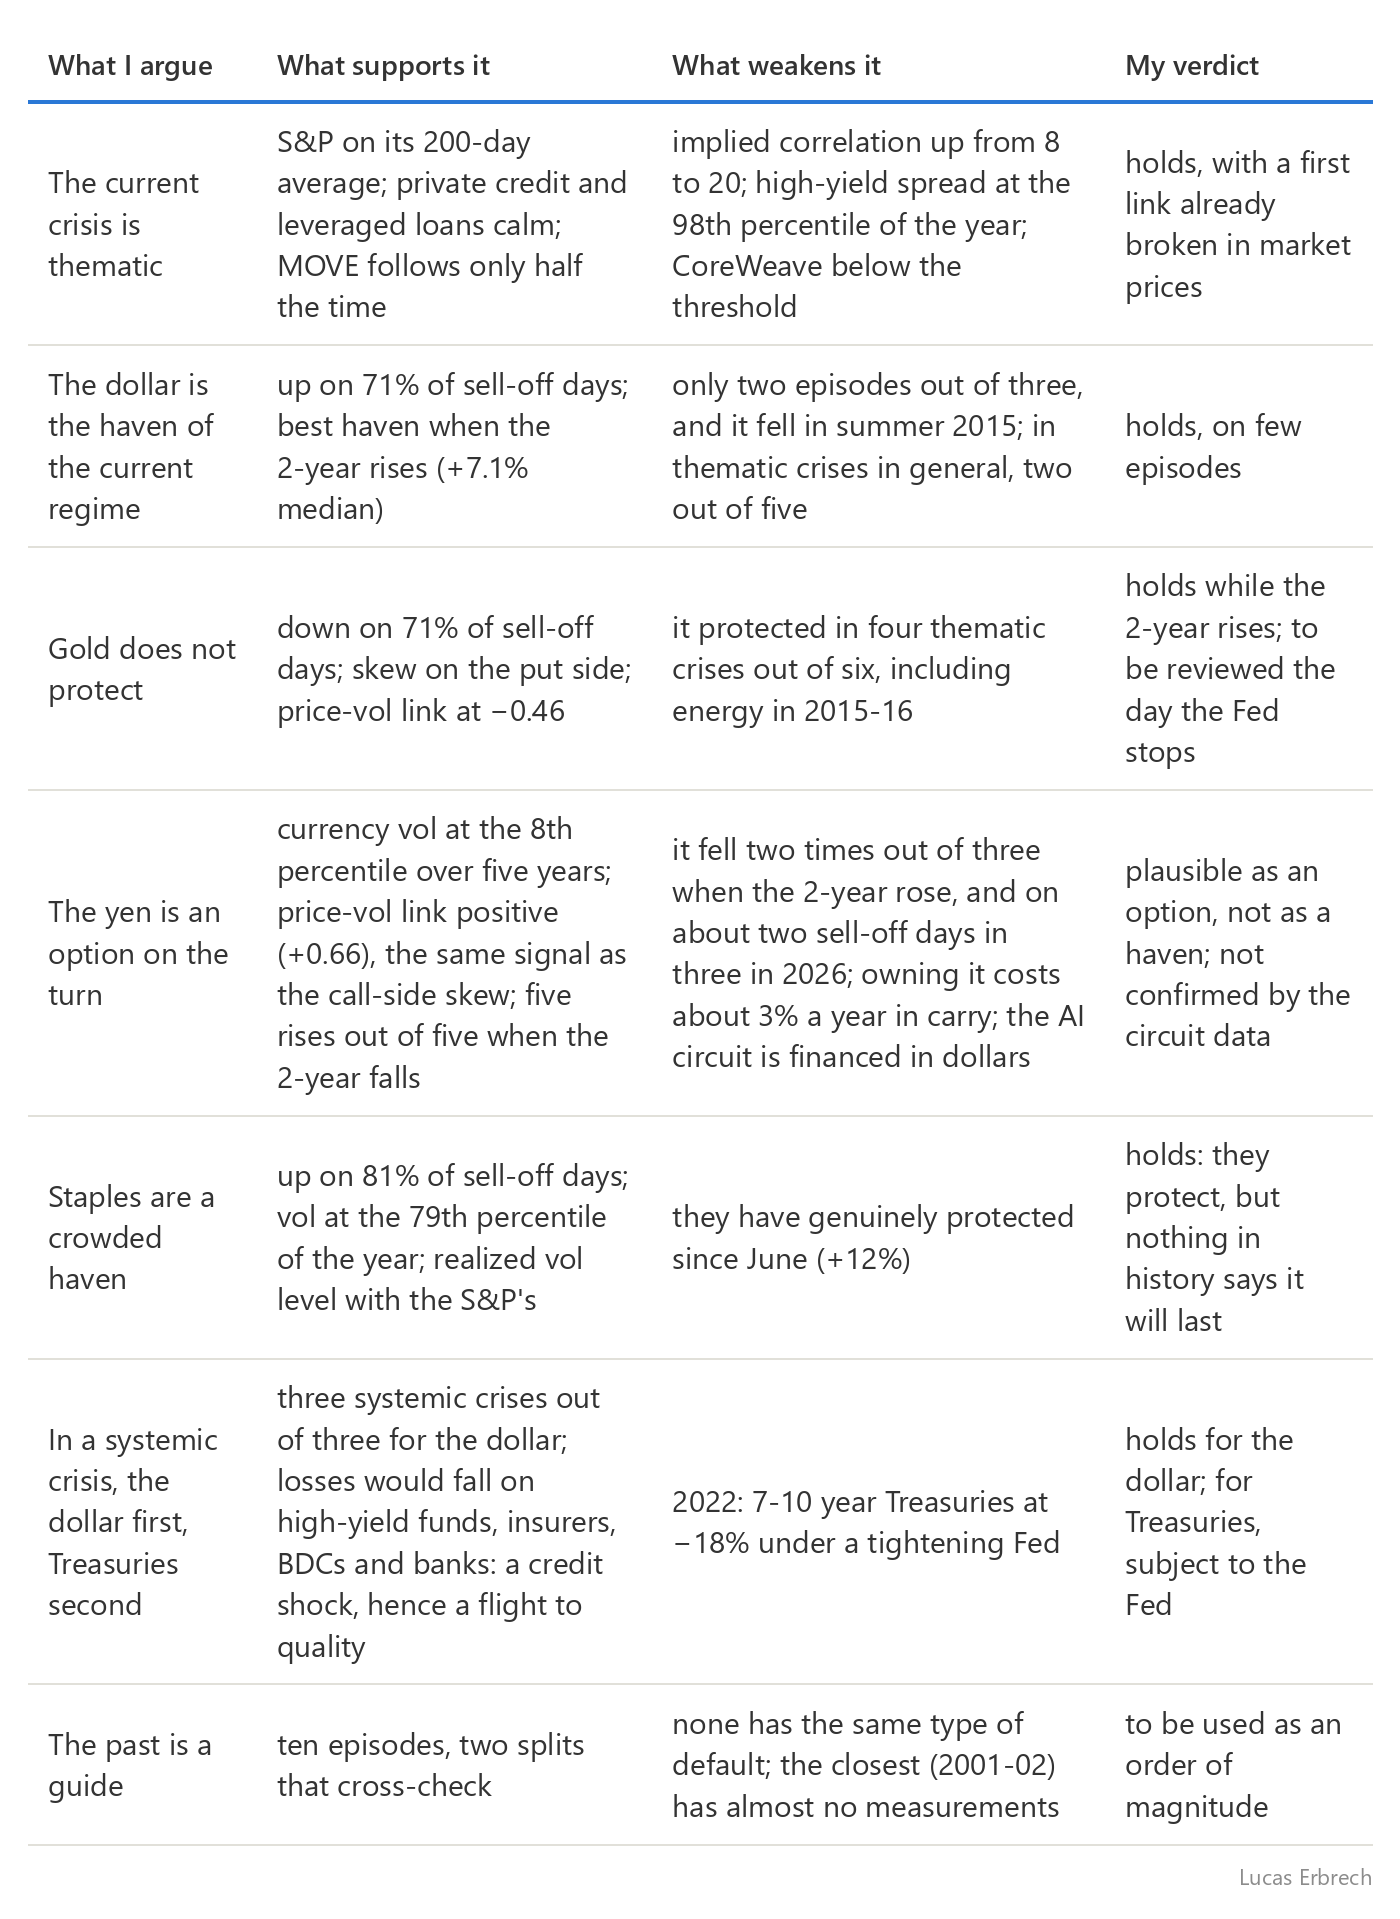
11. Which haven for which scenario
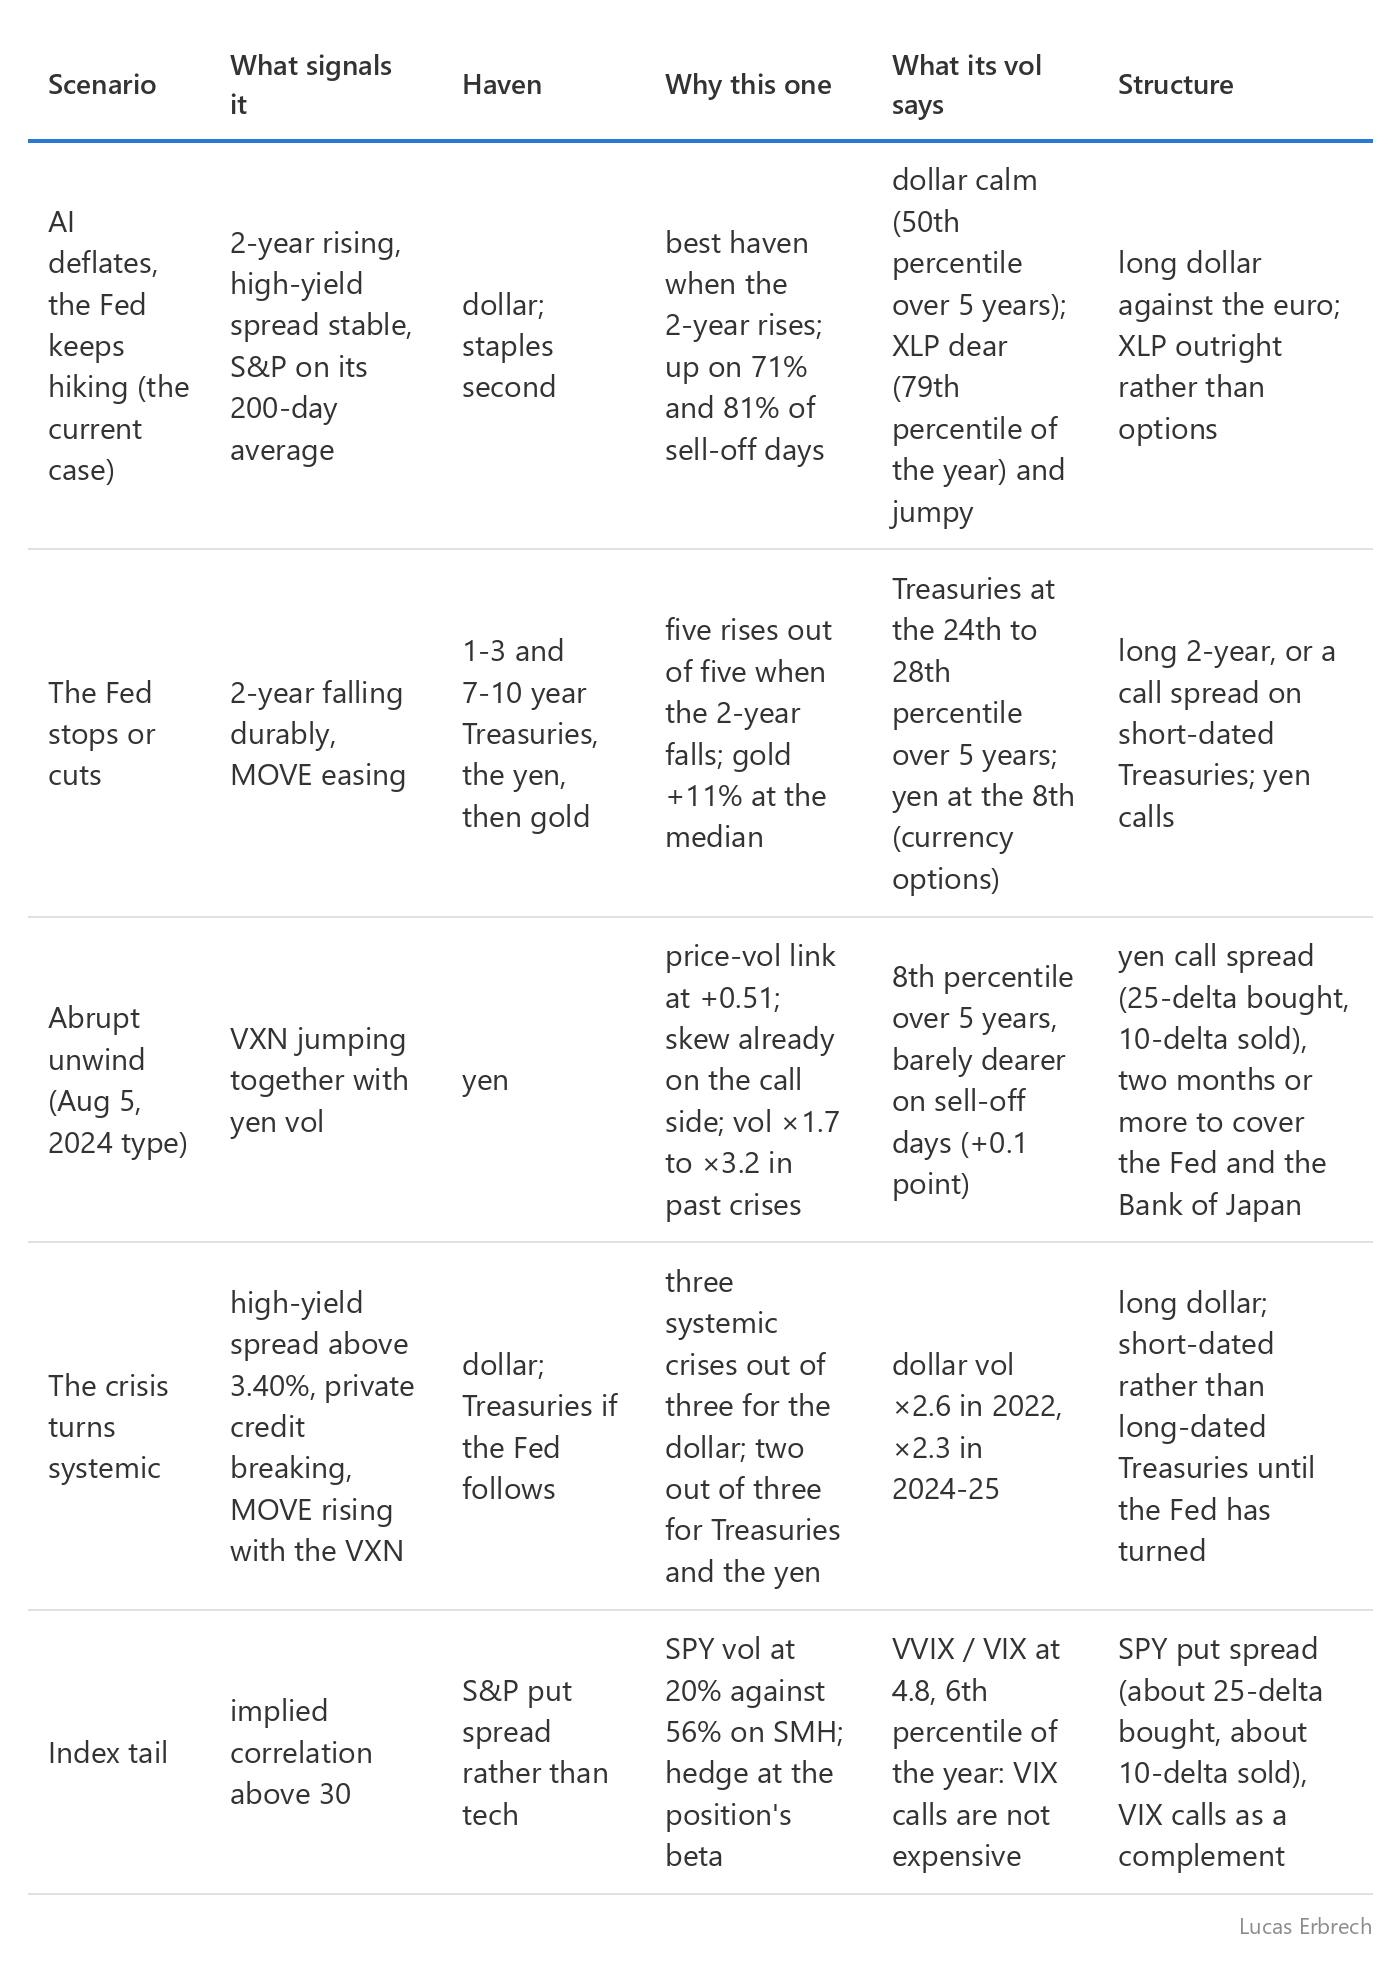
For scale: priced at 9:12 a.m. New York time on Nov 19, with SPY at 738.00, a January 15, 2027 SPY put spread, long the 690 put (delta −0.22) and short the 640 put (delta −0.10), cost $5.06 per share, 0.69% of the SPY price.
Three rules:
Hedge at the beta, not at 100%. A semiconductor portfolio has a beta of about 2.4 to the S&P: $100,000 of SMH carries about $240,000 of S&P exposure, and offsetting it with 25-delta puts takes about four times as much notional. But 2.4 is the normal-times beta: since Sep 28 SMH lost 23% against 4% for the S&P, so in a thematic crisis an index hedge covers less than half the loss. It hedges the systemic tail, not AI alone.
Buy convexity when it is calm. Dollar options do not get dearer on sell-off days, yen options barely; tech and staples options do.
Read the regime on the 2-year: it tells you whether you are in the dollar column or in that of Treasuries, the yen and gold.
What I don't take:
Gold, while the 2-year rises. It falls on AI sell-off days, tracks the Nasdaq and its vol rises when it falls. It would become a haven again if the Fed stopped, the dollar turned and its price-vol link moved back above zero.
Silver, the miners, bitcoin. Their Nasdaq beta is 0.8 to 1.0, and the miners' realized vol exceeds implied by 13 points: these are risk positions.
The Swiss franc. It fell in all three measurable systemic crises, rose on only one sell-off day in four in 2026, and its price-vol link is nil.
Utilities. They protected in four thematic crises out of six but lost a third in systemic ones, and the rotation into them is already well advanced.
What would prove me wrong
Gold rises on a day of sharp SMH losses while the 2-year rises: the rate regime would explain nothing, and gold would be a haven in its own right.
The dollar falls on AI sell-off days several times in a row: the end of the best haven in the right-hand column.
Staples fall with tech: the defensive rotation unwinds, the crowded-haven risk their high vol already flags.
Short-dated Treasuries fall during a crash: the 2022 scenario of a Fed tightening mid-crisis, which would leave only the dollar.
The yen falls during an unwind, or while the 2-year falls. The carry trade would no longer be funded in yen, and the option would not pay.
Private credit breaks before neocloud credit: the crisis would come from outside AI (real estate, consumer), and the circuit would be the wrong place to look.
The hyperscalers cut capex in the first quarter of 2027 without credit moving: the circuit would deflate gently and the systemic scenario recede.
What I watch
The 2-year: 4.80%, 13 bp below its Sep 28 high. Rising again: the dollar. Falling durably: Treasuries, the yen, gold.
Gold's price-vol link: −0.46. Above zero, gold regains its haven signature.
Staples vol: 79th percentile of the year. A falling price with rising vol would signal the rotation unwinding.
Yen vol: 6.9% in currency options, 8th percentile over five years. It closed at 15.6% on Aug 5, 2024.
MOVE against VXN: today the MOVE does not follow. If it rises with the VXN, the crisis becomes a bond crisis.
High-yield spread: 3.37%. Above its Oct 30 high of 3.40%, we tip into the systemic scenario.
Implied correlation (COR1M): 20.1. Above 30, a general sell-off.
The circuit: the section 9 table.
Calendar: payrolls on Dec 4; the Fed on Dec 9; CPI on Dec 10; Oracle's results in mid-December; the Bank of Japan and options expiry on Dec 18; hyperscaler results in late January.
Gold protected against tech crises when the Fed was cutting rates. This Fed is raising them. The haven in an AI crisis depends less on AI than on what the Fed does while it breaks.
This article is published for educational purposes. It does not constitute investment advice or a recommendation. Options and other derivatives carry a high risk of loss.
This article is by Lucas Erbrech, CrossVol Derivatives Team. The analysis and the views are the author's own; CrossVol Research publishes them for educational purposes.
CrossVol Research is the research desk of CrossVol (crossvol.com), an options analytics platform for derivatives traders.
How to cite: Lucas Erbrech, CrossVol Research, "If the AI Trade Breaks, Where Do You Hide?", 19 November 2026. https://newsletter.crossvolresearch.com/p/ai-bubble-safe-haven-gold-dollar-yen-fed