

By Benoît Thiery, CrossVol Derivatives Team. Data: close of Friday, November 13, 2026.
This article is published for educational purposes. It is neither investment advice nor a recommendation to buy or sell. Options carry a high risk of loss.
On October 15, the exchanges listed CoreWeave options with $5, $10 and $15 strikes on every expiry more than a year out, while the stock was at $70. Four weeks on, more than 80% of the volume traded in the deep puts has gone into opening new positions. And since mid-September, puts more than a year out have outnumbered calls, for the first time since the summer of 2025. Yet two-year implied volatility has risen only about four points since mid-August, to 84%. The level of vol says "calm". Its shape says "bankruptcy or blast-off".
CoreWeave (CRWV) closed on Friday, November 13, at $53.13. On August 17 the stock was at $106, and its high, $183.58, dates from June 20, 2025. In three months the stock has lost half its value, and its credit has come under strain at the same time: CoreWeave's 5-year CDS trades at 1,083.8 basis points, down from a peak of 1,289.5 bp on November 5.
This article does not start from a guess about the stock's direction. It reads what options more than a year out, the LEAPS, say about CRWV's future, then builds a position from that reading. The position that comes out of it does have a view: neutral on direction today, its best case is an orderly decline, with no default and no rebound above $95.
The thesis in one sentence: the market has emptied the middle of the distribution and filled both tails; I sell that fear where it is most expensive, keep insurance against bankruptcy, and let time work for me, getting out well before the January 2029 expiry.
In practice, the heart of the trade is a put BWB that I aim to enter at zero cost or close to it: it sells fear on the $30 put and keeps the insurance at $10. The call BWB is only a complement, there to collect an extra premium, because I do not see CRWV climbing back above $95 by then.
My read, in numbers. Options give CRWV a 42% chance of being between $20 and $90 in January 2029, the zone where my structure makes money or loses almost nothing. Credit is even more pessimistic about bankruptcy (step 4). But that 42% is a "market" probability, which includes the risk premium. To get to a real-world probability, I corrected it in two ways:
By removing the stock's return premium. If CRWV is expected to return 4% to 12% a year more than the risk-free rate on average, the probability of finishing between $20 and $90 rises to between 43% and 45%. Above all, the risk of finishing below $5 falls from 21% to between 13% and 18%, and the risk of finishing below $10 from 27% to between 18% and 24%.
By correcting the width of the distribution. This is the surprise of the calculation: since April 2025, CRWV's realized volatility (106%) has been higher than its implied volatility (86% to 89% on average). Options have not overestimated the stock's moves, they have underestimated them. With this correction, the probability falls back to 39%.
My estimate is about 45%, at the top of that range, because I believe in the refinancing. It is not a big gap with the market, and I would rather say so plainly: the trade's edge does not come from betting on a much more likely middle. It comes from two things. First, the trade sells the most expensive part of the smile (step 2). Second, according to this correction model, the risk premium sits mostly in the downside tail: the structure's profit zone at expiry ($14.5 to $105.5) has a real-world chance of about 53% to 55% with the first correction, against 51% at market prices.
The context
Earnings are behind us. CoreWeave reported its third quarter on November 10. Options were pricing a move of about 21%; the stock gained nearly 25% the next day, then gave back part of the gain: −7% on Thursday, −6% on Friday.
Realized volatility is enormous. Over 21 sessions it reaches 136% annualized, and 109% excluding the earnings day.
Credit is under strain, with a way out. Bloomberg reported on November 11 that CoreWeave is in talks with banks for an investment-grade loan of at least $4 billion, talks CrossVol Research covered in Stock Market Next Week: No Santa Rally Before the Fed (November 14). For this structure, that is the main catalyst: a successful refinancing deflates the downside tail that the trade sells. CrossVol Research explained why data center debt can outlive the chips it pays for in The AI Depreciation Bomb: The Chips Last Three Years, the Loans Last Ten (November 5).
Step 1: the term structure does not say "panic" at the long end
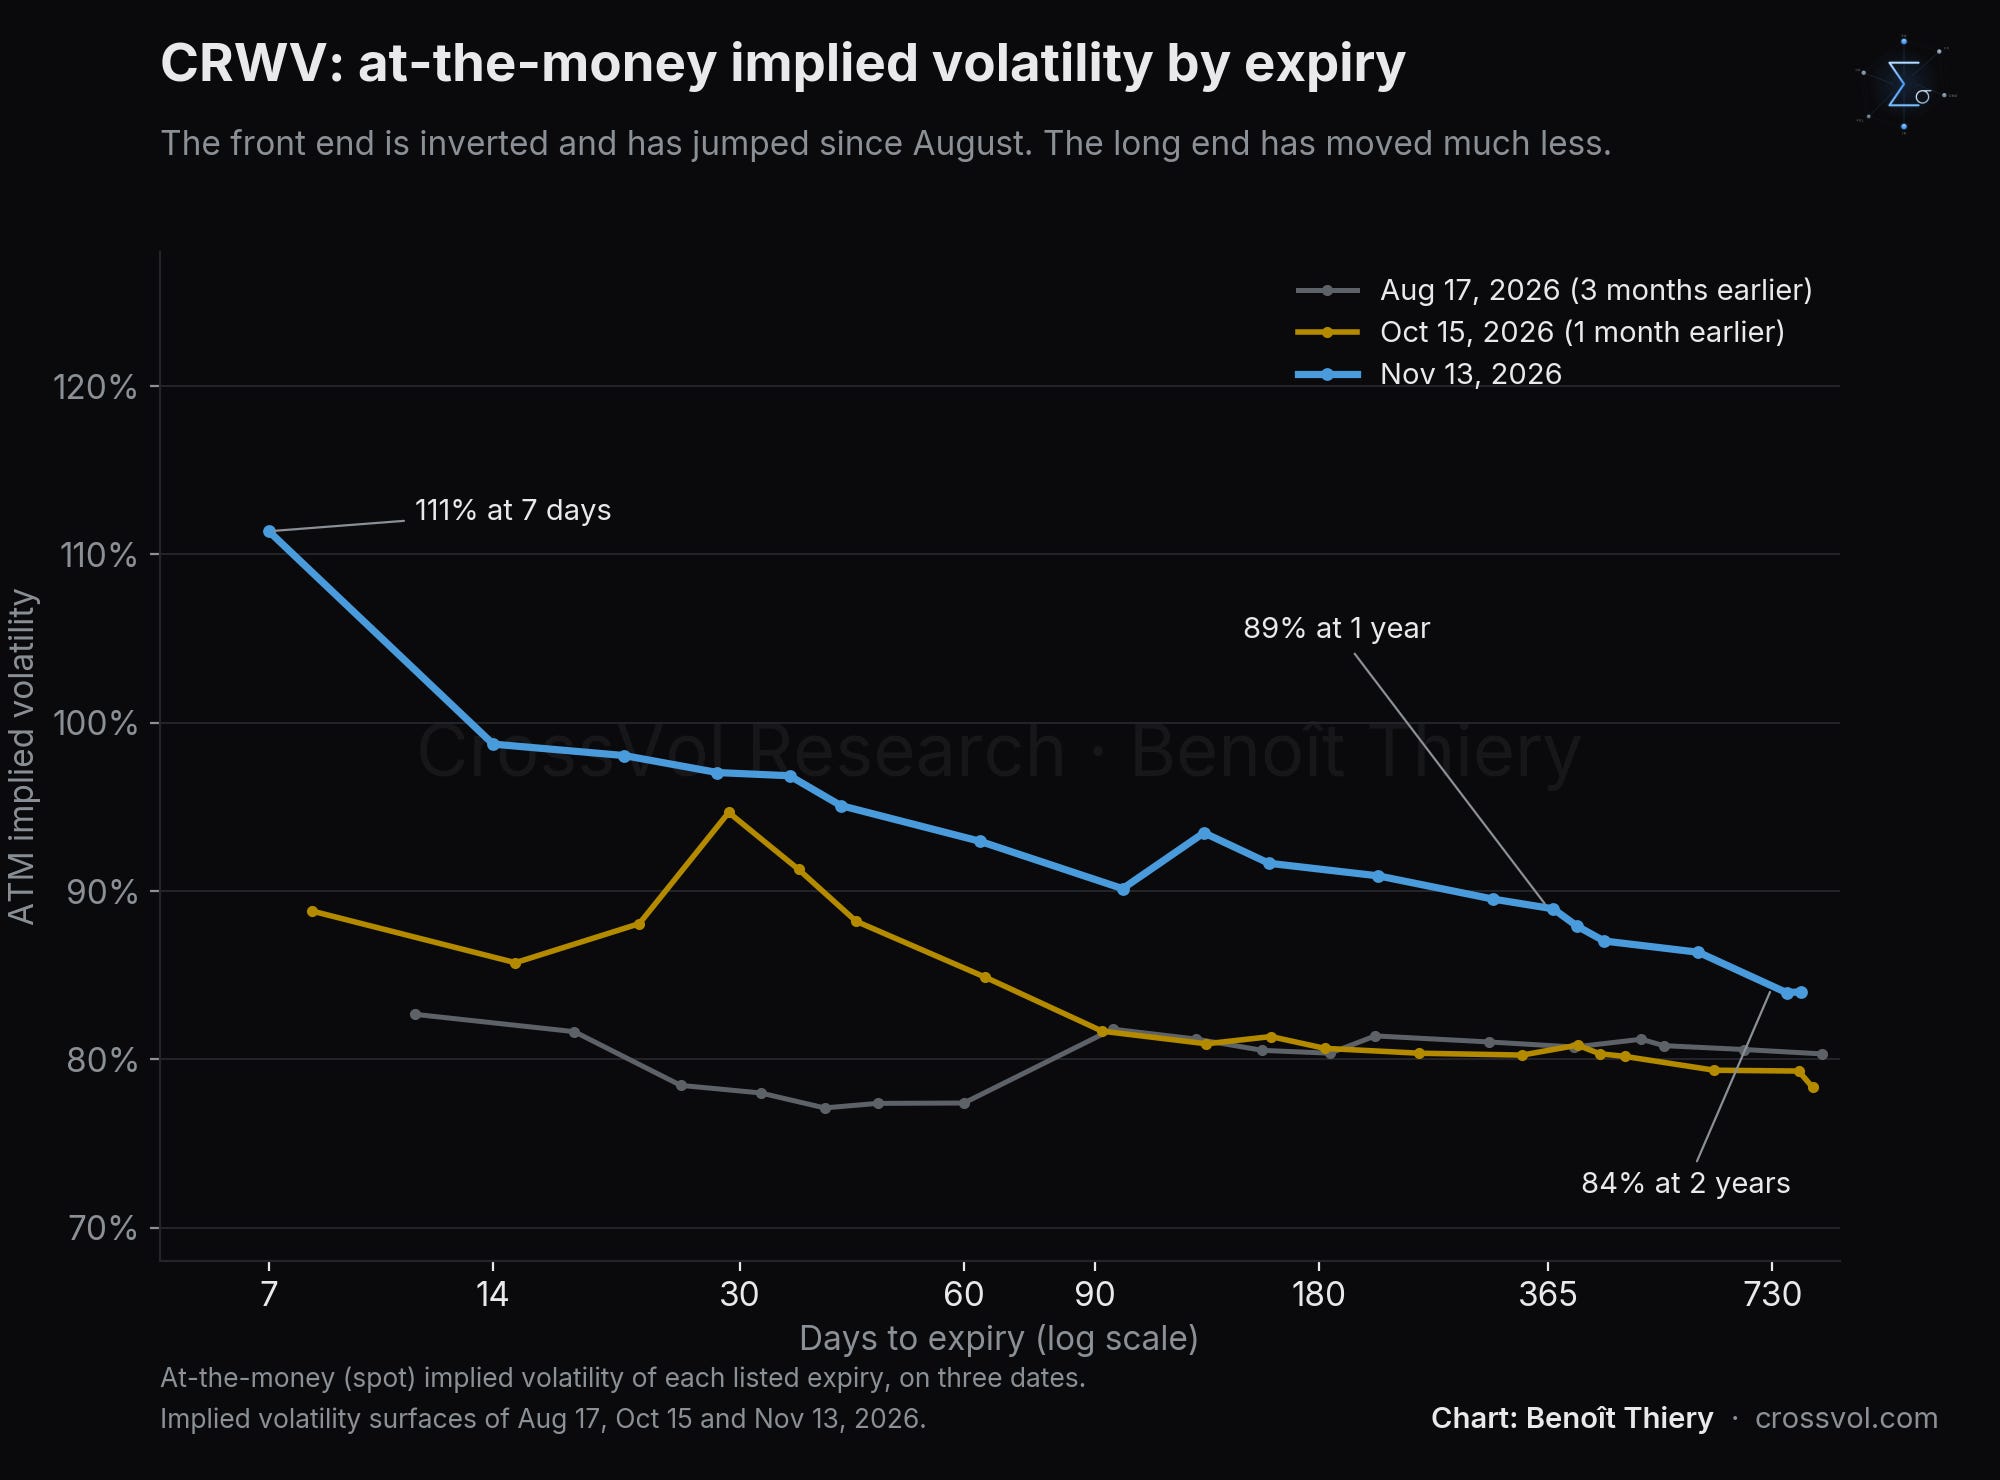
The front of the curve is inverted. 7-day ATM IV is at 111%, against 97% at 30 days: the classic stress signal.
The long end has moved, but stays within its usual range. One-year IV is at 89% (+8.5 points in a month): high, but below the peaks of 2025, when it went above 100%. Two-year IV is at 84%: up 5 points in a month, but only about 4 points above its mid-August level.
The forward vol between one and two years is about 79%, almost unchanged since August. The market is concentrating the risk in 2027.
This point works against a volatility seller: on level, the second year is not expensive. That is why the chosen structure is almost vega-neutral. It does not sell the level of vol, it sells its shape.
In plain English: options a few days out are expensive because the stock is moving enormously right now. Two years out, the "average" price of options is normal. What is abnormal lies elsewhere: in how prices are distributed across strikes.
Step 2: the downside tail has never been this expensive
I call "downside wing" the gap between the IV of an option struck 50% below the spot and the ATM IV, and "upside wing" the same gap for a strike at twice the spot.
The downside wing is at +12.1 points, the 99th percentile since September 2025. Its average is +5.2 points.
The upside wing is at −5.2 points, the 3rd percentile. Its average is −2.0 points.
The switch dates from mid-October, when the stock lost 15% in a single session.
One nuance on that percentile. Part of the rise is mechanical: as the stock fell from $70 to $53, the "−50%" point slid from $35 to $26.5, further down a convex smile whose deep strikes barely moved (step 6). At a fixed point of the smile, the picture is calmer: at 60% of the spot, the one-year downside wing went from about +3 points in mid-August to about +8 in mid-October, and is near +7 today.
On the January 2029 expiry, the slope is the same:
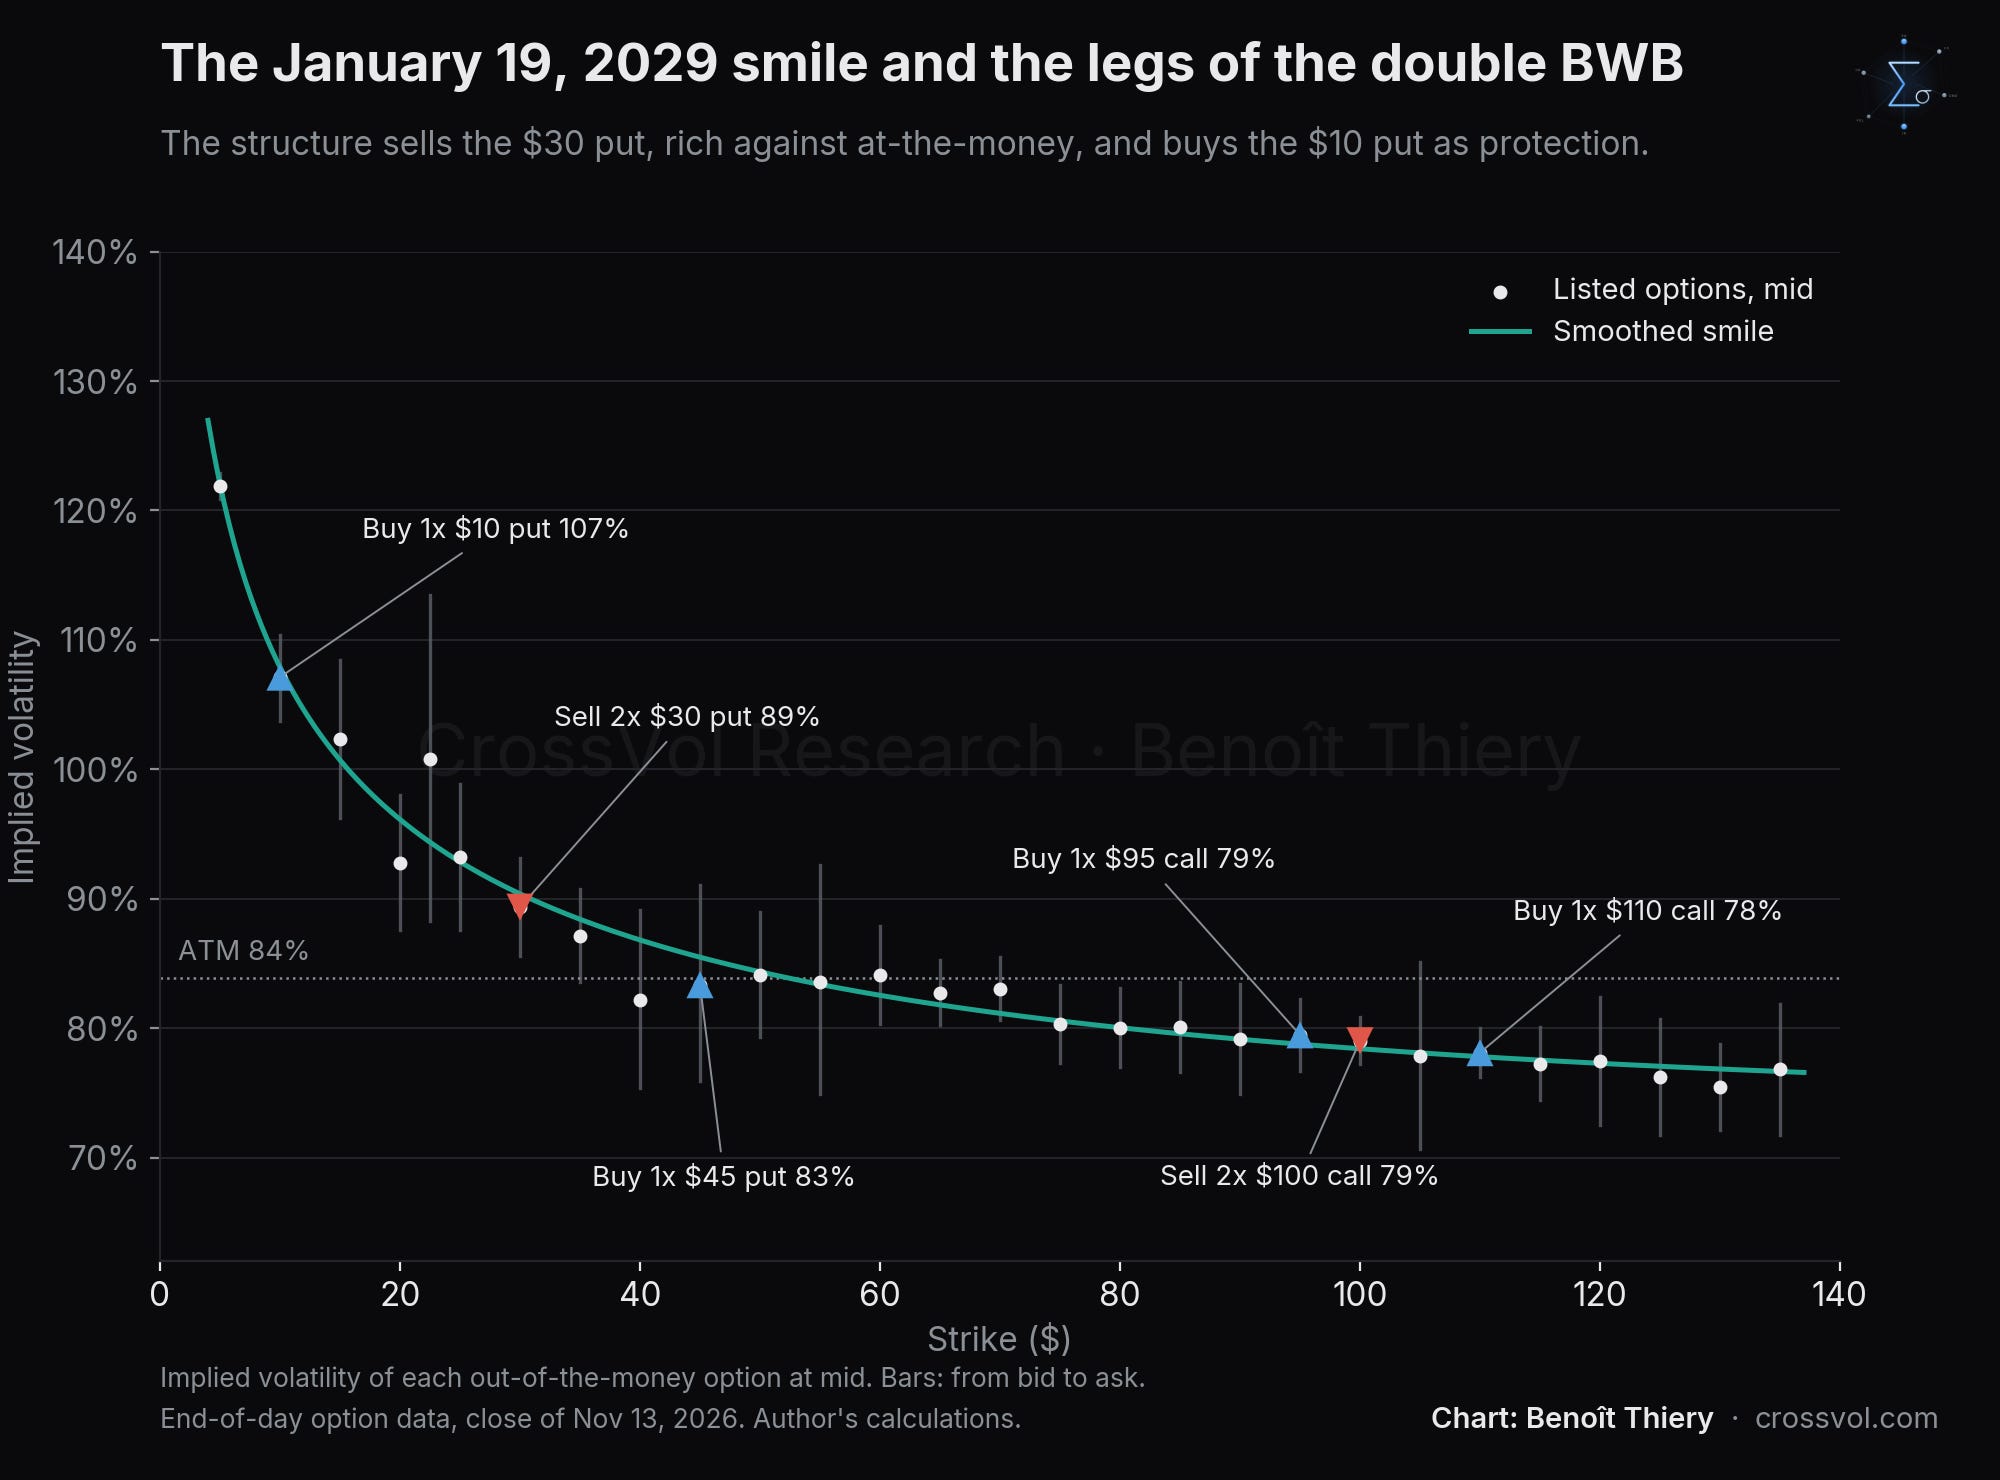

The $30 put trades about 5.5 vol points above ATM. For an option seller, it is an expensive strike relative to ATM, one you can sell while staying covered against bankruptcy by the $10 put.
One important clarification: "expensive" here means relative to ATM. Since April 2025, CRWV's realized volatility (106%) has been higher than its average implied volatility (86% to 89%). The general level of options has therefore not been too expensive, quite the opposite. What I sell is the gap between the $30 put and ATM, not an excessive level of volatility.
In plain English: to compare options with each other, we use their implied volatility: the higher it is, the more expensive the option. Today, insurance against a sharp drop has almost never been this expensive relative to options near the spot, and a bet on a sharp rise has almost never been this cheap.
Step 3: a distribution that is hollowing out in the middle
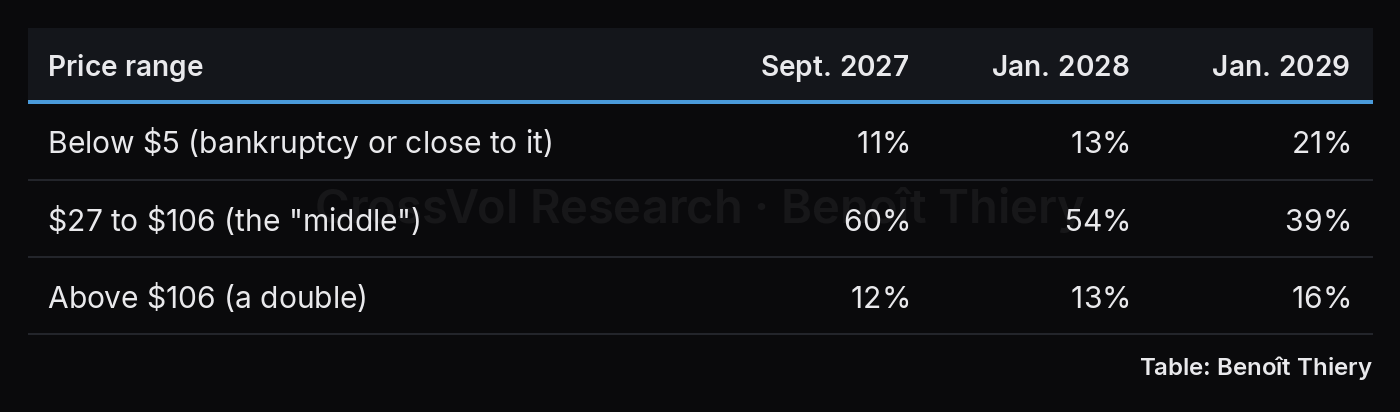
The longer the horizon, the emptier the middle. For January 2029, the market gives CRWV only a 39% chance of finishing between $27 and $106, that is, between half and double the current price.
These probabilities are risk-neutral: they include the premium that protection buyers are willing to pay. People often conclude that both tails are too fat. For CRWV, that is true mostly of the downside tail. When I remove the risk premium (see "My read, in numbers"), the risk of finishing below $5 falls sharply, but the middle gains only 1 to 3 points, and the upper tail gets fatter. And since realized volatility has been higher than implied, nothing says the distribution is too wide. The engine of the trade is therefore more precise than a simple "the market is overdoing it": the structure sells the downside tail where it is overpaid (around $30), and buys back the extreme ($10) instead of selling it.
In plain English: from the prices of all the options on one expiry, you can estimate the odds the market gives to each price level. These are not true probabilities: when everyone is scared, insurance is overpriced, and a sharp drop looks more likely than it is. For CRWV, this effect bears mostly on the downside, not on the upside.
Step 4: options versus credit, bankruptcy is the risk to hedge
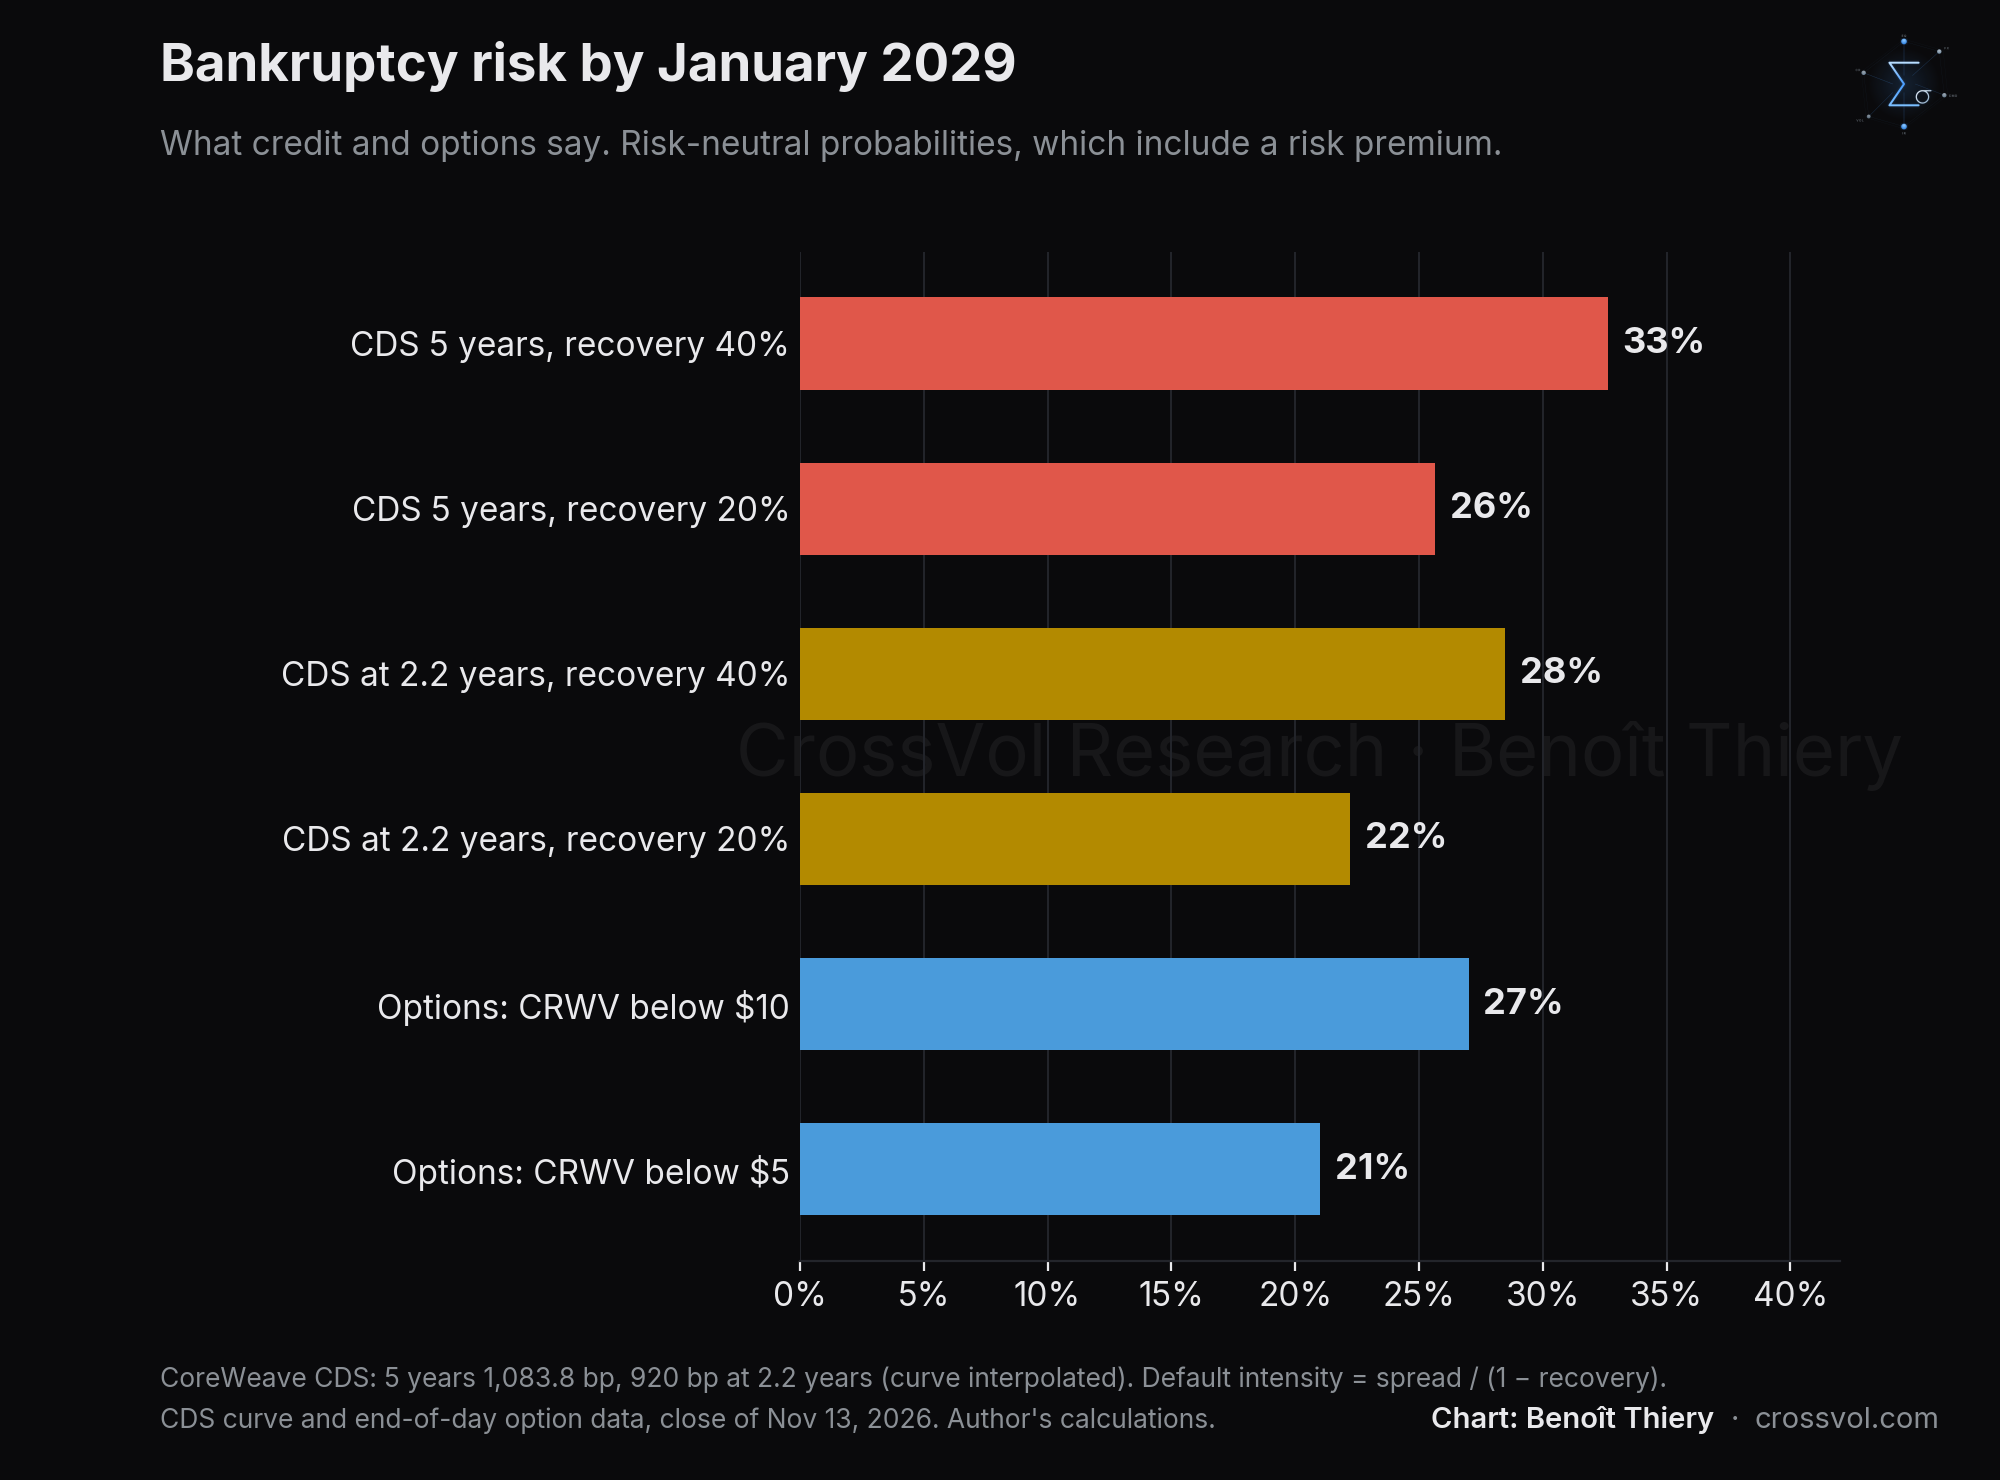
A CDS at 1,083.8 bp implies a default intensity of roughly spread / (1 − recovery), i.e. 18% a year with a 40% recovery. Projected to the January 2029 horizon, that gives a default probability of 26% to 33% depending on the assumed recovery. On the options side, the probability of finishing below $5 in January 2029 is only 21%.
The rest of the CDS curve says the same thing, a little less loudly. At the close of November 13 it sloped upward, from 663 bp at six months to 775 bp at one year, 904 bp at two years and 991 bp at three. A spread matched to the 2.2-year horizon, about 920 bp, gives 22% to 28%: level with options at the low end, above them everywhere else.
Credit is therefore at least as pessimistic as options about the "zero" scenario, and more so on most assumptions. Two consequences for the structure:
Do not be naked short bankruptcy. Protection below $10 is cheap relative to credit: it is the leg you buy, not the one you sell.
The default scenario remains the main loss. Even hedged, the structure loses its maximum stake below $10 at expiry, hence my rules for getting out before that point. If you believe the CDS rather than the options, that scenario weighs 22% to 33%, depending on the maturity and the recovery you assume.
A word of caution on this calculation: it assumes that a default sends the stock close to zero before expiry and it ignores the basis between CDS and bonds. The 5-year version also applies a 5-year spread to a 2.2-year horizon, which is why the matched spread gives less. It is an order of magnitude, not an arbitrage.
In plain English: a CDS works like home insurance for lenders. You pay a premium every year, and the insurer covers the loss if the company goes bankrupt. For CoreWeave, five years of cover cost 10.8% a year of the insured amount. A lender who loses about 60% of the stake in a bankruptcy only pays that price if they see about an 18% risk of bankruptcy per year (10.8 ÷ 60), roughly a one-in-three chance by January 2029. Cover that ends closer to January 2029 costs less, about 9.2% a year, and points to a little more than one in four. Options see less: on most of these assumptions, the $10 put is cheap insurance.
Step 5: positioning, selling to those who buy fear
Look at the proportions more than the levels. Open interest, the number of contracts opened and not yet closed, shows where money has settled on expiries more than a year out.
For a year, CRWV LEAPS were mostly calls. In mid-July 2026 there were about 210,000 calls for 95,000 puts, fewer than one put for every two calls. LEAPS holders were betting on the upside.
Since the summer, puts have grown fivefold. They went from about 95,000 contracts in mid-July to 501,000 on November 10. Over the same period, calls less than doubled, to 405,000.
Puts overtook calls in mid-September, for the first time since the summer of 2025, when the LEAPS market had only a few tens of thousands of contracts. There are now 1.24 puts per call.
The move has been accelerating since mid-October, the very moment the $5, $10 and $15 strikes were listed.
Two caveats when reading these numbers:
Drops are not sales. When an expiry falls below one year, its contracts mechanically leave the LEAPS count. That is what happened in January 2026 with the January 2027 expiry. The same will happen around January 21, 2027 with the January 2028 expiry, the most heavily loaded one: the drop expected that day will not be a signal.
Open interest does not say who is buying. An open contract always has a buyer and a seller. The rise in puts says there is much more insurance in circulation, not who bought it. To find out who is behind these contracts, you have to look at their shape: that is the subject of step 6.
Where on the chain did these contracts settle?
New strikes on demand. On October 15, the exchanges listed the $5, $10 and $15 strikes on all LEAPS expiries at once, while the stock was at $70.
Open interest built up there. In one month, LEAPS added about 133,000 put contracts and 96,000 call contracts, with the largest increases on the $25 (+29,600), $10 (+16,600) and $5 (+16,500) strikes.
The upper tail draws money too, with +15,100 contracts on the $200 call.
Clients are buying both ends. When demand is this concentrated, those who provide liquidity demand a premium. The structure sits on the side of those who provide it, on the most expensive part (the $25 to $30 puts), and buys back the far end (the $10 put) instead of selling it.
Step 6: who is buying these puts? An insurance buyer who holds on
An open interest move has a shape, and that shape points to a type of player. Here are three facts, measured on expiries more than a year out between the October 15 close and the November 12 close:
Almost all the volume opened positions. On the $5, $10, $20 and $25 puts, the rise in open interest represents 81% to 90% of the volume traded: almost no one sold back. That ratio is only 43% on the $50 put and 27% on the $150 call, where traders get in and out.
The strikes are very far from the spot. On October 15, the stock was at $70: the $5 to $25 puts were 64% to 93% below the spot. They pay almost nothing if the stock falls 20% or 30%. They pay in a collapse.
The short-term bearish bet exists, but elsewhere. Over the same period, puts expiring within three months went from 790,000 to 1.29 million contracts. Those playing a quick drop use those options, not LEAPS.
Three explanations are possible:
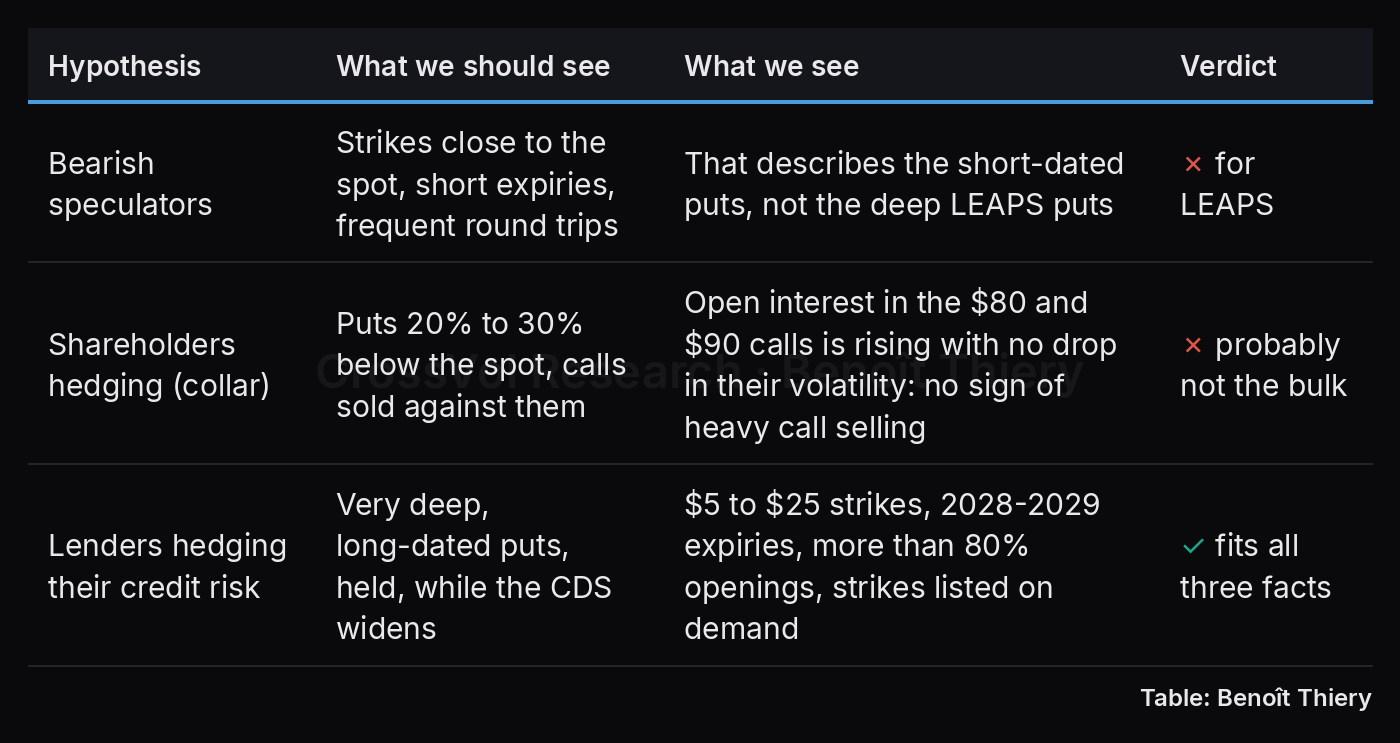
The shape points to a bankruptcy insurance buyer who holds on to the contracts, probably holders of CoreWeave debt who find these puts cheaper than the CDS (step 4). I cannot prove it: it would take trade-level data to know whether these puts were bought at the offer.
One fact points the other way, and it deserves an answer. On these strikes, implied volatility has barely moved (−0.5 to −2.3 points), while one-year ATM IV gained 6 points and the stock went from $70 to $57. The buyers did not push up the price at the strike: someone sold them these puts without difficulty. That seller is not necessarily a market maker. It could be a fund or an individual selling volatility, which is exactly the position my put BWB takes, except that I buy back the $10 put instead of selling it.
What step 6 says, and what it does not say. It identifies who is buying the deep LEAPS puts. It does not say who sold them, and it concerns far-dated options that move little from day to day. The stock's short-term moves depend on other options, those of step 7.
Step 7: the plumbing, where hedging accelerates the fall
The market makers who sell options hedge by buying or selling CRWV shares. Depending on their position, these hedges dampen or amplify the stock's moves.
I summed this exposure across all expiries, using open interest at the November 12 close. The result depends on an assumption: who bought each option, the clients or the market makers? I chose it to be consistent with step 6:
Puts: clients buy them, so market makers are short. It is the most plausible assumption, given the rise in short-dated puts (+500,000 contracts in four weeks) and the footprint of the LEAPS puts, but open interest alone does not prove it.
Calls: step 6 shows no heavy selling, but no proven net buying either. I do not know the net direction. My central case leaves them out, and I also give the two extremes: clients buying calls, or clients selling them (the usual convention).
What holds whatever the assumption on calls:
At the current price, hedging accelerates the fall. In the central case, at $53, each 1% drop would force market makers to sell about $68 million of stock. The range runs from $16 million to $119 million depending on what you assume about calls, but the sign does not change.
Below $30, the pressure eases sharply. In the central case, it falls to about $28 million per 1% at $30, then $11 million at $20 and $6 million at $15: at $20, six times less than today. The three assumptions give similar numbers in that zone, because calls count for little there.
This pressure comes from short-dated options, not from LEAPS. Puts expiring within a year account for about 90% of it, puts more than a year out for only 10%. That is what reconciles the two steps: step 6 describes long-term insurance buyers, whose contracts weigh little on the plumbing; step 7 describes the effect of short-dated puts, probably bought by speculators, as step 6 suggests.
Keep the size in perspective. $68 million per 1% drop is about 1.3 million shares at $53. CRWV has traded about 73 million shares a day over the past month, some $4 billion, so in the central case each 1% move triggers hedging worth about 1.7% of a day's volume (0.4% to 3% across the range). On a typical CRWV day, with moves of 5% to 8%, that adds up to roughly 9% to 14% of the volume: a real accelerant in a fall, while most of the day's trading still comes from other players.
One clarification: with the usual convention (clients selling calls), a "flip point" would appear around $59, above which hedges would dampen moves. That flip point only exists under that assumption, which nothing supports here, so I do not take it into account.
The largest put positions, all expiries combined, sit at $35 (229,000 contracts), $30 (197,000), $40 (152,000) and $50 (150,000).
What this changes for the trade. My thesis of a step-by-step decline needs nuance. Between the current price and $30, a drop could go fast, because the hedges add to the sellers. Below $30, it should slow down, which leaves more time to apply the $20 rule. The put BWB's maximum gain point, at $30, sits precisely where the pressure starts to ease.
In plain English: the banks that sell options are not betting, they hedge. Today, hedging forces them to sell the stock as it falls, which deepens the decline. This effect fades sharply below $30. I do not know exactly what is happening on the calls, so I draw no conclusion about the upside.
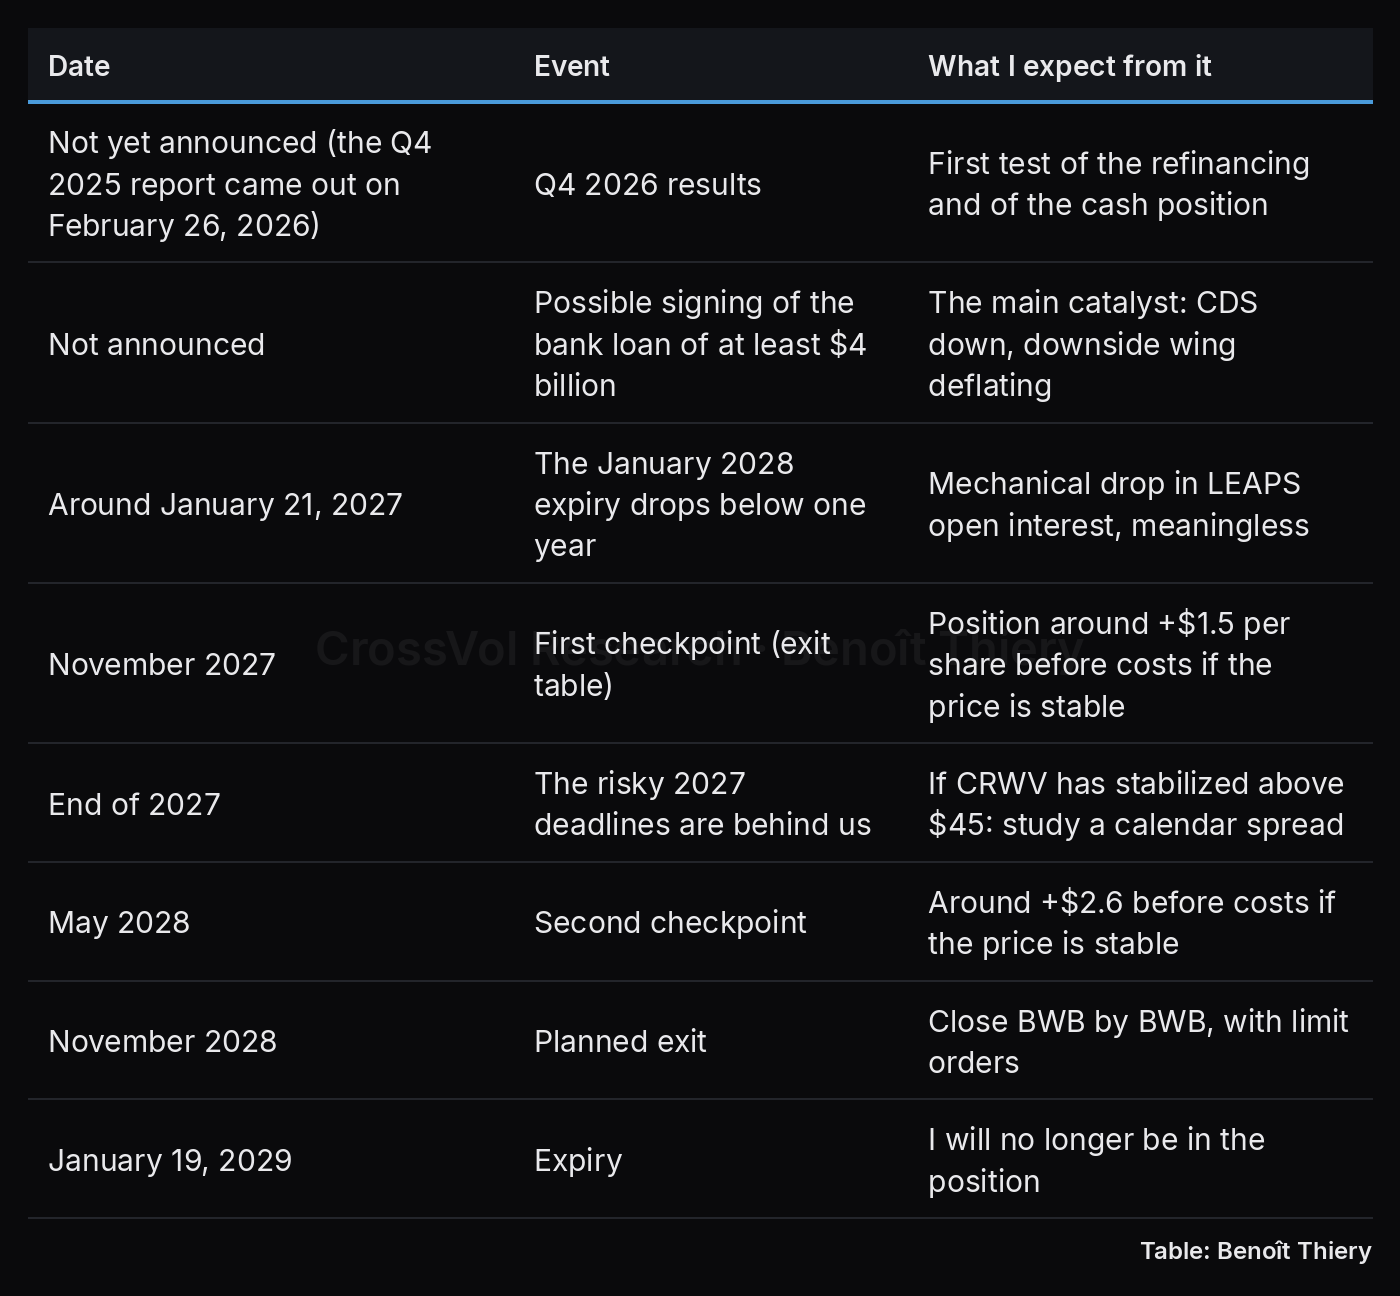
The calendar: when the thesis will be tested
The structure: an asymmetric double butterfly on January 2029
The position combines two "broken-wing butterflies" (BWB, butterflies with one wing further away than the other) on the January 19, 2029 expiry:
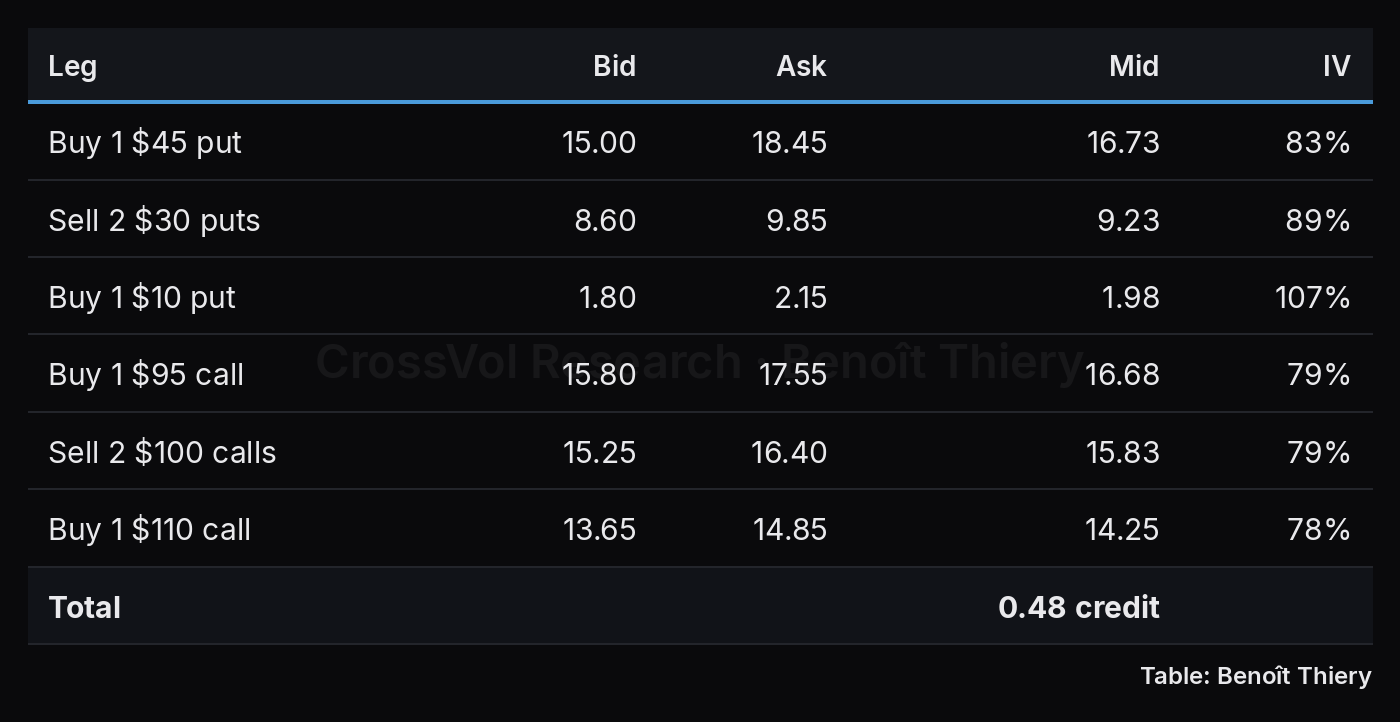
The 45/30/10 put BWB costs $0.25 at mid. The 95/100/110 call BWB brings in $0.73. Together they collect $0.48 per share at the closing mid.
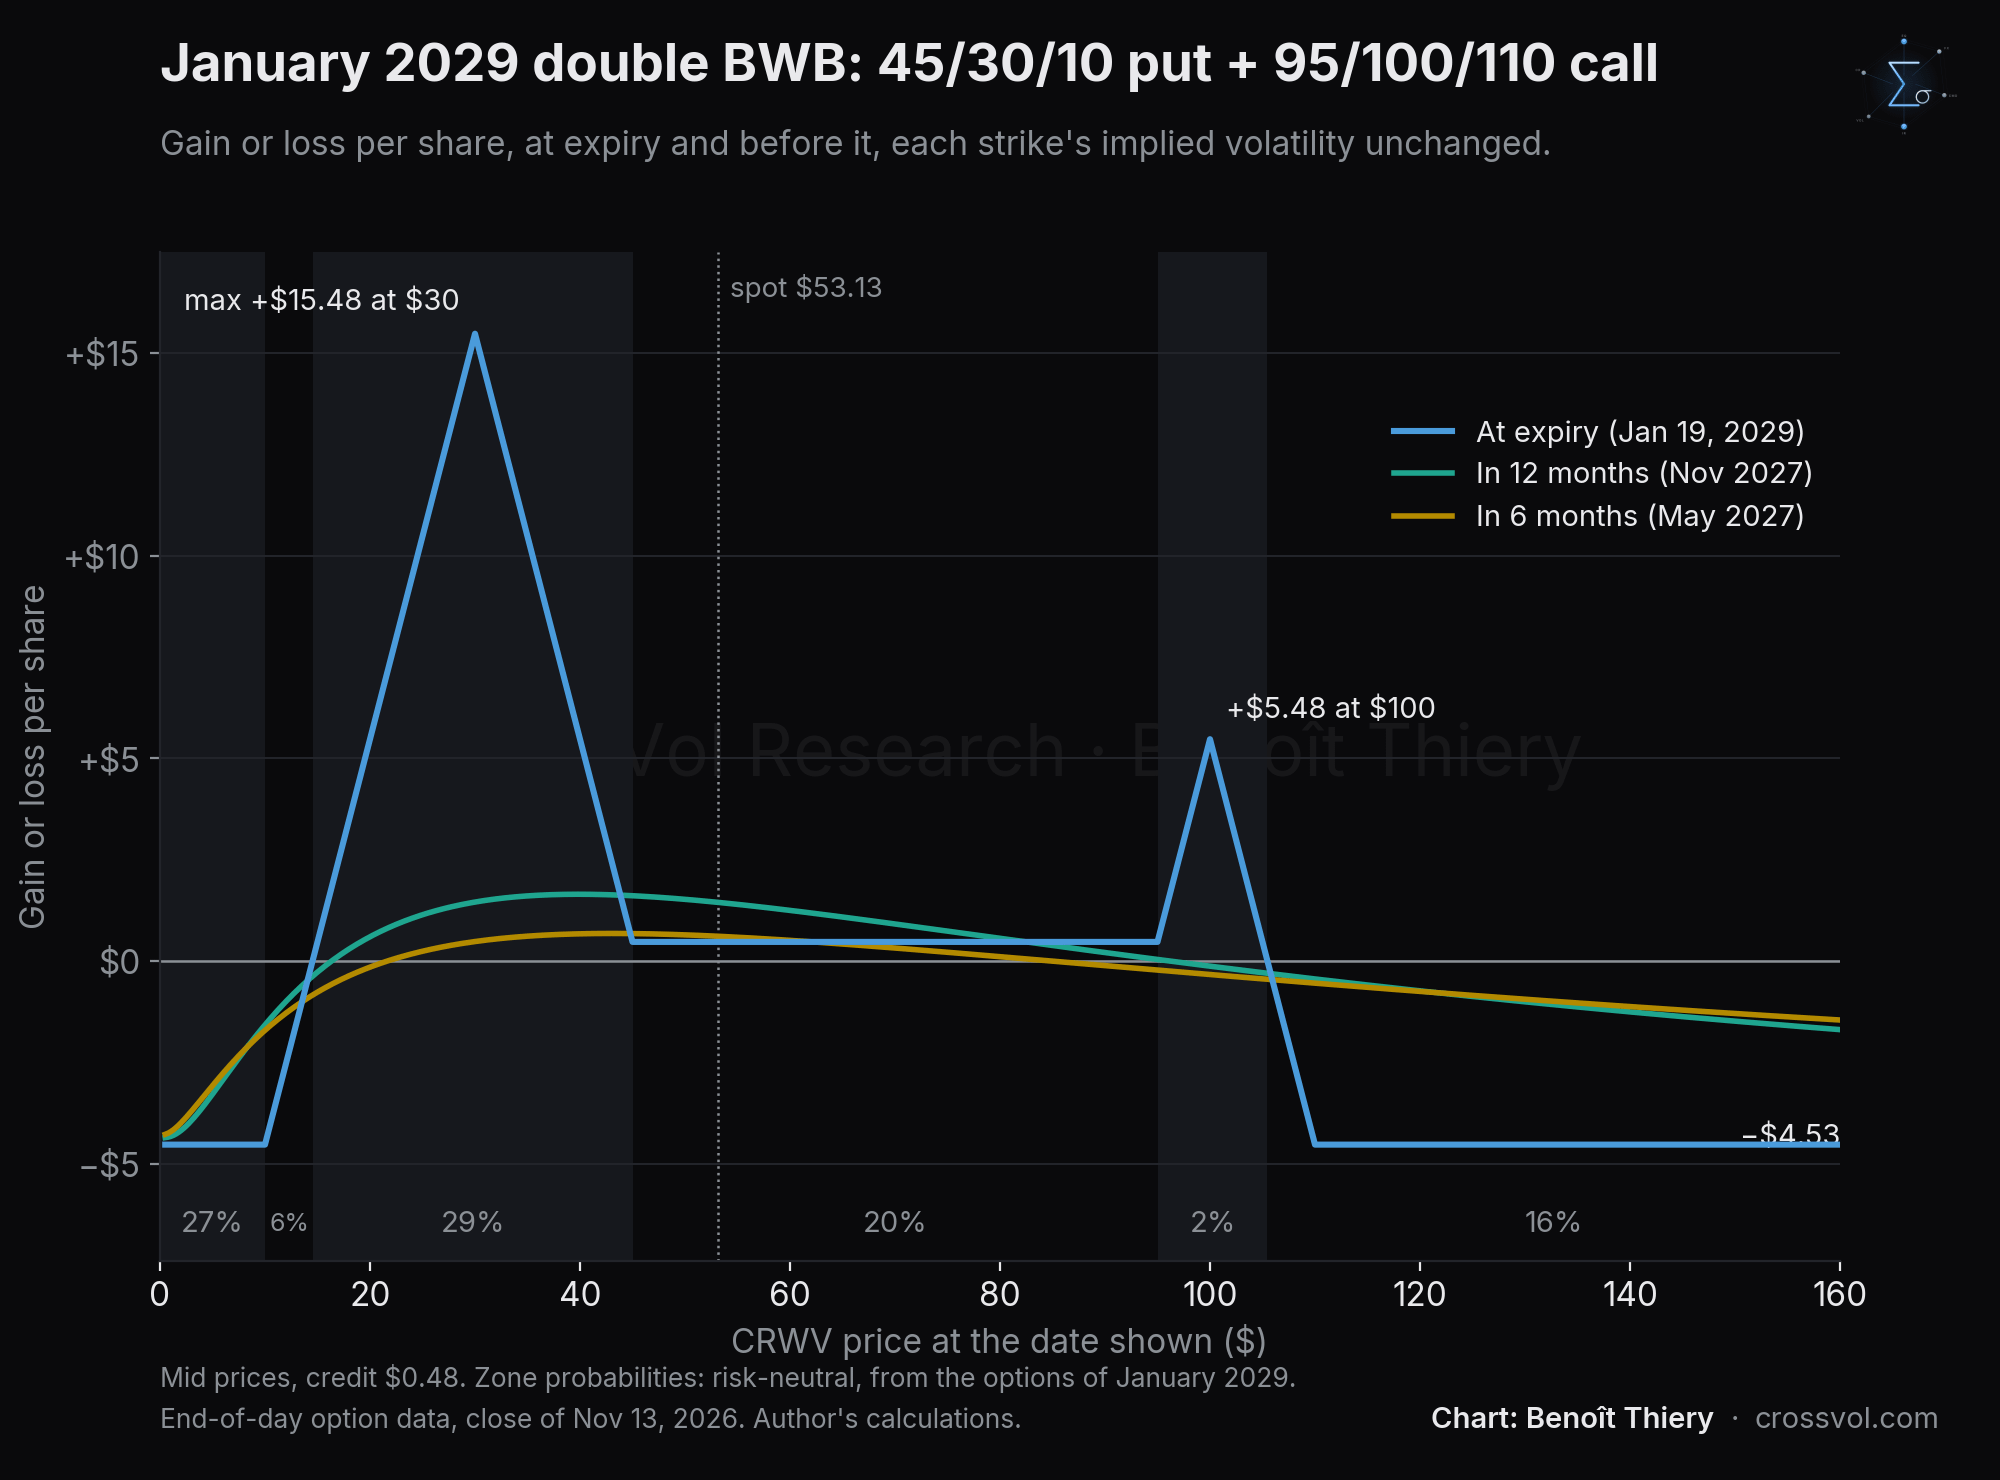
Payoff at expiry (per share, at the closing mid):
Maximum gain: +$15.48 at $30. The put side's profit zone runs from $14.5 to $45.
Secondary gain: +$5.48 at $100.
Between $45 and $95: the position keeps the credit, +$0.48.
Maximum loss: −$4.53, below $10 (bankruptcy) or above $110 (squeeze).
Breakevens: $14.53 and $105.48.
How to read the structure:
The put side is the heart of the trade. It sells the $30 put twice, the most expensive option on the smile relative to its risk, and buys the $45 put above and the $10 put below. This side's skew premium is +$0.82 per share: priced at ATM IV across the board, the put BWB would be worth $1.07, and it costs $0.25.
The $10 put is the bankruptcy insurance. It caps the loss below $10. It is the cheap option relative to the CDS (step 4).
The call side is a complement, not the heart of the trade. It brings in $0.73 of premium, which I keep as long as CRWV stays below $95, and adds a small profit peak at $100. I take it because I do not see CRWV climbing back above $95 before I exit. It has two flaws that I accept: it sells the only cheap wing of the smile (step 2), with a skew premium of only +$0.15, and it loses $4.28 per share above $110. The put BWB alone, in the table of alternatives below, is the version without that compromise.
In plain English: a butterfly is built on three strikes: you buy one option, sell two in the middle, and buy one further out. It makes money if the price finishes near the middle strike, and its loss is limited. Mine are "broken-wing" because their two wings are not the same distance from the middle.
Risk-neutral probabilities of each zone in January 2029:
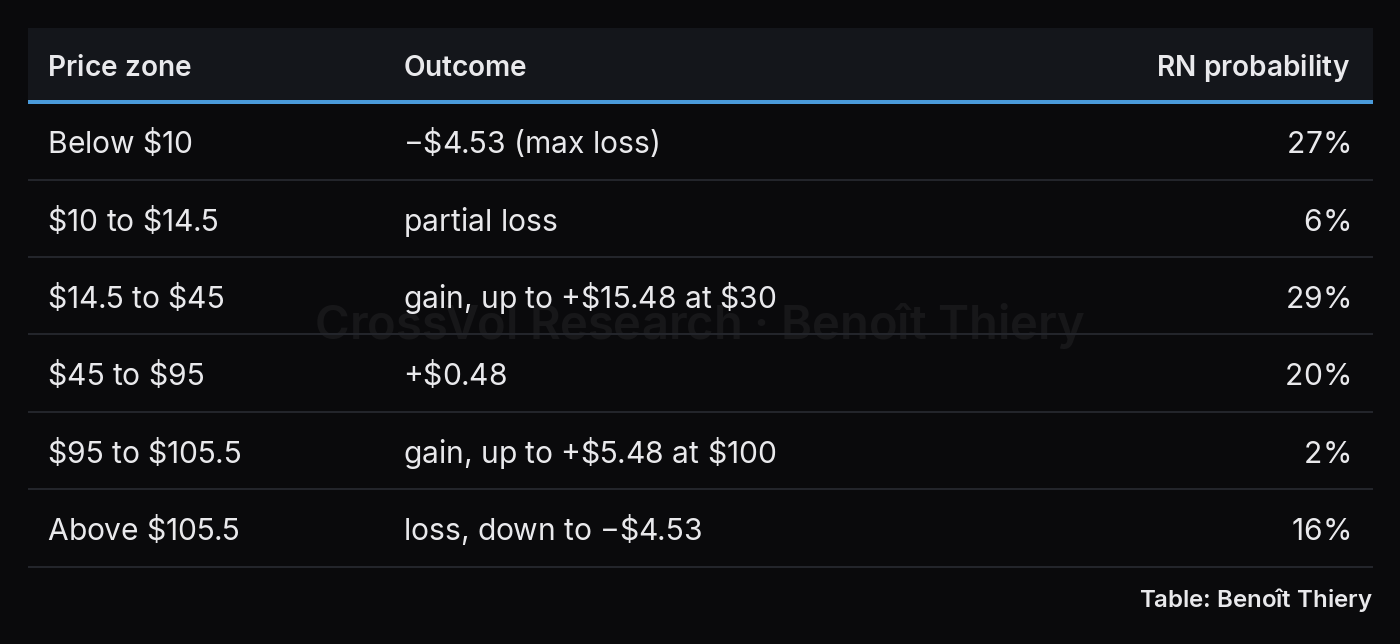
The risk-neutral probability of a gain is 51%. A standard calculator with a single volatility (87%) shows 58%, because it assumes a lognormal distribution. The distribution that options actually price has fatter tails, and those are precisely the tails that cost the structure money.
That 51% counts as winners the cases at +$0.48, against $4.53 at risk, so it says little on its own. The expected gain says more. At mid, under the market's risk-neutral probabilities, it is about zero by construction: the market prices the structure fairly by its own odds. The edge therefore has to come from the two sources described in "My read, in numbers": selling the most expensive part of the smile, and a risk premium that sits mostly in the downside tail.
Greeks:
delta −0.01: the position is direction-neutral today;
vega −$0.05 per vol point and per share, i.e. about −$5 per vol point per structure. A parallel 10-point rise in vol costs about $0.45 per share; a 10-point drop earns $0.48.
Before expiry, the position moves little. With IVs unchanged, it earns about +$0.64 in six months and +$1.48 in a year if the price does not move. In a year, it is worth about +$1.46 at $30, −$1.62 at $10 and −$1.46 at $150. Most of the profile only appears in the last months. I do not intend to hold to expiry, though: the section "Managing the position" details my early exit and what it earns.
The alternatives on the same expiry
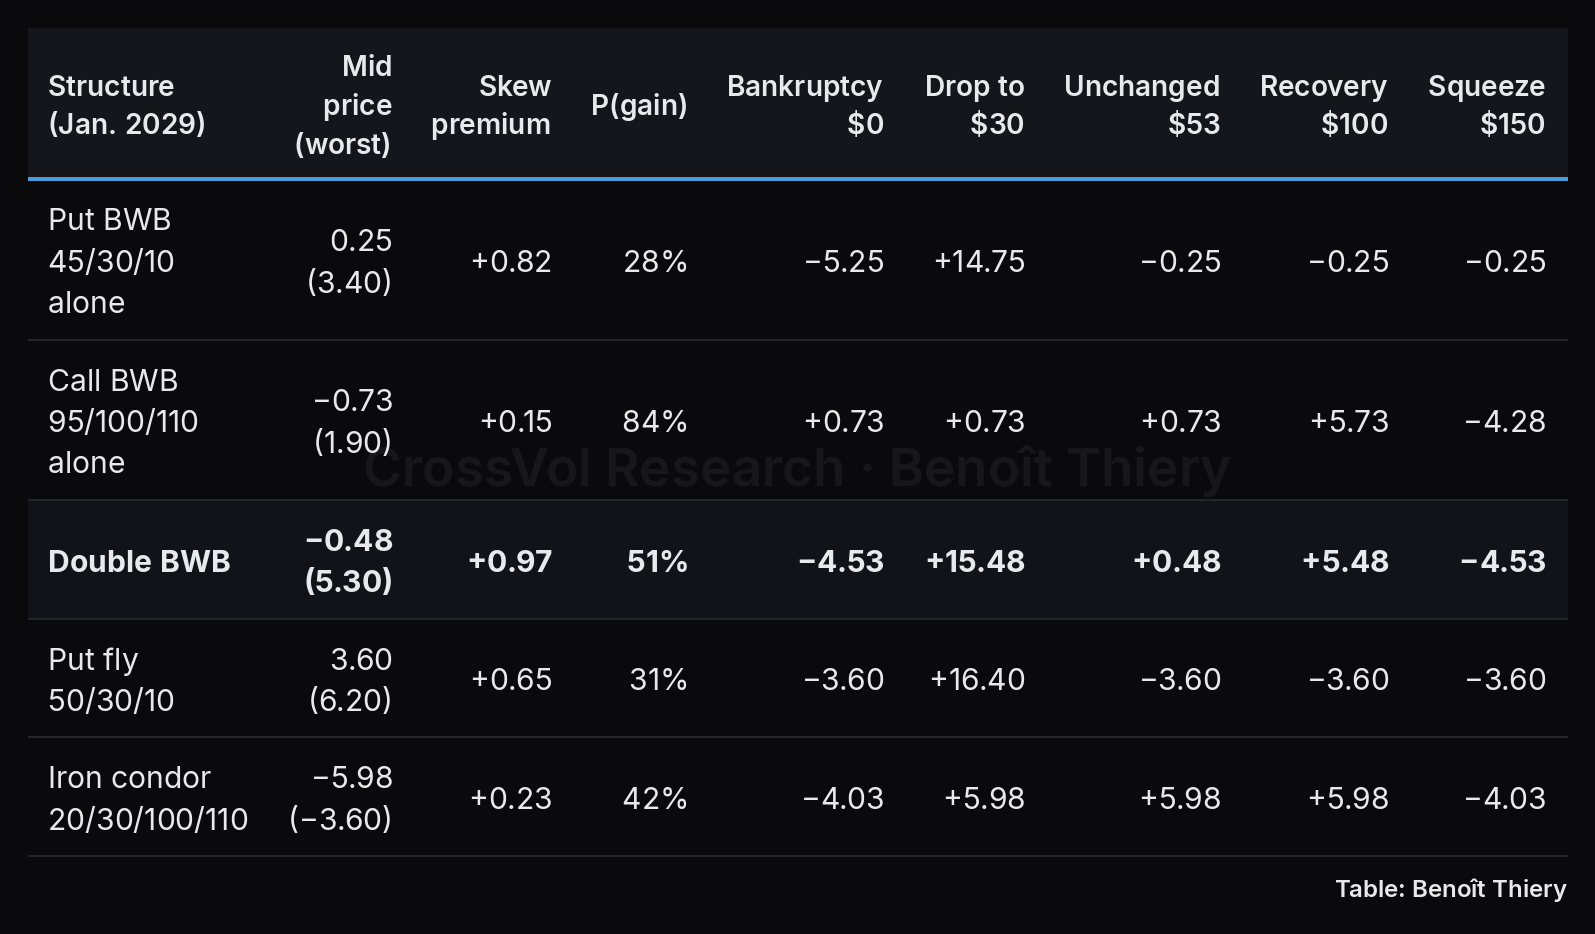
A negative price is a credit. The "worst" execution means buying at the ask and selling at the bid. The skew premium is the value of the structure if the whole expiry traded at ATM IV, minus its actual price: a positive number means that the structure sells the expensive part of the smile.
The put BWB alone carries all the skew premium, but it only makes money between about $15 and $45 (28%).
The double BWB keeps that premium, adds a credit and a second profit zone, and nearly doubles the probability of a gain. In exchange, it adds a $4.28 loss above $110, a scenario the market puts at 15%.
The iron condor makes money across the whole middle, but its skew premium is small (+$0.23), and it earns about two and a half times less than the double BWB if the stock slides toward $30 (+$5.98 against +$15.48). It suits those who believe in stability more than in an orderly decline.
Execution: the critical point
The combo has six legs, and LEAPS spreads are wide. At the closing mid, the structure brings in $0.48. At the worst prices, it costs $5.30. The gap between the two, about $5.8 per share, exceeds the maximum loss.
The mid itself moves a lot: on Friday morning, November 13, during the session, my platform showed it at about $1.93 of credit, against $0.48 at the close. A display like "+75% since entry" on a platform compares one mid with another mid. It does not tell you at what price you could actually get out.
So I enter BWB by BWB, always with limit orders, to control each execution price instead of suffering the spread of a six-leg combo:
First the 45/30/10 put BWB, as a single three-leg combo order with a price limit. I aim for zero cost or a small credit. I first ask for $0.30 of credit, then step down by $0.10, and at worst I accept a small debit: $1.00 per share at most, i.e. $100 per structure. This is the heart of the trade: if it does not fill within that limit, I do not enter at all.
Then the 95/100/110 call BWB, also as a combo order with a limit. I first ask for $0.90 of credit, then step down, without accepting less than $0.40. If it does not fill, I keep the put BWB alone, whose risk is known and limited.
These limits come from the November 13 closing prices and will move by the time of execution. The rule matters more than the numbers: never more than $100 of debit per structure on the put BWB, never more than about $0.33 below its mid on the call BWB, and never a single leg at market.
At the November 13 close, the put BWB was quoted at $0.25 of debit at mid: getting it at zero cost or for a credit therefore takes patience. The best sessions are those when volatility rises. Since the put BWB is short volatility (about −$0.05 per vol point and per share), a 10-point rise in vol takes it from about $0.25 of debit to about $0.20 of credit. A drop of a few dollars in the stock works the same way, more weakly.
The cost of the worst case I allow. If I pay $1.00 for the put BWB and collect only $0.40 on the call BWB, the whole position costs $0.60 of debit instead of bringing in $0.48. The maximum loss then rises to $5.60 per share ($560 per structure), the maximum gain at $30 falls to $14.40, and the $45 to $95 zone becomes a small loss of $0.60 instead of a small gain. That is the limit beyond which I do not enter.
Entering in two steps carries a risk: the price can move between the two orders. But the two BWBs are almost delta-neutral (+0.01 and −0.02), so a move of a few dollars changes their price little.
Managing the position: getting out before expiry
I do not want to be in the position during the last months. That is the period when a sudden drop does the most damage, because the profile gets close to the expiry payoff. My plan is to close by November 2028 at the latest, two months before expiry, and earlier if one of the thresholds below is hit.
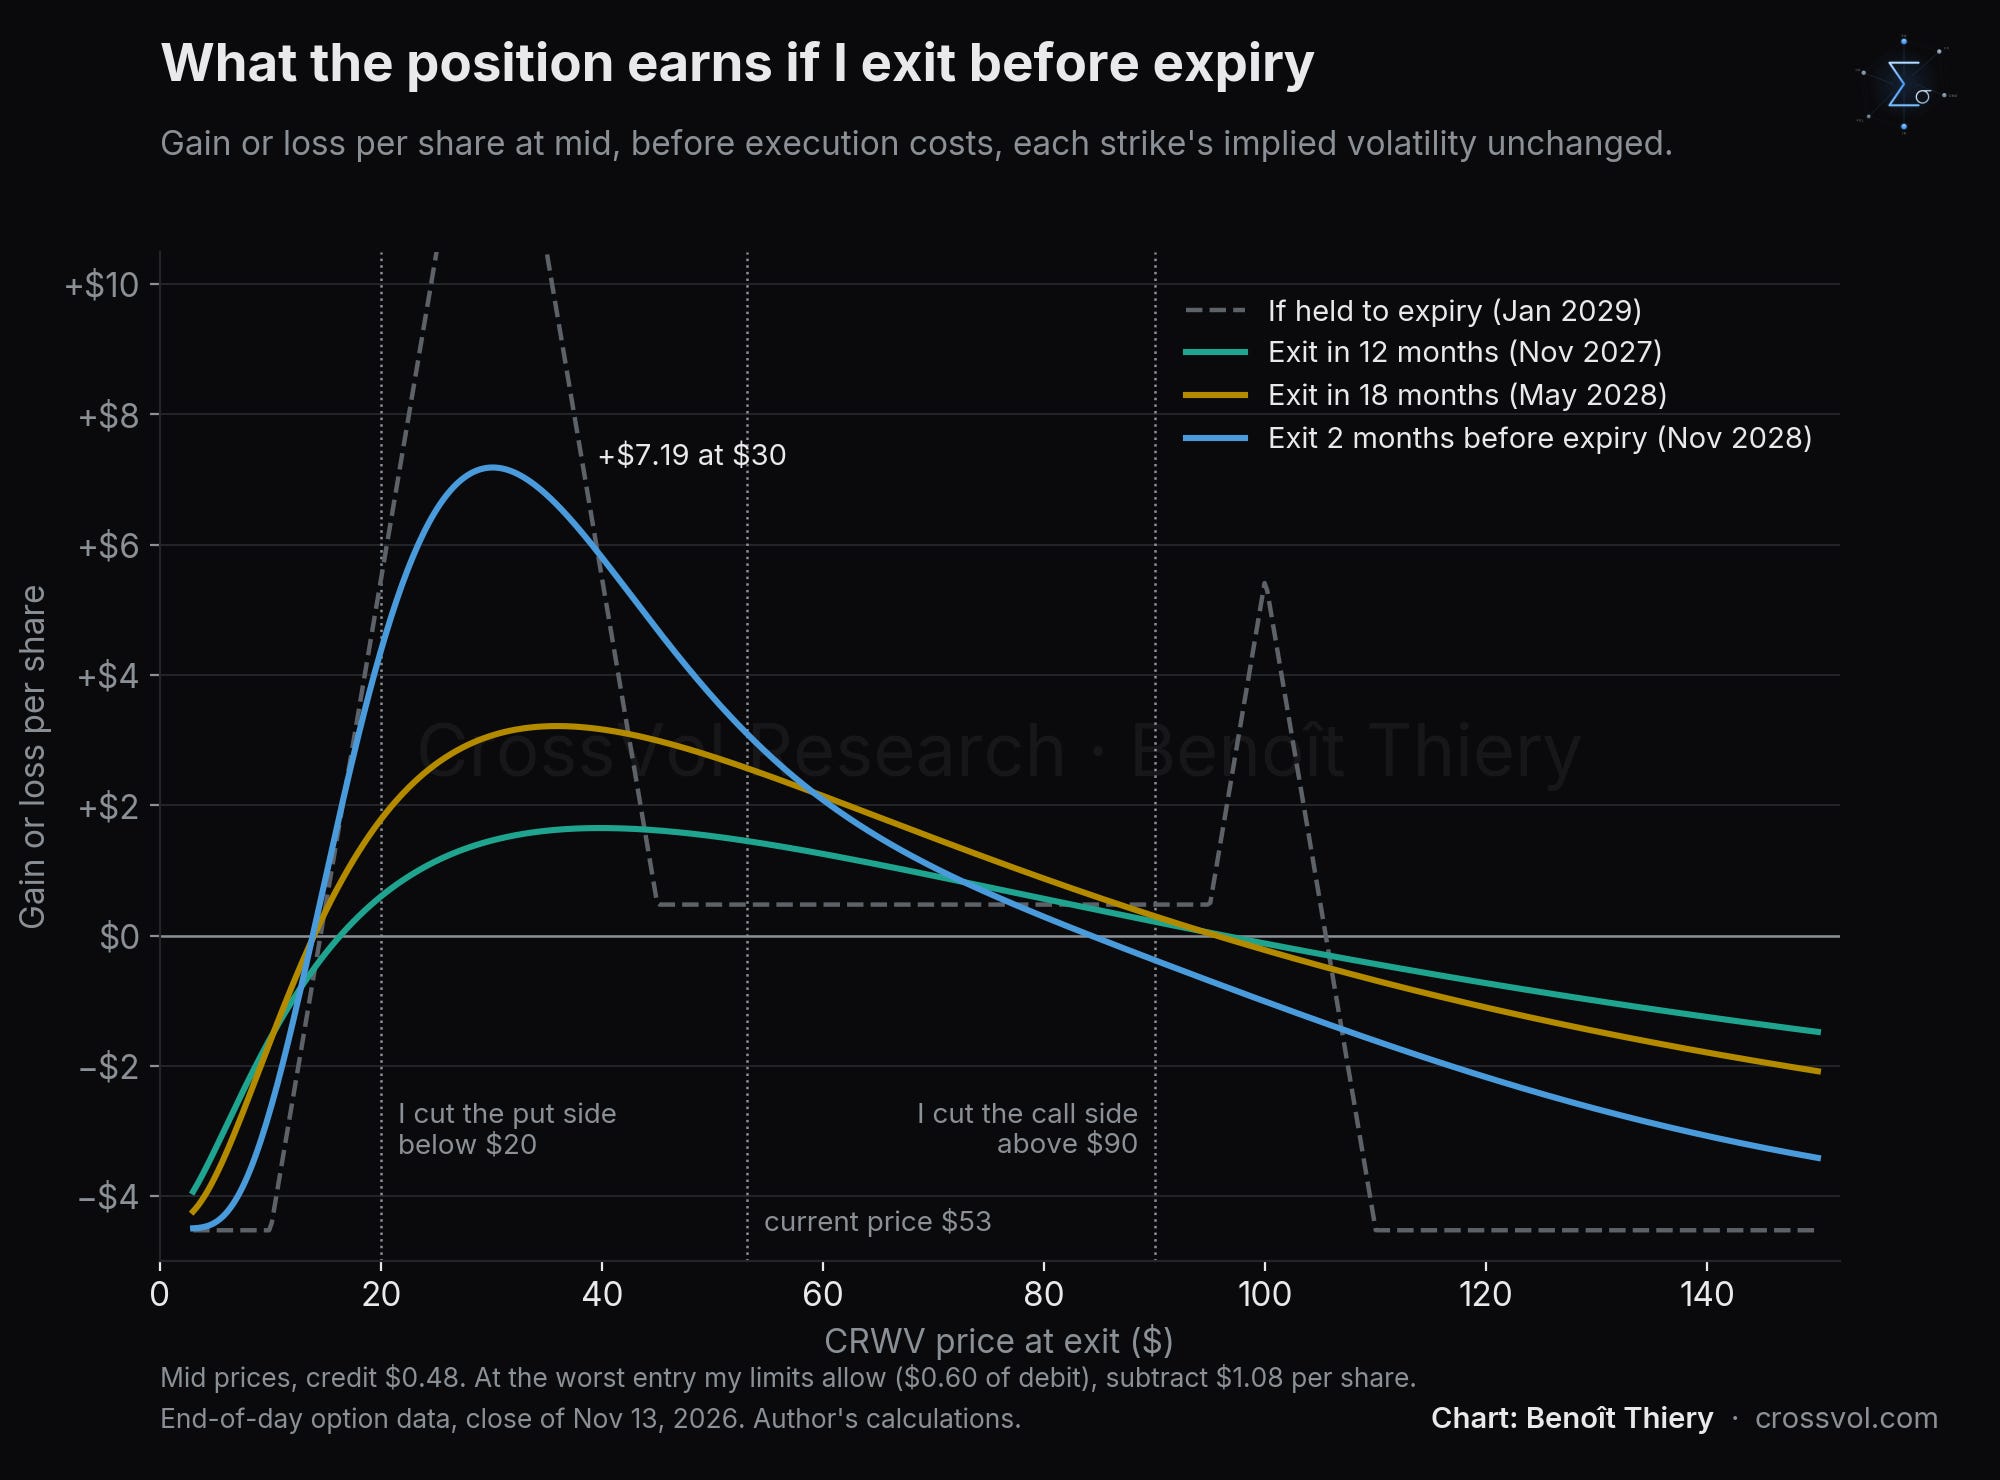
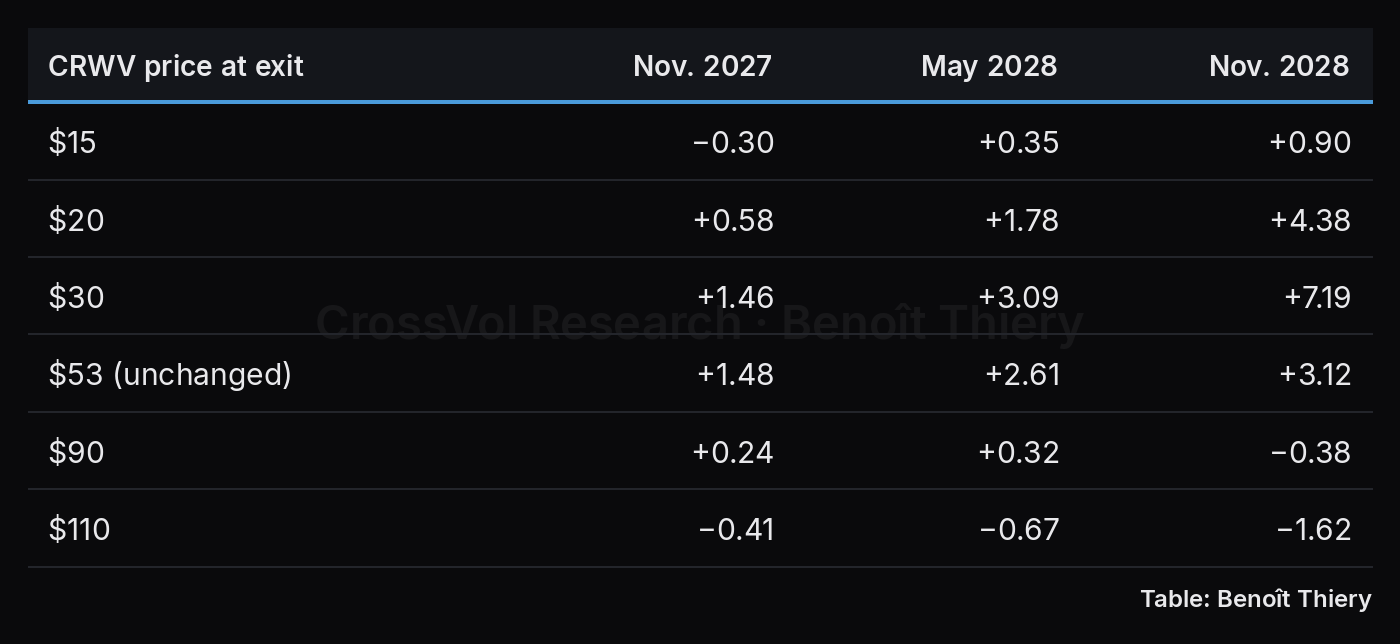
Gain or loss per share, at mid, each strike's IV unchanged, before execution costs (see check 1 below). The November 2028 column is an exit on November 13, 2028, two months before expiry.
Getting out early has a price: I give up the +$15.48 peak, which only exists at expiry. Two months before, the best case is around +$7. In exchange, the loss in a crash stays small as long as I respect my thresholds. Time works for me as long as CRWV stays between $20 and $90.
Why I think I can get out in time. I do not believe CRWV will fall to zero in a single session. If bankruptcy were to come, I expect a descent in steps: disappointing results, a failed refinancing, rating downgrades. Each step leaves time to apply the $20 rule. Six months from now, an exit at $20 would cost about −$0.17 per share, and about −$0.90 if IV rises 15 points during the fall.
I keep the $10 put all the same: one step can be very steep. CRWV had four sessions of −9% or −10% in two weeks, and a serious announcement can wipe out 30% to 50% overnight. Six months from now, even in a sudden fall to $10, the loss would be about −$1.80 per share instead of −$4.53.
My rules:
Planned exit: I close everything by November 2028 at the latest.
Lower threshold: if CRWV falls below $20, or if the CDS goes above 2,000 bp, I close the put BWB, whatever the date.
Upper threshold: if CRWV goes above $90, I close the call BWB (or roll it up). Above $110, it has lost all its potential.
Profit taking: if the refinancing is signed and the downside wing comes back toward +5 points, the put BWB gains value. I then take half the gain without waiting.
To close, I proceed as on entry: BWB by BWB, with limit orders.
Size: the maximum loss is about $4.50 per share at mid, i.e. $450 per structure, and up to $560 in the worst entry I allow. With a 27% risk-neutral probability of ending below $10 (21% below $5) and 22% to 33% for a default according to the CDS curve, I would not put more than 1% of capital at risk.
Delta hedging: temporary only, see below.
Early exercise: CRWV options are American. Assignment risk on the short $30 puts becomes real if the stock falls well below $30 and their time value disappears. CRWV pays no dividend, so the risk is low on the short $100 calls.
What about delta hedging? You can neutralize the position's sensitivity to the share price by buying or selling CRWV shares. Here is what that delta is worth, in share equivalents for one structure (100 shares):
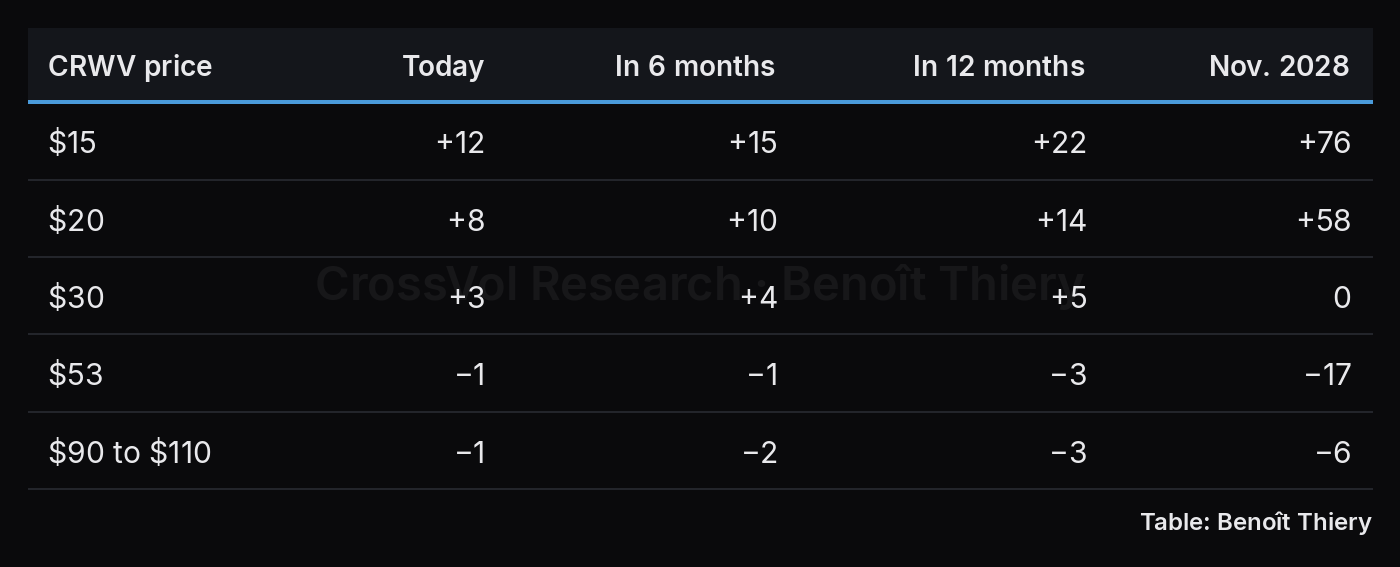
A positive delta means the position gains when the stock rises; hedging it means selling shares. Each strike's IV is held unchanged. The November 2028 column is at November 13, 2028.
Most of the time, it is tiny: 17 shares per structure at most. Hedging it all the time would cost more, in fees and bid/ask spreads, than it protects.
It only becomes significant in a fall below $20, especially late (+58 to +76 shares in November 2028), where my exit rule already applies.
It does not protect against the real risk. A delta hedge follows yesterday's price. If CRWV loses 40% overnight, it comes too late. Against that risk, the $10 put is what protects.
Hedging often is expensive. The hedge would make you sell after drops and buy back after rallies, several times over, on a stock whose realized volatility is above 100%.
So I will only use the stock as a bridge during the exit. Closing a BWB with limit orders can take hours, even days, whereas the stock trades instantly. If CRWV breaks $20:
I immediately sell short the equivalent of the put BWB's delta, i.e. 10 to 15 shares per structure at six or twelve months;
I then close the put BWB with limit orders, without rushing;
I buy the shares back as the options are closed.
Shorting CRWV has a cost and risks: borrowing the shares can be expensive, the shares can be recalled, and the loss is unlimited in a sharp rebound. That is why the hedge must stay small and brief.
In plain English: delta measures how much the position gains or loses when the stock moves by one dollar, expressed as a number of shares. Mine is very small, except if the stock collapses. So I do not hedge it in normal times. I sell a few shares only for the time it takes to get out of my options, when the price breaks my threshold.
A possible adjustment, later: a calendar spread. If the decline stabilizes above $45, the position keeps earning slowly with time (about +$1.5 per share in a year at an unchanged price), but at expiry, between $45 and $95, it would only keep its credit. I would then consider adding a calendar spread around $45 to $50, that is, selling an option on a near expiry and buying the same option on a later one. It makes money if the stock stays near its strike, because the short option loses its time value faster than the long one.
The put BWB acts as partial protection for it. If CRWV falls back below $45, the calendar loses, but the put BWB gains, with a peak at $30. That protection stays modest while expiry is far away: in a year, the put BWB is only up about +$0.9 per share at $30. And it only works one way: if the stock rebounds sharply, the calendar loses too, and nothing offsets it, since the call BWB itself loses above $110. The calendar will therefore have to be small relative to the put BWB.
I will not do it now, for two reasons. First, the market concentrates the risk in 2027 (step 1): refinancing, quarterly results, rating. I want to be past those deadlines before adding a position that bets on stability. Second, a calendar is judged on the day's prices, especially on the gap between short-dated and long-dated volatility. I will publish the detailed numbers when the time comes, with the same rules: limit orders on entry, maximum loss known before entering.
What would prove me wrong
Bankruptcy. If CoreWeave does not refinance and credit is right, the stock heads to zero. If the fall comes in steps, my $20 rule limits the loss to about $1 per share. If it comes all at once, the loss can reach the maximum stake of $4.53. It is the main risk, and credit sees it as more likely than options do.
A squeeze beyond $110. A renewed AI cycle, a buyout or a major announcement could double the stock. The market gives this scenario 15%, and the call side then loses $4.28. That is the deliberate bet of the call BWB: I do not believe in a rebound above $95. If I am wrong, my $90 rule gets me out before the maximum loss zone.
A general rise in volatility. Vega is small, but a +20-point shock across the whole surface costs about $0.90 in the short term, and it could force an exit at the wrong time.
Execution. With $5.8 between the mid and the worst price, a poorly executed entry or exit can wipe out the expected return on its own.
Realized volatility that stays above implied. Since April 2025, CRWV has moved more than its options predicted (106% realized volatility against 86% to 89% implied). I sell the gap between the $30 put and ATM, not the level of vol, but if the stock keeps moving this much, it will cross my thresholds more often, and I will have to get out earlier than planned.
Five checks before believing these numbers
The prices are closing mids. The gap with the worst price reaches $5.8 per share on the full combo. All the gains shown assume execution close to mid. At the worst entry my limits allow ($0.60 of debit instead of $0.48 of credit, i.e. $1.08 less), the November 2027 exit at an unchanged price falls from about +$1.48 to about +$0.40, before exit costs.
The exit grid assumes unchanged volatilities. In a fall, volatility usually rises. An exit at $20 in six months costs −$0.17 per share at unchanged volatility, but about −$0.90 if it rises 15 points. The bearish scenarios of the grid are therefore optimistic.
The percentiles rest on a short history. CRWV options have only existed since 2025: "at the 99th percentile" means "at the highest in 14 months", not "at the highest in twenty years".
The probabilities are risk-neutral. They include the fear premium, which is in fact the heart of the thesis. They are not forecasts.
The plumbing rests on a sign assumption. The net direction of calls is unknown, hence the range given in step 7, and if volatility sellers other than market makers supplied part of the puts, the hedging pressure is weaker than calculated. Only two conclusions hold under every assumption: the pressure is to the downside at the current price, and it eases sharply below $30.
What I am watching, and the verdict I will publish
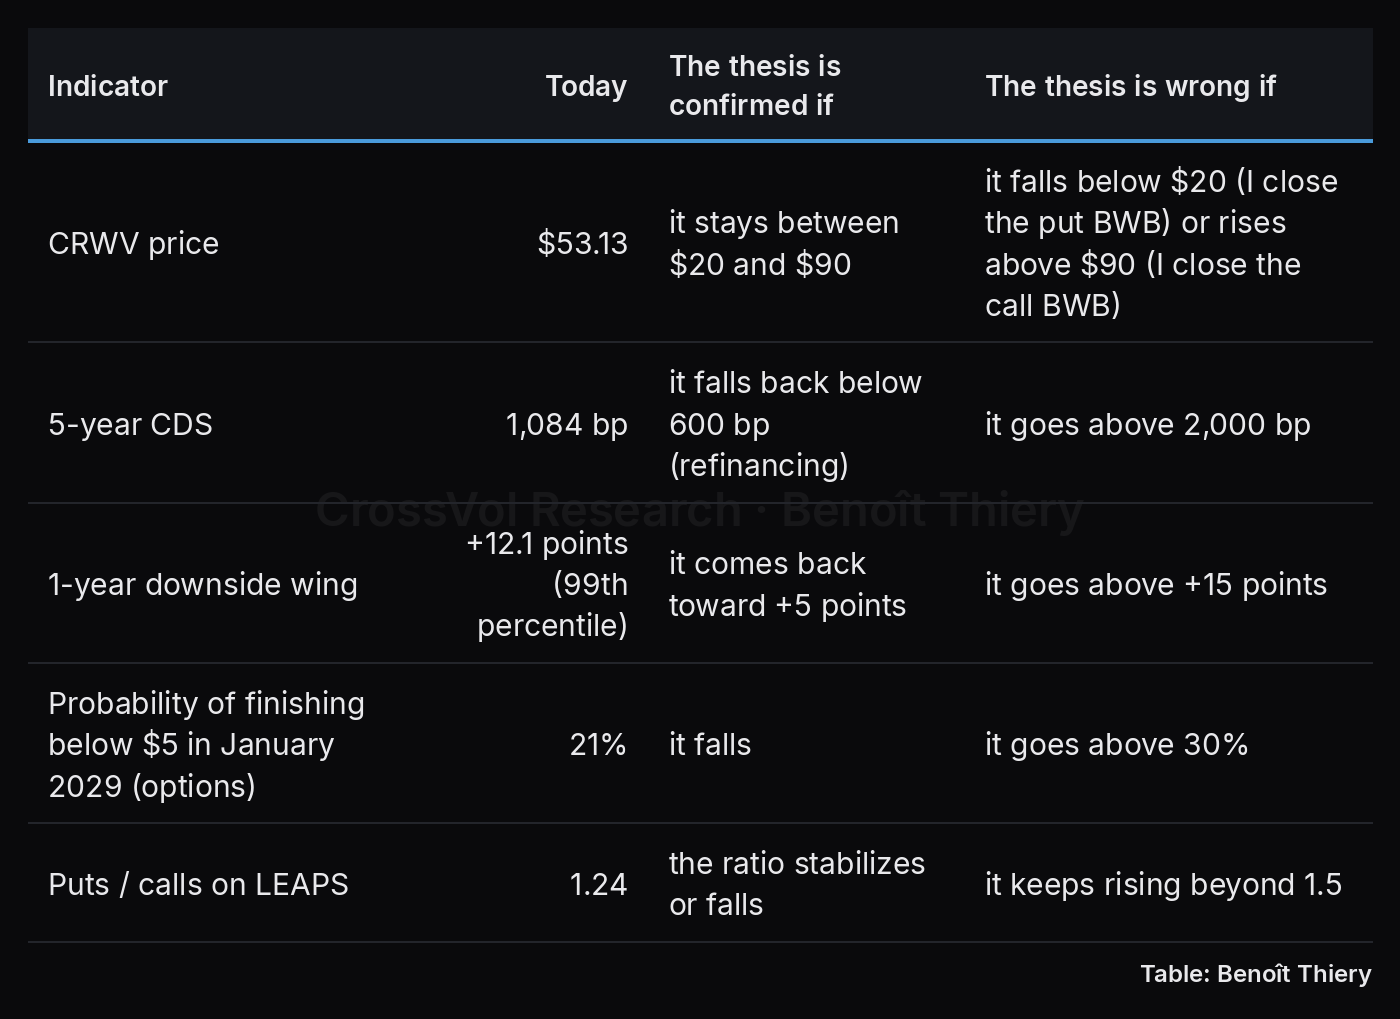
I will come back to this table at every update, with the same indicators and the same thresholds, and I will publish the verdict even if it goes against me.
In one sentence
The market is paying for fear on both sides. I sell it on the $30 put, keep the insurance at $10, and get out before fear is proven right.
Method and data
Data: end-of-day option chains and open interest, close of November 13, 2026, history since April 2025. CoreWeave CDS curve at the close of November 13, 2026, from six months to ten years (5-year: 1,083.8 bp). Daily closes and average volumes of CRWV since its listing.
Implied volatilities: recomputed from mid prices.
Term structure: at-the-money (spot) implied volatility of each listed expiry, read on the day's implied volatility surface; the one- and two-year points are interpolated.
Risk-neutral distribution: derived from the listed options of each expiry, after smoothing their implied volatilities: the way option prices change from one strike to the next gives the probability the market assigns to each price level.
Skew premium: value of the structure if the whole expiry traded at ATM IV (84%, the at-the-money vol of January 2029), minus its mid price.
CDS-implied default: default intensity derived from the spread, spread / (1 − recovery), for a recovery of 20% to 40%, projected over 2.2 years, with the 5-year spread and with the curve interpolated at 2.2 years.
Footprint: change in open interest on expiries more than a year out between the October 15 and November 12 closes, compared with the volume traded over the period; implied volatilities on both dates. This ratio approximates the share of trades that open a position: it does not tell the buyer from the seller.
Plumbing: market makers' gamma exposure at each price level, summed over all listed options from their open interest, each strike's IV unchanged. Puts are counted as sold by market makers; calls are left out in the central case, then counted one way and then the other for the range.
Intermediate profiles and exit values: each strike's IV held unchanged, before execution costs.
Limits: the probabilities are risk-neutral and include risk premia. LEAPS have bid/ask spreads of 7 to 15 vol points, so all the numbers are orders of magnitude.
This article is published for educational purposes. It does not constitute investment advice or a recommendation. Options and other derivatives carry a high risk of loss.
This article is by Benoît Thiery, CrossVol Derivatives Team. The analysis, the views and the trade are the author's own; CrossVol Research publishes them for educational purposes.
CrossVol Research is the research desk of CrossVol (crossvol.com), an options analytics platform for derivatives traders.
How to cite: Benoît Thiery, CrossVol Research, "CoreWeave (CRWV) LEAPS Price Fear on Both Sides: A January 2029 Double Broken-Wing Butterfly", 15 November 2026. https://newsletter.crossvolresearch.com/p/crwv-leaps-fear-both-sides-double-broken-wing-butterfly
Thanks for sharing this perspective. I love how smart and well-crafted this strategy is