

By Djellal Djouad
The most crowded trade in markets right now is not a single ticker. It is a posture. Long oil, long equities, short bonds. Three separate expressions that all say the same thing: inflation runs hot, the cycle stays late, and the Fed has no room to ease. The systematic community, the discretionary crowd, and the options tape have all leaned into that view at once, and each leg now sits at a positioning extreme rather than somewhere in the middle of its range. When a whole market shares one thesis and funds it from the same corner of the distribution, the question stops being whether the thesis is right. It becomes what happens if everyone tries to get out of the door at once.
This week supplies the door. The FOMC decides on Wednesday, September 16, with futures pricing a hike near 88 percent, and the largest options expiry of the season lands 48 hours later on Friday, September 18. Dealer gamma is deeply negative, the put book expiring Friday is heavy, and the vol surface is priced for a quiet week. That combination is a squeeze setup in both directions. The market has built one enormous one-way bet and handed the Fed the trigger. If Warsh blinks dovish, or delivers the expected hike without escalating the hawkish message, the mechanics point up. If the hike arrives with hard guidance, they point down. The point of this note is not to call the direction. It is to show why the move, whichever way it breaks, is likely larger than the vol market is charging for.
The one-way book
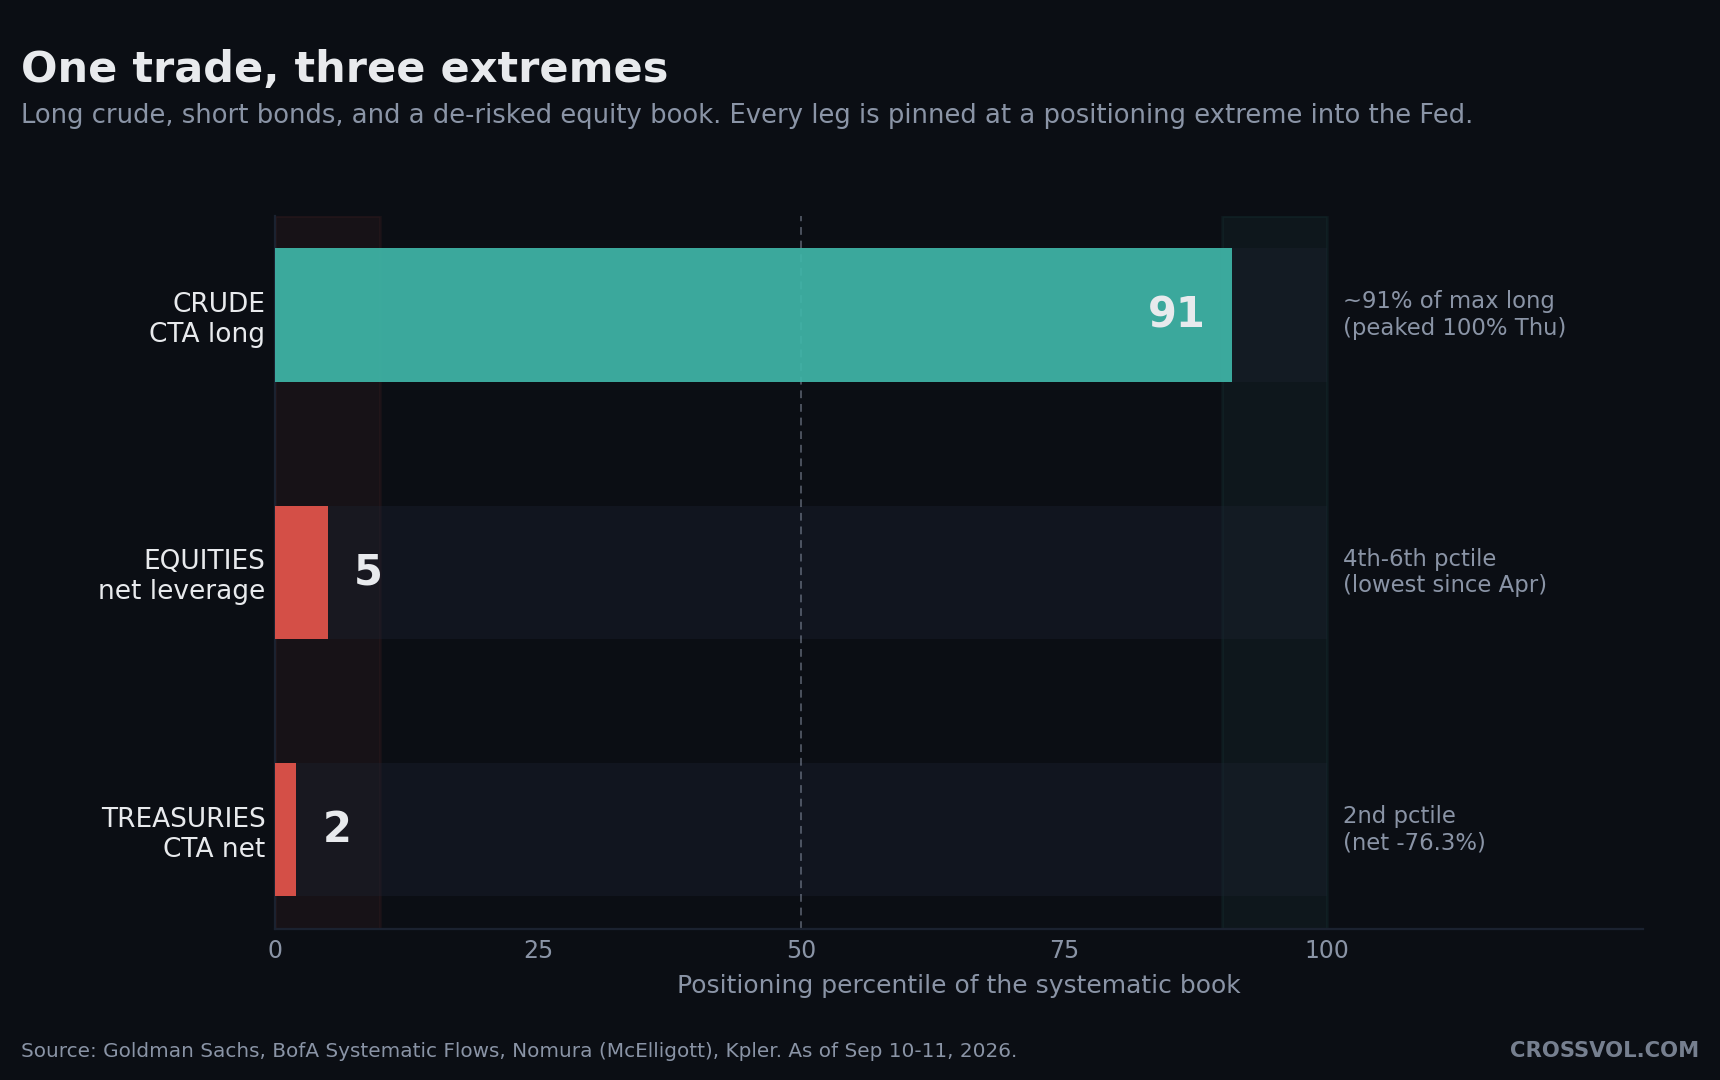
Start with crude. CTA length in oil reached roughly 91 percent of maximum long by September 11 according to Goldman Sachs, after tagging 100 percent on Thursday per Kpler data cited by Rigzone, against a prior baseline near 45 percent in Brent and 36 percent in WTI. JPMorgan places the reading around the 85th percentile. What matters is not the level but the exhaustion it implies. At the ceiling the mechanical bid is spent: no systematic buyer left to add on the next tick higher, only sellers waiting on a reversal.
Now the mirror. CTA positioning in Treasuries sits at net negative 76.3 percent, roughly the 2nd percentile, per Nomura's Charlie McElligott on September 10, with BofA's Systematic Flows work calling the cohort heavily short as of September 4. Long the inflation asset at the top of its range, short the duration asset at the bottom of its. It is the same trade written twice. Equities complete the triangle. Net leverage in long/short books is pinned at the 4th to 6th percentile, the lowest since Liberation Day, with gross exposure down near the 20th percentile per Goldman and Nomura. The horizon nuance matters and should not be flattened into a contradiction: JPMorgan reads short-term systematic trend as roughly neutral, while BofA reads medium and long-term trend signals as near maximum long on every index. Different lookbacks, both true. The aggregate systematic book still resolves to long commodities, long equities, short bonds, the classic inflation and hawkish tilt, stretched at both ends.
The price tape under that posture was ugly until it wasn't. Four red sessions Monday through Thursday, then a hard Friday bounce, the Dow up 500 to 600 points, the S&P higher by 1.1 percent, the Nasdaq up 1.3 percent, snapping a four-day losing streak. For the week the S&P 500 still finished near 7,591, down 2.0 percent, the Dow near 52,064 off 3.0 percent, the Nasdaq near 26,081 down 1.3 percent. Energy was the only sector green at plus 0.7 percent, Health Care fell 4.4 percent. Breadth is the tell: only 36 percent of S&P names sit above their 50-day average, down from 71 percent in July, and the Hindenburg omen has fired nine times in 30 days, a cluster historically followed by a median drawdown near 6.9 percent.
The plumbing
Positioning extremes are potential energy. Dealer gamma is the wire that carries it. BofA estimated delta-hedgers net short about 55.9 billion dollars of SPX gamma as of September 9, a regime that flipped from long gamma in early August to short gamma on the back of record call buying. The mechanical consequence is unforgiving. When dealers are short gamma, hedging forces them to chase price, selling into weakness and buying into strength, which amplifies whatever move the market starts. A catalyst does not need to be large, only large enough to make the dealer book move, and the dealer book does the rest.
Layer the positioning on top of that wire and the asymmetry sharpens. A stretched long that has run out of buyers does not need selling to fall, only the absence of the next bid. A record short covers fast because covering is buying, and buying into short gamma gets amplified upward. So the same event resolves through two accelerants: the unwind of a saturated position and the dealer re-hedge that magnifies it. On the rates leg this has a name. The extreme CTA short in Treasuries is a convexity catalyst. If yields fall, CTA short-covering stacks a second layer of mechanical demand on top of risk-parity flows already rebuilding bond weight, what BofA describes as a more supportive mechanical regime. The bond squeeze and the equity squeeze share a trigger, and a dovish surprise pulls both at once.
The 48-hour window
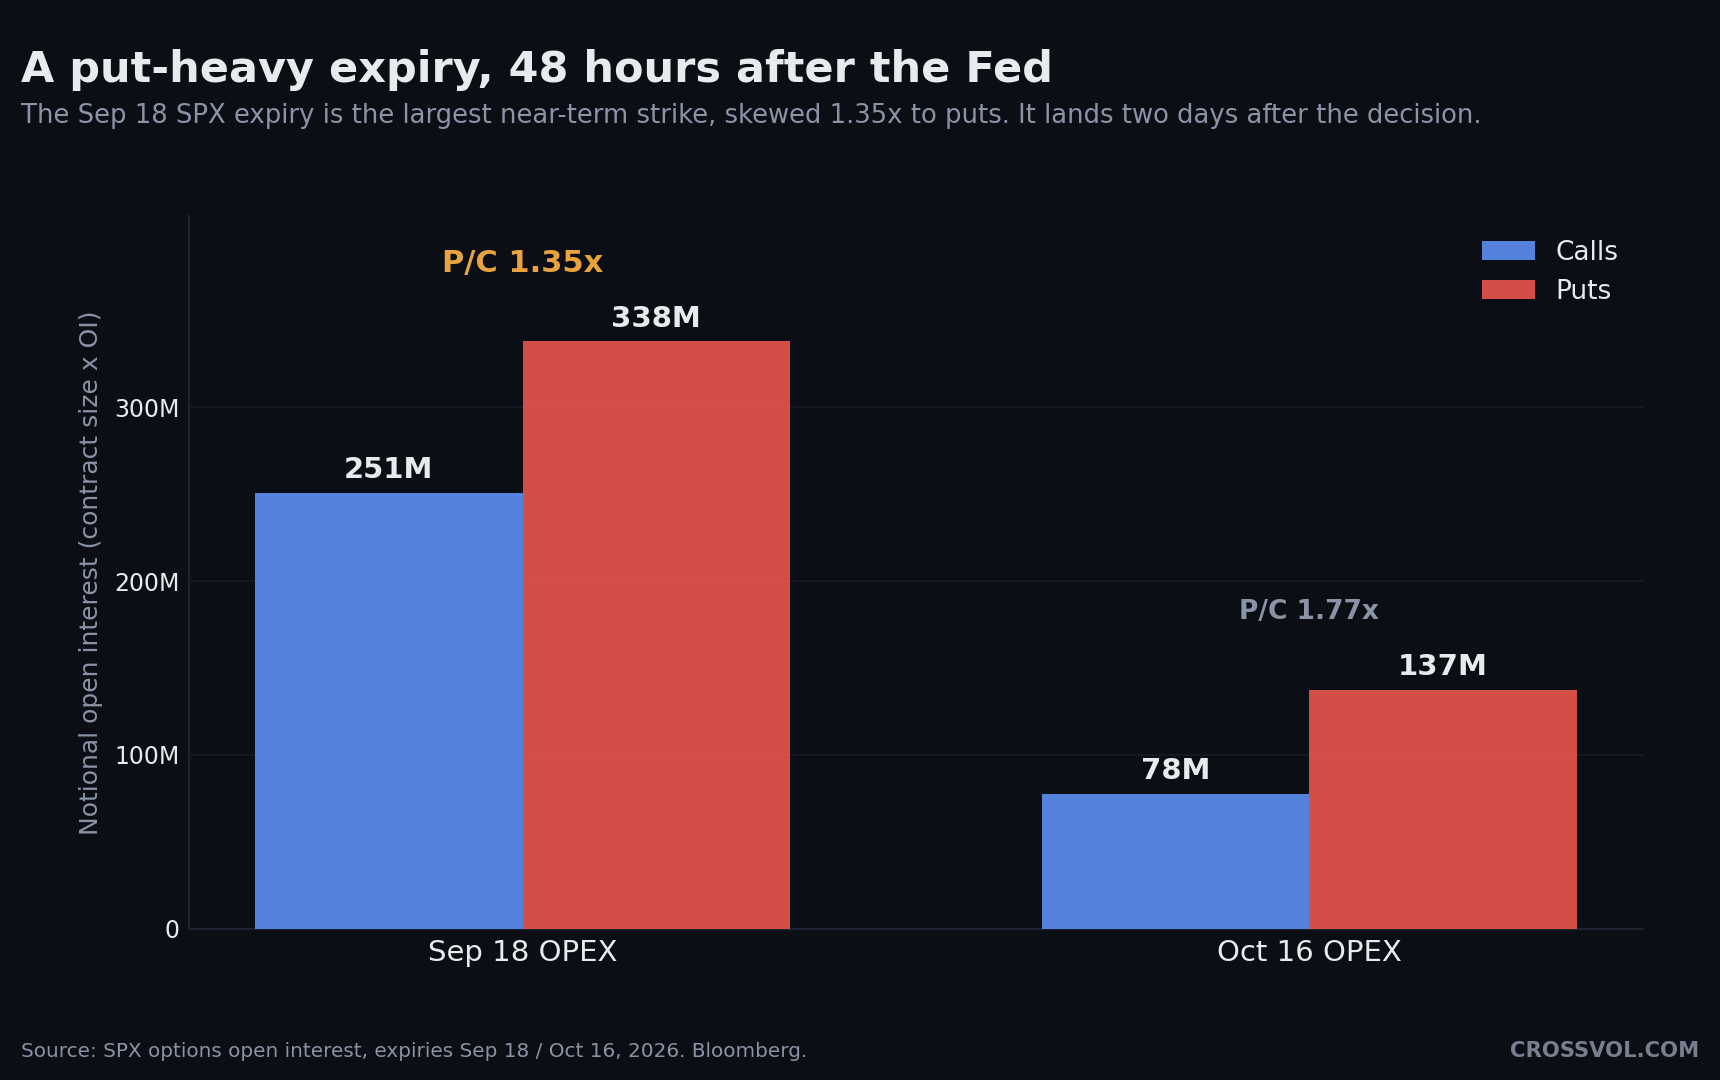
The calendar compresses all of this into two days. The FOMC decides Wednesday. The largest nearby expiry clears Friday. SPX open interest for September 18 shows calls at 250.9 million notional against puts at 337.9 million, a put/call ratio near 1.35, a 35 percent put overhang expiring exactly 48 hours after the Fed. October 16 keeps the bearish tilt with calls at 77.8 million against puts at 137.3 million. Three paths run through the window. In the base case, a 25 basis point hike roughly 88 percent priced, the reaction is sell the rumor, buy the news: a relief rally into Friday lets the put book expire worthless, dealers unwind hedges, and the proximity of expiry raises the odds of a gamma squeeze. In the hold surprise, equities and bonds rally together as yields drop, the put book collapses, vanna and charm flows accelerate the move, and a short-dated vol crush amplifies it. In the tail, a hike delivered with hawkish guidance, the put book gets validated, the market sells into the expiry, dealers short those puts sell more delta in negative gamma, and the 338 million of put open interest makes this the most dangerous outcome.
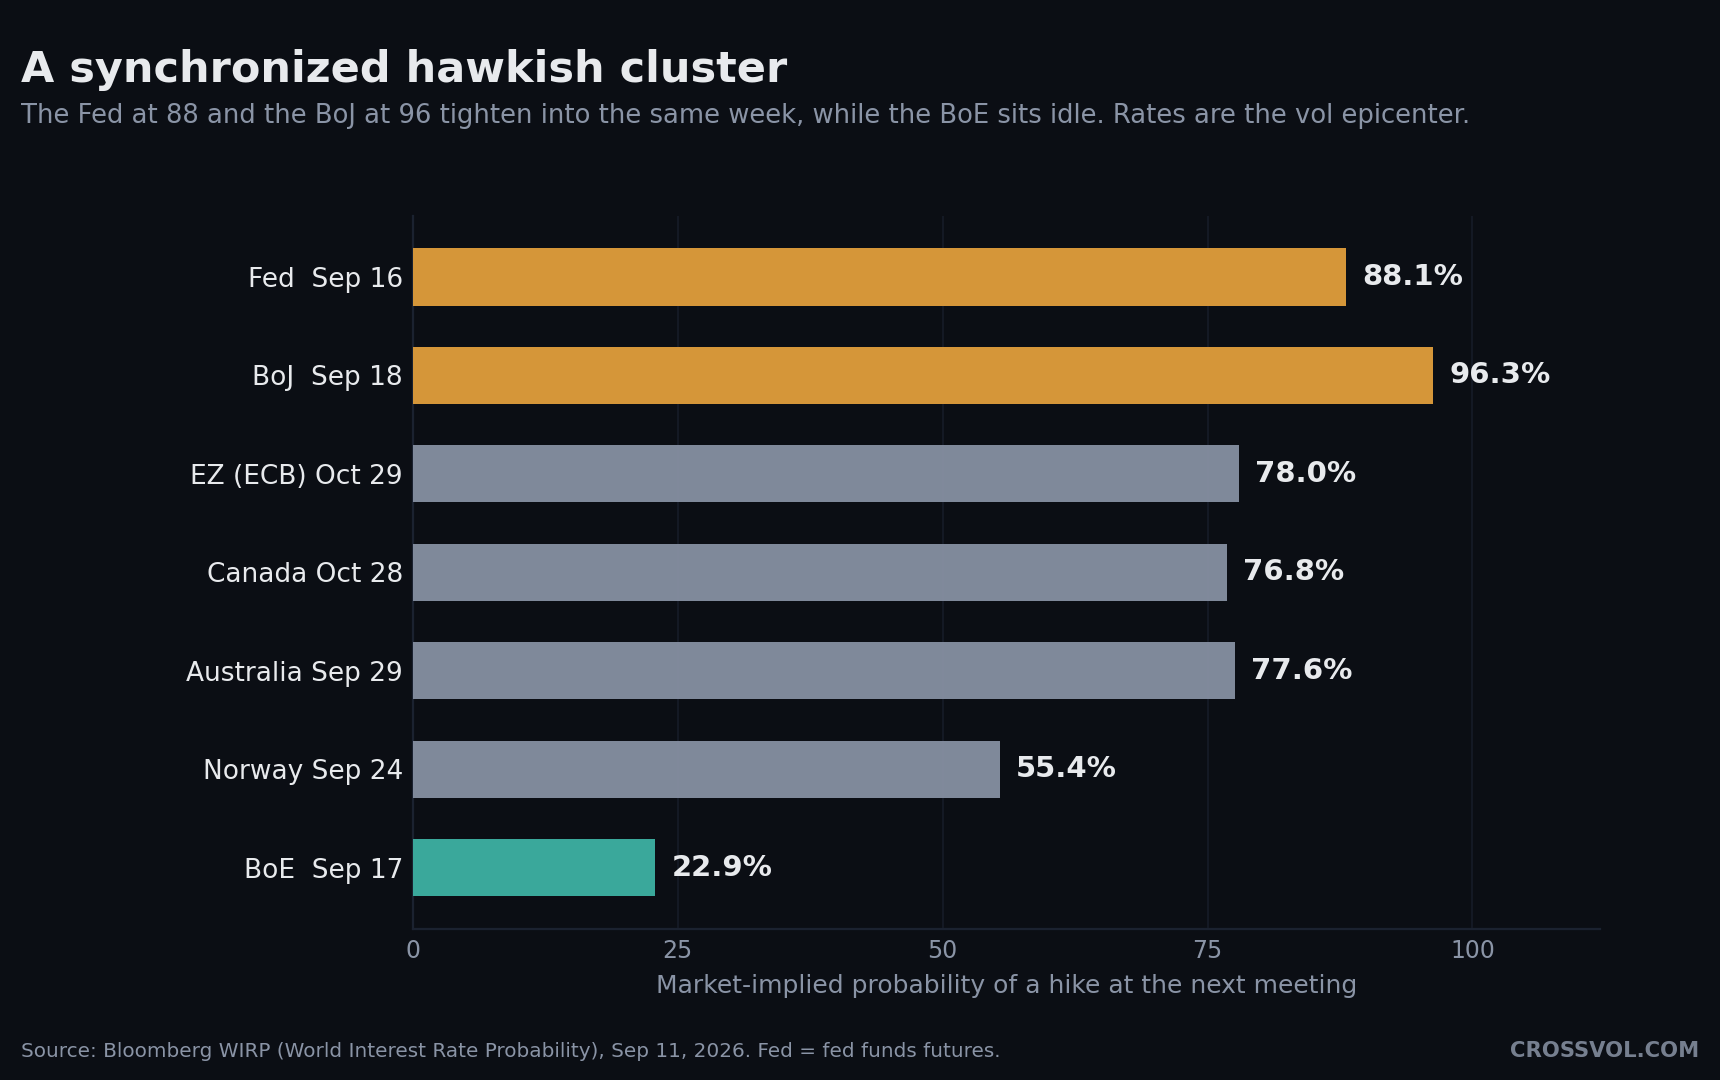
The tension the market carries is that the base case is not the consensus case. WIRP on September 11 put the hike probability at 88.1 percent on fed funds futures and 86.4 percent on OIS, with OIS implying about 21 basis points for the meeting and two hikes by year-end, and Goldman moved to a 25 basis point hike call. Yet a majority of economists surveyed by Bloomberg still expect a hold, citing cooling inflation momentum and proximity to the midterms. Market and consensus disagree, which is itself a source of gap risk. Over it all hangs the credibility question around a Warsh-led Fed, framed neutrally: one view holds that a new chair must deliver a decisive move to anchor expectations, lest the door open to further hikes near-term. That is a debate, not a forecast.
What the vol market is not pricing
Here is the crux. The vol surface is priced for a quiet week into a binary event. VIX sits at 17.8 to 18.7, up 8 to 12 percent on the week, elevated but nowhere near panic. The internal skew tells the real story. VIX three-month call skew is at the 91st percentile per Nomura, tail-up demand exploding. Yet SPX downside skew, the three-month 95 to 100 percent measure, sits near historic lows per UBS, so downside protection is cheap relative to upside. That is the hard number that says the market is charging for a calm week even as it hedges the melt-up. Dispersion and factor vol sit at the 90th percentile versus five years per Morgan Stanley. The MOVE index rose while the VIX fell, locating the epicenter of volatility in rates, and the 100-day gold to S&P correlation near 0.52 is the highest in decades, meaning the diversifiers now trade like stocks. A market that bids tail-up calls and sells downside skew has already decided which way the surprise goes, and that decision is one-sided.
The catalysts
The bond leg is priced for the same one-way world. The 10-year UST tested 4.9 to 5.0 percent, the highest since late 2023, the 30-year reached 5.34 to 5.36 percent, the highest since 2007, and the 2-year sits near 4.5 to 4.6 percent, up 13 to 16 basis points on the week. The drivers are real: core CPI at plus 0.29 percent month over month against plus 0.23 expected and plus 2.4 percent year over year, PPI at plus 0.4 percent, oil above 100 dollars, a term premium near 0.8 percent against a long-run 1.4 percent per ABN AMRO, and heavy IG supply tied to AI capex. The Treasury buyback executed only about 5.2 billion of 10.5 billion offered and did not cap yields.
The week itself is a detonator calendar. Monday, September 15, brings a meeting on a Hormuz deal, and with CTAs at max long in crude the discretionary buying power is largely spent, so any de-escalation removes a structural bid and risks a fast mechanical unwind, the bearish mirror of the bullish bond squeeze. Brent settled 107.63 dollars Thursday, up 6.3 percent, then eased to near 105 Friday, with WTI near 99.70 and dated Brent around 114, all against US-Iran escalation that has cut Hormuz flows to about 2 million barrels per day from 8 to 9 before the conflict. Wednesday is the Fed. Friday, September 18, stacks the SPX expiry with its 1.35 put/call, the BoJ decision priced at 96.3 percent for a move toward 1.25 percent, an FTSE Russell rebalance carrying roughly 13 billion of EM two-way flow and about 19 billion across APAC, and UK CPI. Three to four detonators fire in the same session.
The one-line read
The whole market is leaning on one trade, long oil and long equities and short bonds, funded from positioning floors and priced through a vol surface that assumes nothing happens, into a Fed meeting the market has already decided and a put-heavy expiry 48 hours later, with dealers short 55.9 billion of gamma to amplify whatever moves first. That is a squeeze setup, and the Fed picks the direction: a dovish blink or a clean hike lights short-covering, gamma re-hedging, and systematic re-leveraging off the lows into a mechanical melt-up, while a hike with hawkish guidance validates the put book and turns negative gamma into a sell accelerant. The honest read is symmetric on direction and one-sided on magnitude. The event is binary, the surface is not pricing it, and the move is likely bigger than the premium charged.
Djellal Djouad
Sources: Goldman Sachs, BofA Systematic Flows, Nomura (Charlie McElligott), JPMorgan, UBS, Morgan Stanley, MUFG, ING, Standard Chartered, ABN AMRO, Bloomberg WIRP, Kpler via Rigzone, US Treasury auction and buyback results, exchange SPX open interest data.
Further reading